


We are thrilled to announce the public alpha release of TigerGraph CoPilot, the AI assistant for TigerGraph-powered solutions. It is now available at https://github.com/tigergraph/CoPilot for alpha testing. CoPilot is meticulously designed to enhance productivity across various business functions, including analytics, development, and administration tasks. It empowers business analysts, data scientists, and developers to use natural language to run real-time queries against up-to-date data at scale. The insights can then be presented as natural language, graph visualizations, and other perspectives.
TigerGraph CoPilot revolutionizes generative AI applications by offering higher accuracy outcomes and reduced hallucinations. Its benefits are invaluable across a spectrum of domains, including customer service, marketing, sales, data science, DevOps, and engineering. With CoPilot, organizations can unlock the full potential of their data and drive informed decision-making like never before.
Bridging LLMs and Graphs
Generative AI and Large Language Models (LLMs) are on everyone’s mind – we all are familiar with GPT-3 and ChatGPT. These tools are useful, but what if you have questions about data? Consider scenarios where businesses seek insights into financial opportunities based on account status or doctors require assistance in determining the most suitable care paths for patients given their health history. Not only LLMs have to analyze sensitive data, but it needs to be done without compromising privacy and relying on ground-truth data.
The LLM has to retrieve information from a source of ground-truth data, and reason with this data. If you think that, for example you could pass all your financial account statements to a model, and it would figure it out – that’s not exactly how it works.
Since LLMs are neural networks, they operate on an input of limited size. That means that users are limited by how much data they can pass into the model at a time, known as a context length. LLMs have a limited number of tokens that they can take at once. Additionally, LLM API providers, such as OpenAI, charge businesses by their token usage, and therefore businesses want to limit the amount of data they pass to the model, and still get high quality results.
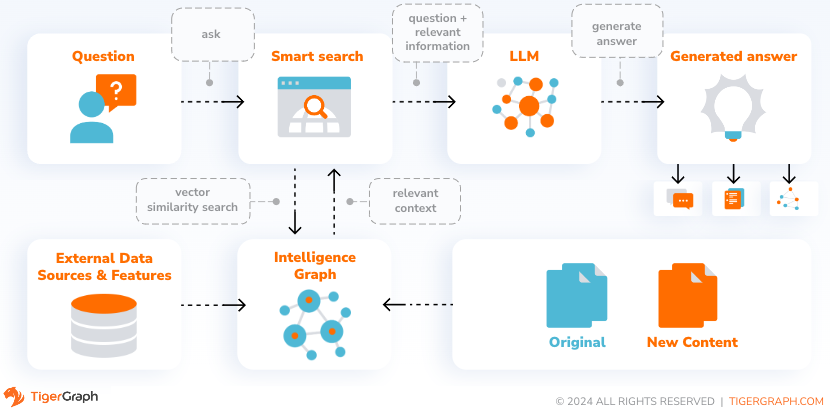
What if there was a highly scalable, content-rich data store for ground-truth information, which could efficiently return just the relevant information? Then, LLMs could reason and interact with these data sources in a token-efficient manner by calling APIs to get the exact data they need to answer the question, rather than a customer’s entire history.
Empowering LLM with our scalable, concise, and context-rich knowledge graph
When talking about highly scalable, relationship-rich, and generally deduplicated data sources, graph databases usually come to mind. Graphs in general naturally fit the relationship-rich data that LLMs can reason very well with. TigerGraph specifically has the capability to scale beyond 10s of TBs, and many of our customers deduplicate their data via entity resolution algorithms run within the database. Additionally, TigerGraph allows for the scalable execution of graph algorithms that can abstract questions, such as who is the most influential or where are entities forming into communities within the database. The next question is, how can we combine the best from both worlds – TigerGraph and GenAI?
TigerGraph CoPilot
TigerGraph CoPilot is an AI assistant for your TigerGraph-powered solutions and tools. It is designed to boost your productivity and simplify many of your business analytics, development and administration tasks by leveraging cutting-edge GenAI technologies. You can ask questions in natural language about your data, determine the best query needed to answer your question, run the query, and return the results based on the data you have access to. There will be more exciting functionalities added in the future releases, such as an end-to-end graph retrieval-augmented generation (RAG) solution to build a Q&A chatbot on your own documents. We’ve included a brief roadmap at the end of this article.
CoPilot leverages the TigerGraph database, the most scalable and high-performing platform for connected data. backed by the TigerGraph database, the most scalable and performant platform for connected data. This integration offers several advantages: 1. CoPilot will be able to run graph analytics and get the insights from your connected data much faster than other LLM+graph solutions. 2. It can utilize a much larger-scale knowledge base when answering your question than other knowledge-graph powered Q&A solutions.
Responsible AI is a core design principle for TigerGraph CoPilot. Its unique approach of having the LLMs identify and run curated queries and algorithms greatly mitigates LLMs’ hallucination problem and gets more reliable results. That is especially important to non-technical users such as business analysts.
Besides, CoPilot adheres to the same role-based access control (RBAC) and security measures that are already a part of the TigerGraph database. We also provide transparency by open-sourcing CoPilot’s major components and allowing users to choose their LLM service.
Under the Hood
In a nutshell, CoPilot is a service that leverages a LLM to reason and perform sequences of tasks on the data in your TigerGraph database. For a deeper dive into the technical inspirations behind CoPilot, please refer to our previous blog post Integrating TigerGraph and Large Language Models for Generative AI. A high-level workflow of how CoPilot handles a natural-language question is below.
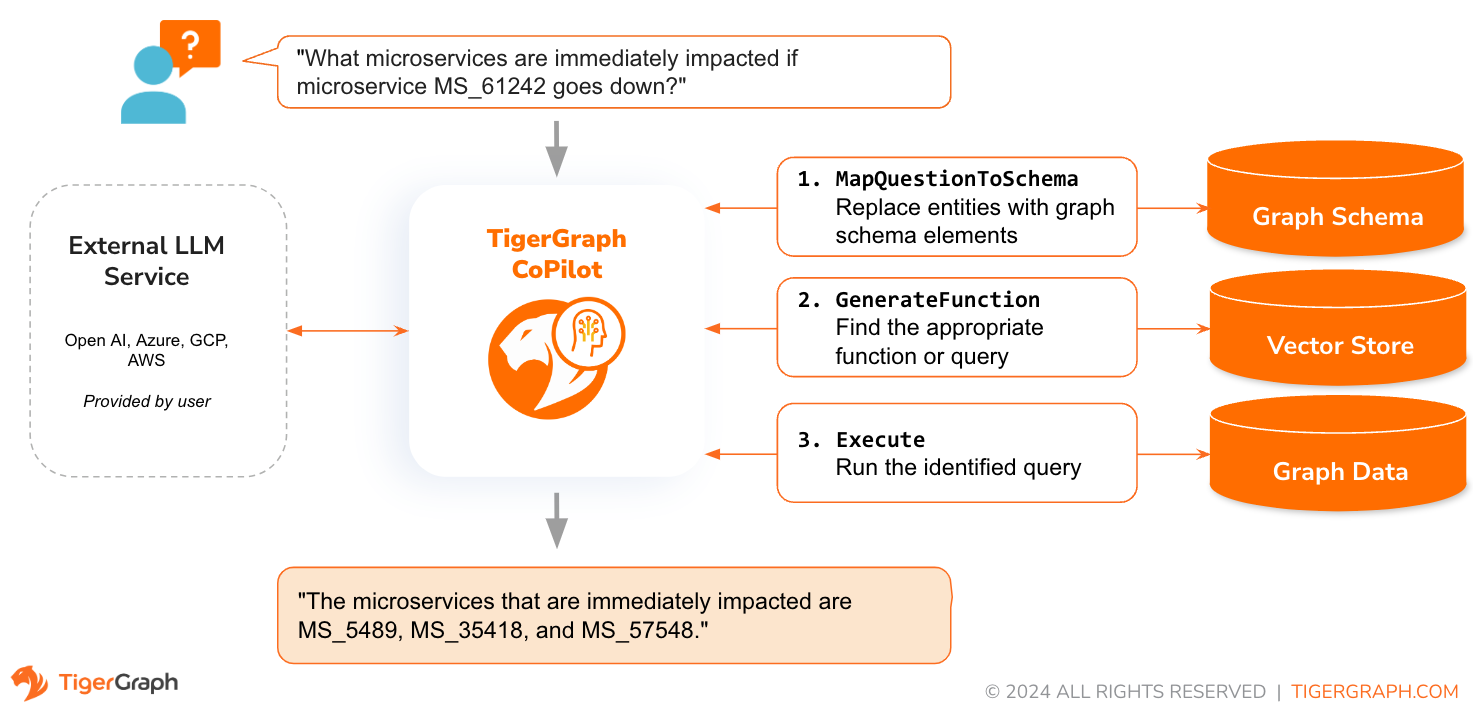
First, it uses the LLM to compare the question with the graph’s schema and replace entities in the question by graph elements. For example, if there is a vertex type of “BareMetalNode” and the user asks “How many servers are there?”, the question will be translated to “How many BareMetalNode vertices are there?”.
Then, the transformed question is passed to the LLM again along with available functions and GSQL queries in your TigerGraph database to identify the appropriate function to run. Continuing the example, the question “How many servers are there?” will then be converted to “getVertexCount(“BareMetalNode”)”, which is the correct function to call. By sticking with pre-defined functions and queries, CoPilot provides strong guardrails: mitigating risk of LLM’s hallucination problem, clarity of the meaning of each query, and solid understanding of the consequences. To help CoPilot find the correct query, you only need to provide a short but informative description of your GSQL queries through the process of query registration. An example will be shown in the demo later.
Finally, CoPilot executes the identified function. The result contains not only the database’s responses, but also the parsed version in natural language and the whole reasoning behind all the actions taken by CoPilot.
CoPilot in Action
Let’s see how CoPilot works in action. We are using the public alpha version of CoPilot. It is now open-sourced and available at https://github.com/tigergraph/CoPilot for alpha testing. All the files for the following demo example are included there. Below we highlight a few key steps to demonstrate how to extract insights from the example digital infrastructure graph by “talking” to CoPilot.
First, running a TigerGraph database with version 3.9+ is required. The easiest way to get a database running is through TigerGraph Cloud. Then, we use the python library pyTigerGraph to load the DigitalInfra dataset into the database.
from pyTigerGraph.datasets import Datasets
# First download the dataset
dataset = Datasets(“DigitalInfra”)
# Then create a connection and ingest it into the database. If your database doesn’t have token authentication enabled, then set `getToken` to False. Databases on TigerGraph Cloud always have token authentication enabled.
from pyTigerGraph import TigerGraphConnection
# Create a connection to the database
conn = TigerGraphConnection(
host=“https://YOUR_DB_ADDRESS”,
username=“YOUR_DB_USERNAME”,
password=“YOUR_DB_PASSWORD”)
# Ingest
conn.ingestDataset(dataset, getToken=True)
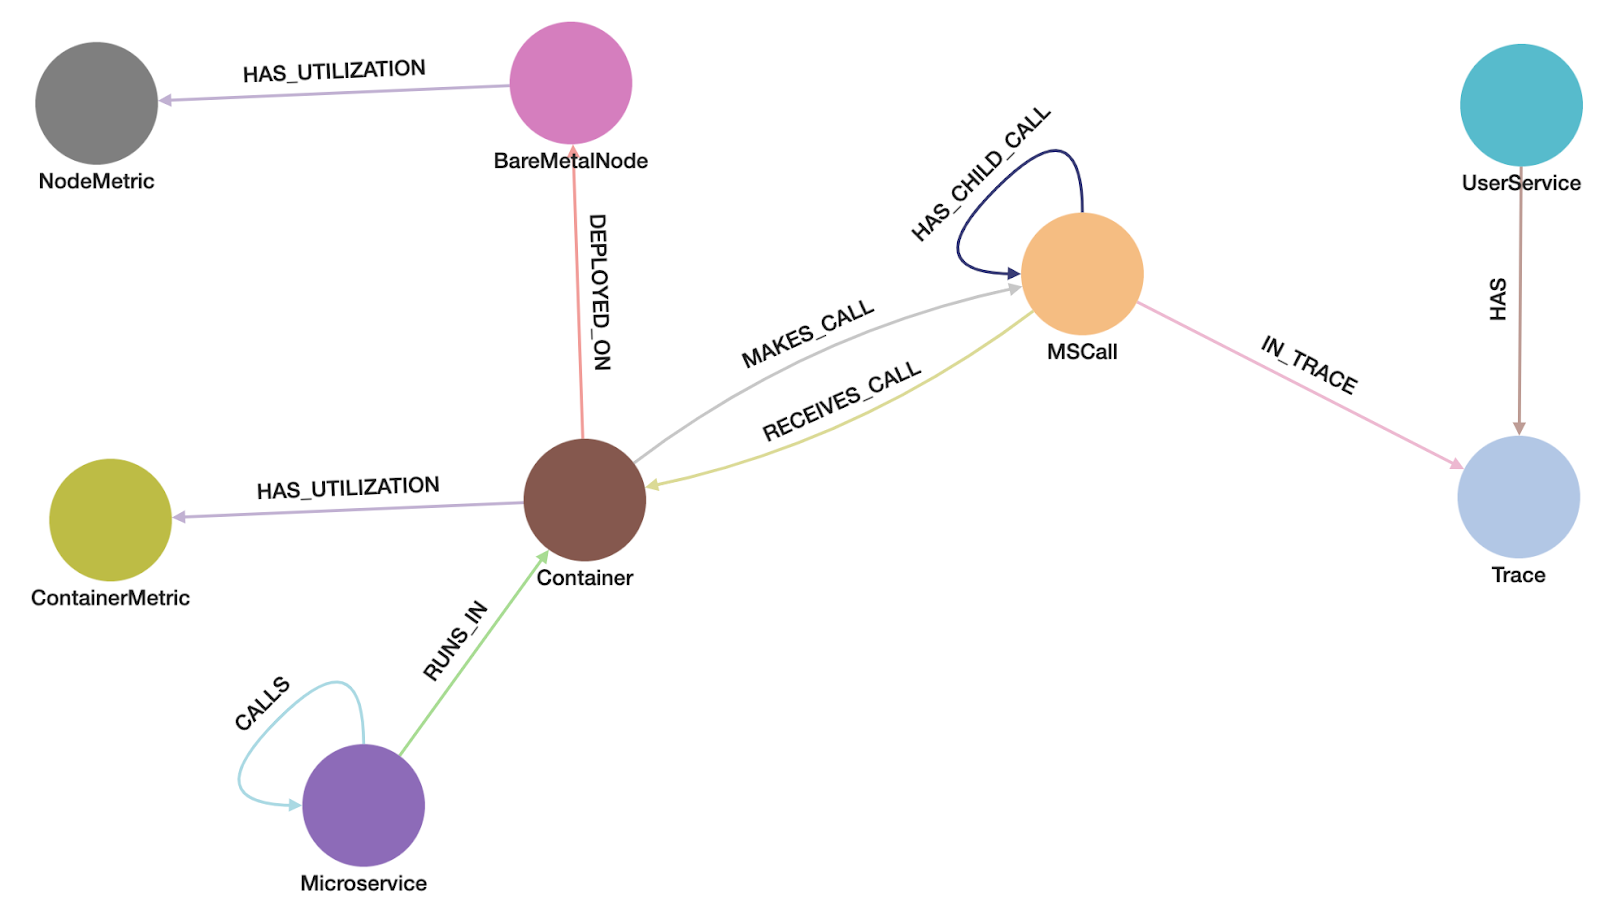
This graph is derived from Alibaba’s Cluster Trace Program dataset, which is a large-scale but detailed dataset about Alibaba’s production data centers. We extract a small graph for demo purposes, but the graph is still representative of the architecture of real data centers. It consists of vertices such as microservices, containers and bare metal nodes, as well as the relationships between them as edges, including how microservices call each other, on which bare metal a container is deployed, and so on.
A screenshot of the graph schema is shown below.
Next, we need to set up the CoPilot service. The easiest way is to run it from its Docker image:
docker run -d -v ./configs/llm_config.json:/llm_config.json -v ./configs/db_config.json:/db_config.json –name copilot -p 80:80 tigergraphml/copilot
where llm_config.json and db_config.json
are configuration files for your LLM provider and TigerGraph database, respectively. The format for these configuration files is given in the documentation.
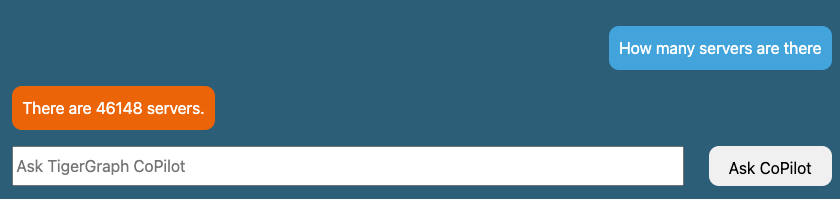
After CoPilot is running, we are going to start with some simple questions, such as asking how many servers are there in our example data center.
conn.ai.query(“How many servers are there?“)
If successful, you should see the following response:
{‘natural_language_response’: ‘There are 46148 servers.’,
‘answered_question’: True,
‘query_sources’: {‘function_call’: “getVertexCount(‘BareMetalNode’)”,
‘result’: 46148,
‘reasoning’: “The function getVertexCount is used because we need to count the number of vertices of a specific type, in this case ‘BareMetalNode’. The function returns the number of vertices of the specified type, which is exactly what the question is asking for.”}}
Just like LLMs choose words to build a sentence, CoPilot chooses the best database query and parameters for the situation. In this case, CoPilot chose to run ge
tVertexCount, a simple query that is built into TigerGraph. Users can also provide queries of their own. They just need to install the query into TigerGraph and register it with CoPilot. Below we install a query that looks up microservices depending on a given microservice:
conn.gsql(“””USE GRAPH DigitalInfra
CREATE OR REPLACE DISTRIBUTED QUERY ms_dependency_chain(VERTEX<Microservice> microservice, INT depth = 3) FOR GRAPH DigitalInfra {
SetAccum<EDGE> @@dependency_edges;
SetAccum<VERTEX> @@dependencies;
start = {microservice};
FOREACH i IN RANGE[0, depth-1] DO
start = SELECT t FROM start:s -(reverse_CALLS:e)-> Microservice:t
ACCUM @@dependency_edges += e
POST-ACCUM @@dependencies += t;
END;
PRINT start;
PRINT @@dependencies, @@dependency_edges;
}
INSTALL QUERY ms_dependency_chain
“””)
In order for CoPilot to use this query to answer questions regarding dependencies between the microservices, we need to provide some “hints”, or in our terminology, register the query with CoPilot by providing the following information (especially the docstring).
custom_query = {
“function_header”: “ms_dependency_chain”,
“description”: “Finds dependents of a given microservice up to k hops.”,
“docstring”: “Finds dependents of a given microservice. Useful for determining effects of downtime for upgrades or bugs. Run the query with `runInstalledQuery(‘ms_dependency_chain’, params={‘microservice’: ‘INSERT_MICROSERVICE_ID_HERE’, ‘depth’: INSERT_DEPTH_HERE})`. Depth defaults to 3.”,
“param_types”: {“microservice”: “str”, “depth”: “int”}
}
# Register the query
conn.ai.registerCustomQuery(
custom_query[“function_header”],
custom_query[“description”],
custom_query[“docstring”],
custom_query[“param_types”])
Then we can ask questions that might be more interesting to system administrators:
conn.ai.query(“What microservices are immediately impacted if microservice MS_61242 goes down?“)
CoPilot should be able to call the query to find out that microservices MS_5489, MS_35418, and MS_57548 are immediately impacted because they are direct dependents. The full result is quite long so we only attach the most relevant part here.
{
‘natural_language_response’: ‘The microservices that are immediately impacted if microservice MS_61242 goes down are MS_5489, MS_35418, and MS_57548.’,
‘query_sources’: {‘function_call’: “runInstalledQuery(‘ms_dependency_chain’, params={‘microservice’: ‘MS_61242’, ‘depth’: 1})”},
‘reasoning’: “The question asks for the microservices that are immediately impacted if a specific microservice goes down. This is essentially asking for the dependents of the given microservice. The ‘ms_dependency_chain’ query is designed to find the dependents of a given microservice, which is exactly what we need for this question. We set the ‘microservice’ parameter to ‘MS_61242’ as that is the microservice in question, and we set the ‘depth’ parameter to 1 as we are only interested in the microservices that are immediately impacted.“
}
If you prefer a graphical interface to writing code, the alpha version comes with a primitive chatbot interface. An improved chatbot UI will be added in the next release. Simply go to http://YOUR_COPILOT_HOST/DigitalInfra/chat , and chat with your graph.
What’s Next
TigerGraph CoPilot combines the best of both worlds: the reasoning and natural language capabilities of LLMs and the up-to-date rich data representations provided by the TigerGraph database. Through the data’s representation in a graph format, CoPilot can answer very complex and abstract questions even at the alpha stage, such as: find the most influential research papers, or detect a community of bad actors in a financial graph. This integration opens the door to enabling business analysts to be more productive and have richer information at their fingertips. Yet, this is just the beginning; more exciting features will be added in the next few releases including:
- Integration with TigerGraph Cloud with a well-designed graphical user interface.
- Ability to load your own documents to build a QA chatbot powered by advanced knowledge graph and vector hybrid retrieval technology.
- GSQL query generation and eventually graph schema and loading job generation.
Ready to try it out yourself? The public alpha version is available now at https://github.com/tigergraph/CoPilot. Let us know what you think, we are here at info@localhost.


