Skip to content
START FOR FREE
START FOR FREE
  • SUPPORT
  • COMMUNITY
  • CONTACT US
  • SUPPORT
  • COMMUNITY
  • CONTACT US
MENUMENU
  • Products
    • The World’s Fastest and Most Scalable Graph Platform

      LEARN MORE

      Watch a TigerGraph Demo

      TIGERGRAPH CLOUD

      • Overview
      • TigerGraph Cloud Suite
      • FAQ
      • Pricing

      USER TOOLS

      • GraphStudio
      • Insights
      • Application Workbenches
      • Connectors and Drivers
      • Starter Kits
      • openCypher Support

      TIGERGRAPH DB

      • Overview
      • GSQL Query Language
      • Compare Editions

      GRAPH DATA SCIENCE

      • Graph Data Science Library
      • Machine Learning Workbench

      Success Plans

  • Solutions
    • The World’s Fastest and Most Scalable Graph Platform

      LEARN MORE

      Watch a TigerGraph Demo

      Solutions

      • Solutions Overview

      INCREASE REVENUE

      • Customer Journey/360
      • Product Marketing
      • Entity Resolution
      • Recommendation Engine

      MANAGE RISK

      • Fraud Detection
      • Anti-Money Laundering
      • Threat Detection
      • Risk Monitoring

      IMPROVE OPERATIONS

      • Supply Chain Analysis
      • Energy Management
      • Network Optimization

      By Industry

      • Advertising, Media & Entertainment
      • Financial Services
      • Healthcare & Life Sciences

      FOUNDATIONAL

      • AI & Machine Learning
      • Time Series Analysis
      • Geospatial Analysis
  • Customers
    • The World’s Fastest and Most Scalable Graph Platform

      LEARN MORE

      CUSTOMER SUCCESS STORIES

      • Ford
      • Intuit
      • JPMorgan Chase
      • READ MORE SUCCESS STORIES
      • Jaguar Land Rover
      • Xbox
  • Partners
    • The World’s Fastest and Most Scalable Graph Platform

      LEARN MORE

      PARTNER PROGRAM

      • Partner Benefits
      • TigerGraph Partners
      • Sign Up
      TigerGraph partners with organizations that offer complementary technology solutions and services.​
  • Resources
    • The World’s Fastest and Most Scalable Graph Platform

      LEARN MORE

      BLOG

      • TigerGraph Blog

      RESOURCES

      • Resource Library
      • Benchmarks
      • Demos
      • O'Reilly Graph + ML Book

      EVENTS & WEBINARS

      • Events &Trade Shows
      • Webinars

      DEVELOPERS

      • Documentation
      • Ecosystem
      • Developers Hub
      • Community Forum

      SUPPORT

      • Contact Support
      • Production Guidelines

      EDUCATION

      • Training & Certifications
  • Company
    • Join the World’s Fastest and Most Scalable Graph Platform

      WE ARE HIRING

      COMPANY

      • Company Overview
      • Leadership
      • Legal Terms
      • Patents
      • Security and Compliance

      CAREERS

      • Join Us
      • Open Positions

      AWARDS

      • Awards and Recognition
      • Leader in Forrester Wave
      • Gartner Research

      PRESS RELEASE

      • Read All Press Releases
      TigerGraph Debuts TigerGraph CoPilot for Graph-Augmented AI, New Cloud-Native Generation of TigerGraph Cloud, and Solution Kits
      April 30, 2024
      Read More »

      NEWS

      • Read All News

      Best paper award at International Conference on Very Large Data Bases

      New TigerGraph CEO Refocuses Efforts on Enterprise Customers

  • START FREE
    • The World’s Fastest and Most Scalable Graph Platform

      GET STARTED

      • Request a Demo
      • CONTACT US
      • Try TigerGraph
      • START FREE
      • TRY AN ONLINE DEMO

Supply Chain Digital Twins Enable Analytics and Resiliency

  • Victor Lee
  • May 29, 2024
  • blog, blogs, Digital Transformation, Management, & Strategy, Digital Twin, Retail, Manufacturing, and Supply Chain, Supply Chain
  • Blog >
  • Supply Chain Digital Twins Enable Analytics and Resiliency

In March 2024, the Francis Scott Key Bridge across the entrance to Baltimore Harbor collapsed when a cargo ship lost power and crashed into it. Tragically, six bridge workers lost their lives. The economic cost has been significant as well. Sea traffic in and out of the harbor was halted for a month. Baltimore is the United States’ number one port of entry for passenger vehicles, work trucks, plywood and laminated wood, nickel, zinc, aluminum, and many other finished and intermediate materials.[1]

Thirty thousand vehicles that used to cross the bridge each day now take longer, slower routes. That includes 5,000 trucks carrying $28 billion of goods.[2] Rebuilding the bridge may take four years.

Francis Scott Key Bridge and Cargo Ship Dali, March 2024

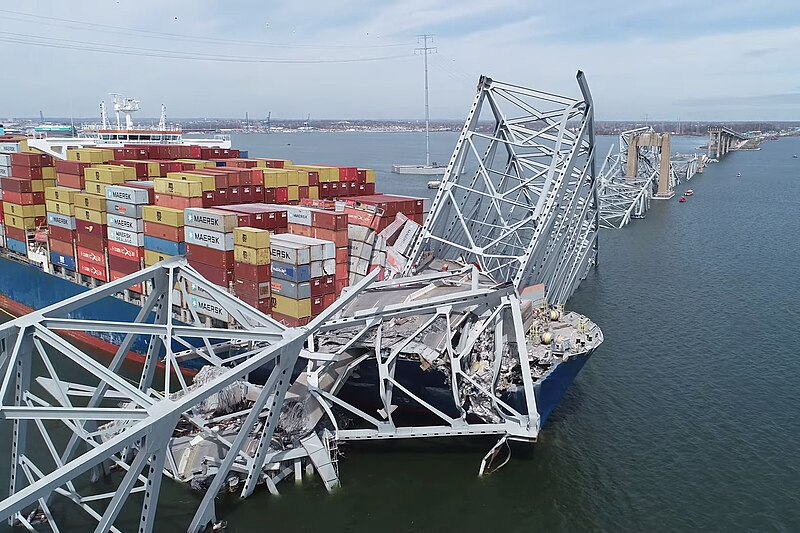
Francis Scott Key Bridge and Cargo Ship Dali, March 2024. Source: ntsb.gov

Was your business impacted by the bridge collapse? How quickly would you know if your supply chain has been disrupted? Many businesses can’t afford to rely on their direct suppliers to make best efforts. These businesses  monitor the daily activities of multiple levels of production. In some cases, they acquire at least partial ownership of suppliers, to help to guarantee reliable production.

We can’t predict events like the Baltimore bridge collapse, but businesses can improve their responsiveness and resiliency.

More and more companies are seeing the wisdom of building and maintaining a digital twin of their supply chain – to show them how everything should fit together and to analyze what-if scenarios. From there, businesses can make adjustments to the supply chain to improve performance, lower costs, and increase resiliency.

Graph: The Natural Choice for Supply Chain Modeling

For a supply chain digital twin, a graph database makes a lot of sense. The key entities (components, suppliers, assembly facilities) and their key details (capacity, costs, location, throughput time) can be modeled in almost any database. In a supply chain, however, the connections and dependencies are the whole game, and graphs are designed to treat connections as data.

supply chain depicted as a graph

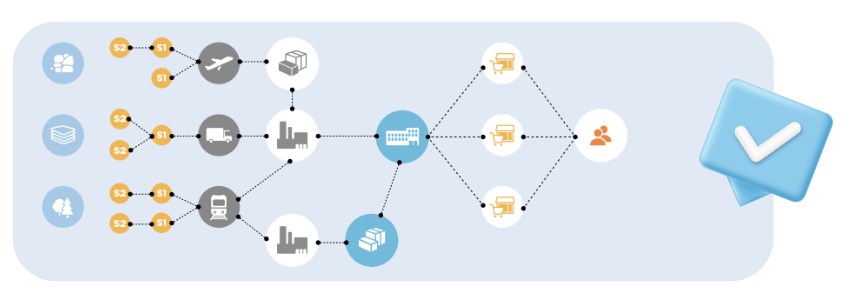
Graphs are a natural model for supply chain modeling.

Traditional data systems have been based on tables of information. A table can answer a simple question like “which suppliers are in Brazil?”, but table-based systems are slow and difficult to use when the task requires tracing several levels of connection to answer more refined questions, such as: what components do the Brazilian suppliers make, which assemblies use those components, which products use those assemblies, who is shipping those products, and who has an important order for those products? For a graph database, on the other hand, tracing downstream from a point is a very simple query, sometimes known as Directed Breadth First Search. If Brazil is modeled as a node, then we could find every affected entity using this GSQL snippet:

Source = {Brazil};
Affected = SELECT t FROM Source:s -(>*)- :t;

 Your digital twin can answer questions like:

  • • Bill of Materials: List ALL the components needed to produce one unit of a product. Who are all the possible suppliers for each component?
  • • Downstream analysis: If plywood arriving in Baltimore is delayed, how will that affect a home builder in Ohio?
  • • Upstream (root cause) analysis: a quality control problem has popped for an access panel 

An interesting use case is when multiple downstream symptoms occur. We can use the graph-based digital twin to trace upstream for the multiple paths simultaneously, to see where the paths intersect. These intersection points represent possible single causes that resulted in multiple downstream problems, as shown in the following figure:

tracing the common upstream factors of two quality problems

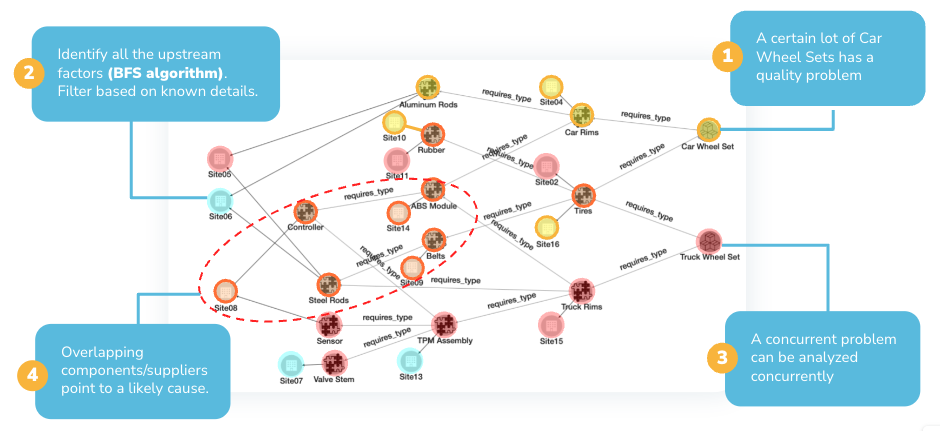
Tracing two quality problems upstream to see if there is a common cause.

The graph-based digital twin gives you the agility to detect problems and respond quickly: trace causes or consequences, uncover alternative paths, and simulate the effect of remediation.

Perform Deeper Analysis

A good digital twin not only understands connections, but it also analyzes them. That is, it can gather data as you traverse the nodes and edges of the graph, perform computations and make assessments in order to calculate scores, find patterns, rank one situation compared to another, and find outliers. Wondering whether using the cheapest supplier for each component actually leads to the cheapest total cost of production?  Find the actual cheapest total cost using a weighted shortest path algorithm. Wondering which assembly facility is bringing together the most components for the most different products? The betweenness centrality graph algorithm ranks nodes according to that sense of being “in the middle of things”.

A number of useful analyses can be performed either by generic graph algorithms or predictable analyses used for supply chains, such as “report the bill of materials for product X.”  However, every business has unique issues and unique questions. Forward-thinking businesses are looking for platforms that not only handle their needs today, but have the extensibility and flexibility to handle tomorrow’s needs.

Optimize Your Supply Chain for Resiliency

Businesses are seeing that it’s not enough to monitor and react quickly. That’s being reactive. They need to be proactive: anticipate and restructure to reduce the impact of possible disruptions. Businesses need to make their supply chains more resilient, so that they will continue to operate at acceptable levels, despite a range of impacts. 

It’s helpful to deconstruct the risk from disruptions into a few components:

  • • What is the probability of a disruption?
  • • What would be the cost of a disruption?

Estimate Probability of Disruption

Estimating the probability of a disruption can be hard. There are so many factors which are hard to put a number on. It is helpful to break this down into different factors. as weather, government regulations, past performance of the supplier, etc. In some cases, the best you may be able to do is to rank components or suppliers relative to one another. Even without exact numbers, we can logically deduce two axioms:

  1. 1. Increasing the number of subcomponents required to make a product will increase the likelihood of a disruption.
  2. 2. Adding alternate suppliers for a component will decrease the likelihood of a disruption.


A digital twin can be programmed to take the estimated probabilities or rankings of base-level factors and then apply the mathematics of probability to compute downstream probabilities. First compute the probability of disruption for the initial stages of production. Then work down level by level until you eventually get to finished goods.

Compute the Cost of a Disruption

If a part is completely unavailable or an essential machine is broken, we trace down the supply chain to see which subsequent operations are halted. Perhaps you have some existing inventory you can use for a while, but at some point, everything downstream will grind to a halt. If the disruption is a price change or a delay, your digital twin can add up those costs too, much the same way that it can compute a bill of materials.

Test and Make Optimizations

Once you’ve scored your supply chain components and suppliers for risk, then it’s time to take action. The analytics will not only point to the most risky aspects, but they will hint at what changed will reduce the risk. Whether the change is to qualify alternate suppliers, to move the location for an operation, or to seek a more modular design with interchangeable parts, the digital twin allows you to simulate the expected result and to monitor actual results.

The Benefits of Graph-Based Digital Twins

Businesses in many different sectors, from automobile manufacturing to personal care products, grocery stores, and biotechnology are exploring and using a graph analytics platform like TigerGraph to model their supply chain or manufacturing processes. The benefits they see include:

  • • The ability to model very complex systems in an easy-to-understand and easy -to-update fashion
  • • Rapid and flexible reports on upstream and downstream dependencies
  • • Analytical tools for optimizing and improving the resiliency of their processes
  • • The ability to easily develop new analytics
  •  
  • At TigerGraph’s recent Graph AI Summit, a workshop focused on a graph-based digital twin solution for supply chains.
  •  

TigerGraph will soon be releasing Solution Kits targeting supply chain and other operational network use cases.  To learn more, visit tigergraph.com or drop us a line at info@localhost. 


You Might Also Like

Graph Developer Proficiency Rating

Graph Developer Proficiency Rating

June 16, 2024
Putting the Customer First: The Power of the Empty Chair

Putting the Customer First: The Power...

May 17, 2024
Join TigerGraph at ENGAGE 2024: Advancing Financial Crime Solutions

Join TigerGraph at ENGAGE 2024: Advancing...

May 13, 2024

Victor Lee

TigerGraph Blog

  • Categories
    • blogs
      • Customer 360
      • Cybersecurity
      • Developers
      • Digital Twin
      • Engineers
      • Fraud / Anti-Money Laundering
      • GQL
      • GSQL
      • Supply Chain
      • TigerGraph
      • TigerGraph Cloud
    • Graph AI On Demand
      • Customer Spotlight
      • Digital Transformation, Management, & Strategy
      • Finance, Banking, Insurance
      • Graph + AI
      • Graph Algorithms
      • Retail, Manufacturing, and Supply Chain
    • RulesEngine
    • Video
  • Recent Posts

    • Graph Developer Proficiency Rating
    • Supply Chain Digital Twins Enable Analytics and Resiliency
    • Welcome to ENGAGE 2024!
    • Putting the Customer First: The Power of the Empty Chair
    • Join TigerGraph at ENGAGE 2024: Advancing Financial Crime Solutions
    TigerGraph

    Product

    SOLUTIONS

    customers

    RESOURCES

    start for free

    TIGERGRAPH DB
    • Overview
    • Features
    • GSQL Query Language
    GRAPH DATA SCIENCE
    • Graph Data Science Library
    • Machine Learning Workbench
    TIGERGRAPH CLOUD
    • Overview
    • Cloud Starter Kits
    • Login
    • FAQ
    • Pricing
    • Cloud Marketplaces
    USEr TOOLS
    • GraphStudio
    • TigerGraph Insights
    • Application Workbenches
    • Connectors and Drivers
    • Starter Kits
    • openCypher Support
    SOLUTIONS
    • Why Graph?
    industry
    • Advertising, Media & Entertainment
    • Financial Services
    • Healthcare & Life Sciences
    use cases
    • Benefits
    • Product & Service Marketing
    • Entity Resolution
    • Customer 360/MDM
    • Recommendation Engine
    • Anti-Money Laundering
    • Cybersecurity Threat Detection
    • Fraud Detection
    • Risk Assessment & Monitoring
    • Energy Management
    • Network & IT Management
    • Supply Chain Analysis
    • AI & Machine Learning
    • Geospatial Analysis
    • Time Series Analysis
    success stories
    • Customer Success Stories

    Partners

    Partner program
    • Partner Benefits
    • TigerGraph Partners
    • Sign Up
    LIBRARY
    • Resources
    • Benchmark
    • Webinars
    Events
    • Trade Shows
    • Graph + AI Summit
    • Million Dollar Challenge
    EDUCATION
    • Training & Certifications
    Blog
    • TigerGraph Blog
    DEVELOPERS
    • Developers Hub
    • Community Forum
    • Documentation
    • Ecosystem

    COMPANY

    Company
    • Overview
    • Careers
    • News
    • Press Release
    • Awards
    • Legal Terms
    • Patents
    • Security and Compliance
    • Contact
    Get Started
    • Start Free
    • Compare Editions
    • Online Demo - Test Drive
    • Request a Demo

    Product

    • Overview
    • TigerGraph 3.0
    • TIGERGRAPH DB
    • TIGERGRAPH CLOUD
    • GRAPHSTUDIO
    • TRY NOW

    customers

    • success stories

    RESOURCES

    • LIBRARY
    • Events
    • EDUCATION
    • BLOG
    • DEVELOPERS

    SOLUTIONS

    • SOLUTIONS
    • use cases
    • industry

    Partners

    • partner program

    company

    • Overview
    • news
    • Press Release
    • Awards

    start for free

    • Request Demo
    • take a test drive
    • SUPPORT
    • COMMUNITY
    • CONTACT
    • Copyright © 2024 TigerGraph
    • Privacy Policy
    • Linkedin
    • Twitter

    Copyright © 2020 TigerGraph | Privacy Policy

    Copyright © 2020 TigerGraph Privacy Policy

    • SUPPORT
    • COMMUNITY
    • COMPANY
    • CONTACT
    • Linkedin
    • Facebook
    • Twitter

    Copyright © 2020 TigerGraph

    Privacy Policy

    • Products
    • Solutions
    • Customers
    • Partners
    • Resources
    • Company
    • START FREE
    START FOR FREE
    START FOR FREE
    TigerGraph
    PRODUCT
    PRODUCT
    • Overview
    • GraphStudio UI
    • Graph Data Science Library
    TIGERGRAPH DB
    • Overview
    • Features
    • GSQL Query Language
    TIGERGRAPH CLOUD
    • Overview
    • Cloud Starter Kits
    TRY TIGERGRAPH
    • Get Started for Free
    • Compare Editions
    SOLUTIONS
    SOLUTIONS
    • Why Graph?
    use cases
    • Benefits
    • Product & Service Marketing
    • Entity Resolution
    • Customer Journey/360
    • Recommendation Engine
    • Anti-Money Laundering (AML)
    • Cybersecurity Threat Detection
    • Fraud Detection
    • Risk Assessment & Monitoring
    • Energy Management
    • Network Resources Optimization
    • Supply Chain Analysis
    • AI & Machine Learning
    • Geospatial Analysis
    • Time Series Analysis
    industry
    • Advertising, Media & Entertainment
    • Financial Services
    • Healthcare & Life Sciences
    CUSTOMERS
    read all success stories


    PARTNERS
    Partner program
    • Partner Benefits
    • TigerGraph Partners
    • Sign Up
    RESOURCES
    LIBRARY
    • Resource Library
    • Benchmark
    • Webinars
    Events
    • Trade Shows
    • Graph + AI Summit
    • Graph for All - Million Dollar Challenge
    EDUCATION
    • TigerGraph Academy
    • Certification
    Blog
    • TigerGraph Blog
    DEVELOPERS
    • Developers Hub
    • Community Forum
    • Documentation
    • Ecosystem
    COMPANY
    COMPANY
    • Overview
    • Leadership
    • Careers  
    NEWS
    PRESS RELEASE
    AWARDS
    START FREE
    Start Free
    • Request a Demo
    • SUPPORT
    • COMMUNITY
    • CONTACT
    Dr. Jay Yu

    Dr. Jay Yu | VP of Product and Innovation

    Dr. Jay Yu is the VP of Product and Innovation at TigerGraph, responsible for driving product strategy and roadmap, as well as fostering innovation in graph database engine and graph solutions. He is a proven hands-on full-stack innovator, strategic thinker, leader, and evangelist for new technology and product, with 25+ years of industry experience ranging from highly scalable distributed database engine company (Teradata), B2B e-commerce services startup, to consumer-facing financial applications company (Intuit). He received his PhD from the University of Wisconsin - Madison, where he specialized in large scale parallel database systems

    Todd Blaschka | COO

    Todd Blaschka is a veteran in the enterprise software industry. He is passionate about creating entirely new segments in data, analytics and AI, with the distinction of establishing graph analytics as a Gartner Top 10 Data & Analytics trend two years in a row. By fervently focusing on critical industry and customer challenges, the companies under Todd's leadership have delivered significant quantifiable results to the largest brands in the world through channel and solution sales approach. Prior to TigerGraph, Todd led go to market and customer experience functions at Clustrix (acquired by MariaDB), Dataguise and IBM.