Skip to content
START FOR FREE
START FOR FREE
  • SUPPORT
  • COMMUNITY
  • CONTACT US
  • SUPPORT
  • COMMUNITY
  • CONTACT US
MENUMENU
  • Products
    • The World’s Fastest and Most Scalable Graph Platform

      LEARN MORE

      Watch a TigerGraph Demo

      TIGERGRAPH CLOUD

      • Overview
      • TigerGraph Cloud Suite
      • FAQ
      • Pricing

      USER TOOLS

      • GraphStudio
      • Insights
      • Application Workbenches
      • Connectors and Drivers
      • Starter Kits
      • openCypher Support

      TIGERGRAPH DB

      • Overview
      • GSQL Query Language
      • Compare Editions

      GRAPH DATA SCIENCE

      • Graph Data Science Library
      • Machine Learning Workbench

      Success Plans

  • Solutions
    • The World’s Fastest and Most Scalable Graph Platform

      LEARN MORE

      Watch a TigerGraph Demo

      Solutions

      • Solutions Overview

      INCREASE REVENUE

      • Customer Journey/360
      • Product Marketing
      • Entity Resolution
      • Recommendation Engine

      MANAGE RISK

      • Fraud Detection
      • Anti-Money Laundering
      • Threat Detection
      • Risk Monitoring

      IMPROVE OPERATIONS

      • Supply Chain Analysis
      • Energy Management
      • Network Optimization

      By Industry

      • Advertising, Media & Entertainment
      • Financial Services
      • Healthcare & Life Sciences

      FOUNDATIONAL

      • AI & Machine Learning
      • Time Series Analysis
      • Geospatial Analysis
  • Customers
    • The World’s Fastest and Most Scalable Graph Platform

      LEARN MORE

      CUSTOMER SUCCESS STORIES

      • Ford
      • Intuit
      • JPMorgan Chase
      • READ MORE SUCCESS STORIES
      • Jaguar Land Rover
      • Xbox
  • Partners
    • The World’s Fastest and Most Scalable Graph Platform

      LEARN MORE

      PARTNER PROGRAM

      • Partner Benefits
      • TigerGraph Partners
      • Sign Up
      TigerGraph partners with organizations that offer complementary technology solutions and services.​
  • Resources
    • The World’s Fastest and Most Scalable Graph Platform

      LEARN MORE

      BLOG

      • TigerGraph Blog

      RESOURCES

      • Resource Library
      • Benchmarks
      • Demos
      • O'Reilly Graph + ML Book

      EVENTS & WEBINARS

      • Events &Trade Shows
      • Webinars

      DEVELOPERS

      • Documentation
      • Ecosystem
      • Developers Hub
      • Community Forum

      SUPPORT

      • Contact Support
      • Production Guidelines

      EDUCATION

      • Training & Certifications
  • Company
    • Join the World’s Fastest and Most Scalable Graph Platform

      WE ARE HIRING

      COMPANY

      • Company Overview
      • Leadership
      • Legal Terms
      • Patents
      • Security and Compliance

      CAREERS

      • Join Us
      • Open Positions

      AWARDS

      • Awards and Recognition
      • Leader in Forrester Wave
      • Gartner Research

      PRESS RELEASE

      • Read All Press Releases
      TigerGraph Debuts TigerGraph CoPilot for Graph-Augmented AI, New Cloud-Native Generation of TigerGraph Cloud, and Solution Kits
      April 30, 2024
      Read More »

      NEWS

      • Read All News

      Best paper award at International Conference on Very Large Data Bases

      New TigerGraph CEO Refocuses Efforts on Enterprise Customers

  • START FREE
    • The World’s Fastest and Most Scalable Graph Platform

      GET STARTED

      • Request a Demo
      • CONTACT US
      • Try TigerGraph
      • START FREE
      • TRY AN ONLINE DEMO

The God Graph – How EKGs and Systems Thinking Can Make the World Better

  • Emily McAuliffe
  • November 5, 2020
  • blog, Graph Database Market
  • Blog >
  • The God Graph – How EKGs and Systems Thinking Can Make the World Better

Originally posted on Medium by Dan McCreary. Follow him on LinkedIn.

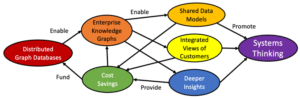
Recent developments in distributed graph database technology have created a Cambrian Explosion in the capabilities of the world’s high-tech companies. Innovations that were once isolated to Bay Area companies like Google, Facebook, LinkedIn, and Twitter have migrated into commercial products like TigerGraph. These enterprise-scale graphs have enabled many companies to use these revolutionary technologies to provide integrated views of their customers and deep insights that save hundreds of millions of dollars a year.

However, making companies more efficient is not the only topic of interest to me. What is most striking is how these new integrated views of knowledge are changing the way we think. The new capabilities that Enterprise Knowlege Graphs have enabled are started to rewire our brains. They are triggering new connections in our brains that have never existed. They are a form of neurogenesis. And the patterns we are learning within the knowledge graph domain are being applied to other domains outside IT. This is the true revolution that is happening in organizations that are building enterprise knowledge graphs.

For the months of November and December, I will be not just focused on the technical aspects of the software and hardware behind enterprise knowledge graphs. I will include topics on how these technologies are forcing us to rethink our business strategy. I hope these articles can impact your IT strategies for 2021.

If you are not familiar with Systems Thinking, let me encourage you to find out more. Please follow my blogs to the end of the year. Systems Thinking is one of the key tools we use to seek out the root causes of problems and to understand how unintended consequences creep into our systems. Existential problems like the widespread extinction of millions of animal species and global warming are not a direct goal of our society. They are the unintended consequence of human population explosion, industrialization, and the burning of fossil fuels. Systems Thinking helps us build complex dependency graphs that can be used to explain what is happening in our IT systems and our society as a whole.

For those of you that are confused about the word “God” in the title of this article (and hopefully an upcoming book), let me explain. Some of you may have heard of the concept of a God Particle that was used to explain some of the forces in subatomic physics. It was a concept that tried to connect many physics theories together. I am also attempting something analogous. But I have a specific intent for using this term.

Primitive societies frequently associated God with a divine being cast in the representation of things they did understand: a human being. In polytheistic religions, these were many humans. But today, we are not constrained by mapping everything we value to a human image. I want to encourage everyone to think of a God Graph as a concept tied closely to sustainable progress for our civilization and the knowledge of all the interconnected systems we need to reach our goals. Our God Graph in this case is holistic Systems Thinking to help us understand how to minimize the unintended consequences to our planet. This is the big scale-out picture. My apologies if I offended anyone. That would be an unintended consequence.

My work with researchers at many companies like TigerGraph, Xilinx, Graphcore, Dell/EMC, and Intel has convinced me that we are just beginning to scratch the surface of what Enterprise Knowledge Graphs will become in the next few years. The cost-effective trillion vertex graph (called a teravertex graph) will be feasible for many organizations outside of Google and Facebook. They will become commodities. But the rules that govern them will be different. Research on scale laws in Complex Adaptive Systems predicts the rules will be different. But they can’t predict what the new rules will be. We can use knowledge of how the current 100 billion vertexes graphs are changing strategy to give us insights into what these rules will be.

Complex Adaptive Systems study scale laws. Every time our knowledge graphs grow an order of magnitude, new challenges, and opportunities arise. And we will see that Systems Graph Thinking applies to many levels of our IT strategy. At the organization level, we see many large organizations that are fragmented by business units and we see many department-level graph databases that focus on their short-term.

At the root cause of failure of many enterprise-level IT strategies is Conway’s Law: The idea that the systems we create in any organization are usually a reflection of our organization chart and may not be optimized to serve our customers or to achieve sustainable growth. It is the job of every CIO to recognize when isolated data silos are preventing efficiencies and enterprise insights. We will be looking at several case studies of how Conway’s Law and short-term thinking has resulted in negative unintended consequences for IT strategies.

Metcalf’s Law on the other hand is usually on the side of the value proposition for Enterprise Knowledge Graphs. Metcalf’s Law states that the value of any network tends to grow exponentially as the number of connections grows. This also applies to insights and discovery. The more systems we connect in our knowledge graph, the lower the cost of each new report, and the lower the cost for deep insight and knowledge discovery becomes.

Many of our readers come from highly decentralized organizations where today, they feel they have little hope of building enterprise knowledge graphs that create 50-millisecond access to 10,000 data points of every customer. We ask you to not lose faith in your ability to have a systemic impact on your organization. We hope to help you create smaller, kinder stepping stones to build a learning organization.

Ironically, I hope you will find that getting started at Systems Thinking is really not that complex. This is not about memorizing and learning how to apply hundreds of named patterns. From what I have learned so far, System Thinking relies on teaching people to look for a core set of patterns that repeat over and over again. We will look at concepts like graph visualization models (a lot like graph modeling), interconnectedness (lots of labeled edges), feedback loops, causality, synthesis, externalities, root cause analysis, resilience, and the evolutionary principles that change systems over time. We hope to use storytelling techniques to help you remember these ideas and make them easy to recognize in your work. We think that if you can retell these stories, convincing other non-technical decision-makers to build enterprise knowledge graphs will be easier.

I should note that I am not an expert on Systems Thinking or its more mathematical cousin, Complex Adaptive Systems Theory, which helps us simulate real-world systems in knowledge graphs. Yet I do have a great coach and mentor in Arun Batchu. Arun is the person that is constantly pushing me to take a more holistic view of enterprise IT strategy and see the “big picture” of trends in the industry. He is a true master in Systems Thinking. Everyone that wants to have an impact using Systems Thinking needs a coach like Arun.

I also want to thank people that have read my blogs and invited me to speak to other influencers. Getting feedback from people like Ellie Young and her Knowlege Graph Conference community has been one of the things that help motivate me to keep writing.

Originally posted on Medium by Dan McCreary. Follow him on LinkedIn.

You Might Also Like

Graph Developer Proficiency Rating

Graph Developer Proficiency Rating

June 16, 2024
Supply Chain Digital Twins Enable Analytics and Resiliency

Supply Chain Digital Twins Enable Analytics...

May 29, 2024
Putting the Customer First: The Power of the Empty Chair

Putting the Customer First: The Power...

May 17, 2024

Emily McAuliffe

TigerGraph Blog

  • Categories
    • blogs
      • Customer 360
      • Cybersecurity
      • Developers
      • Digital Twin
      • Engineers
      • Fraud / Anti-Money Laundering
      • GQL
      • GSQL
      • Supply Chain
      • TigerGraph
      • TigerGraph Cloud
    • Graph AI On Demand
      • Customer Spotlight
      • Digital Transformation, Management, & Strategy
      • Finance, Banking, Insurance
      • Graph + AI
      • Graph Algorithms
      • Retail, Manufacturing, and Supply Chain
    • RulesEngine
    • Video
  • Recent Posts

    • Graph Developer Proficiency Rating
    • Supply Chain Digital Twins Enable Analytics and Resiliency
    • Welcome to ENGAGE 2024!
    • Putting the Customer First: The Power of the Empty Chair
    • Join TigerGraph at ENGAGE 2024: Advancing Financial Crime Solutions
    TigerGraph

    Product

    SOLUTIONS

    customers

    RESOURCES

    start for free

    TIGERGRAPH DB
    • Overview
    • Features
    • GSQL Query Language
    GRAPH DATA SCIENCE
    • Graph Data Science Library
    • Machine Learning Workbench
    TIGERGRAPH CLOUD
    • Overview
    • Cloud Starter Kits
    • Login
    • FAQ
    • Pricing
    • Cloud Marketplaces
    USEr TOOLS
    • GraphStudio
    • TigerGraph Insights
    • Application Workbenches
    • Connectors and Drivers
    • Starter Kits
    • openCypher Support
    SOLUTIONS
    • Why Graph?
    industry
    • Advertising, Media & Entertainment
    • Financial Services
    • Healthcare & Life Sciences
    use cases
    • Benefits
    • Product & Service Marketing
    • Entity Resolution
    • Customer 360/MDM
    • Recommendation Engine
    • Anti-Money Laundering
    • Cybersecurity Threat Detection
    • Fraud Detection
    • Risk Assessment & Monitoring
    • Energy Management
    • Network & IT Management
    • Supply Chain Analysis
    • AI & Machine Learning
    • Geospatial Analysis
    • Time Series Analysis
    success stories
    • Customer Success Stories

    Partners

    Partner program
    • Partner Benefits
    • TigerGraph Partners
    • Sign Up
    LIBRARY
    • Resources
    • Benchmark
    • Webinars
    Events
    • Trade Shows
    • Graph + AI Summit
    • Million Dollar Challenge
    EDUCATION
    • Training & Certifications
    Blog
    • TigerGraph Blog
    DEVELOPERS
    • Developers Hub
    • Community Forum
    • Documentation
    • Ecosystem

    COMPANY

    Company
    • Overview
    • Careers
    • News
    • Press Release
    • Awards
    • Legal Terms
    • Patents
    • Security and Compliance
    • Contact
    Get Started
    • Start Free
    • Compare Editions
    • Online Demo - Test Drive
    • Request a Demo

    Product

    • Overview
    • TigerGraph 3.0
    • TIGERGRAPH DB
    • TIGERGRAPH CLOUD
    • GRAPHSTUDIO
    • TRY NOW

    customers

    • success stories

    RESOURCES

    • LIBRARY
    • Events
    • EDUCATION
    • BLOG
    • DEVELOPERS

    SOLUTIONS

    • SOLUTIONS
    • use cases
    • industry

    Partners

    • partner program

    company

    • Overview
    • news
    • Press Release
    • Awards

    start for free

    • Request Demo
    • take a test drive
    • SUPPORT
    • COMMUNITY
    • CONTACT
    • Copyright © 2024 TigerGraph
    • Privacy Policy
    • Linkedin
    • Twitter

    Copyright © 2020 TigerGraph | Privacy Policy

    Copyright © 2020 TigerGraph Privacy Policy

    • SUPPORT
    • COMMUNITY
    • COMPANY
    • CONTACT
    • Linkedin
    • Facebook
    • Twitter

    Copyright © 2020 TigerGraph

    Privacy Policy

    • Products
    • Solutions
    • Customers
    • Partners
    • Resources
    • Company
    • START FREE
    START FOR FREE
    START FOR FREE
    TigerGraph
    PRODUCT
    PRODUCT
    • Overview
    • GraphStudio UI
    • Graph Data Science Library
    TIGERGRAPH DB
    • Overview
    • Features
    • GSQL Query Language
    TIGERGRAPH CLOUD
    • Overview
    • Cloud Starter Kits
    TRY TIGERGRAPH
    • Get Started for Free
    • Compare Editions
    SOLUTIONS
    SOLUTIONS
    • Why Graph?
    use cases
    • Benefits
    • Product & Service Marketing
    • Entity Resolution
    • Customer Journey/360
    • Recommendation Engine
    • Anti-Money Laundering (AML)
    • Cybersecurity Threat Detection
    • Fraud Detection
    • Risk Assessment & Monitoring
    • Energy Management
    • Network Resources Optimization
    • Supply Chain Analysis
    • AI & Machine Learning
    • Geospatial Analysis
    • Time Series Analysis
    industry
    • Advertising, Media & Entertainment
    • Financial Services
    • Healthcare & Life Sciences
    CUSTOMERS
    read all success stories


    PARTNERS
    Partner program
    • Partner Benefits
    • TigerGraph Partners
    • Sign Up
    RESOURCES
    LIBRARY
    • Resource Library
    • Benchmark
    • Webinars
    Events
    • Trade Shows
    • Graph + AI Summit
    • Graph for All - Million Dollar Challenge
    EDUCATION
    • TigerGraph Academy
    • Certification
    Blog
    • TigerGraph Blog
    DEVELOPERS
    • Developers Hub
    • Community Forum
    • Documentation
    • Ecosystem
    COMPANY
    COMPANY
    • Overview
    • Leadership
    • Careers  
    NEWS
    PRESS RELEASE
    AWARDS
    START FREE
    Start Free
    • Request a Demo
    • SUPPORT
    • COMMUNITY
    • CONTACT
    Dr. Jay Yu

    Dr. Jay Yu | VP of Product and Innovation

    Dr. Jay Yu is the VP of Product and Innovation at TigerGraph, responsible for driving product strategy and roadmap, as well as fostering innovation in graph database engine and graph solutions. He is a proven hands-on full-stack innovator, strategic thinker, leader, and evangelist for new technology and product, with 25+ years of industry experience ranging from highly scalable distributed database engine company (Teradata), B2B e-commerce services startup, to consumer-facing financial applications company (Intuit). He received his PhD from the University of Wisconsin - Madison, where he specialized in large scale parallel database systems

    Todd Blaschka | COO

    Todd Blaschka is a veteran in the enterprise software industry. He is passionate about creating entirely new segments in data, analytics and AI, with the distinction of establishing graph analytics as a Gartner Top 10 Data & Analytics trend two years in a row. By fervently focusing on critical industry and customer challenges, the companies under Todd's leadership have delivered significant quantifiable results to the largest brands in the world through channel and solution sales approach. Prior to TigerGraph, Todd led go to market and customer experience functions at Clustrix (acquired by MariaDB), Dataguise and IBM.