Skip to content
START FOR FREE
START FOR FREE
  • SUPPORT
  • COMMUNITY
  • CONTACT US
  • SUPPORT
  • COMMUNITY
  • CONTACT US
MENUMENU
  • Products
    • The World’s Fastest and Most Scalable Graph Platform

      LEARN MORE

      Watch a TigerGraph Demo

      TIGERGRAPH CLOUD

      • Overview
      • TigerGraph Cloud Suite
      • FAQ
      • Pricing

      USER TOOLS

      • GraphStudio
      • Insights
      • Application Workbenches
      • Connectors and Drivers
      • Starter Kits
      • openCypher Support

      TIGERGRAPH DB

      • Overview
      • GSQL Query Language
      • Compare Editions

      GRAPH DATA SCIENCE

      • Graph Data Science Library
      • Machine Learning Workbench

      Success Plans

  • Solutions
    • The World’s Fastest and Most Scalable Graph Platform

      LEARN MORE

      Watch a TigerGraph Demo

      Solutions

      • Solutions Overview

      INCREASE REVENUE

      • Customer Journey/360
      • Product Marketing
      • Entity Resolution
      • Recommendation Engine

      MANAGE RISK

      • Fraud Detection
      • Anti-Money Laundering
      • Threat Detection
      • Risk Monitoring

      IMPROVE OPERATIONS

      • Supply Chain Analysis
      • Energy Management
      • Network Optimization

      By Industry

      • Advertising, Media & Entertainment
      • Financial Services
      • Healthcare & Life Sciences

      FOUNDATIONAL

      • AI & Machine Learning
      • Time Series Analysis
      • Geospatial Analysis
  • Customers
    • The World’s Fastest and Most Scalable Graph Platform

      LEARN MORE

      CUSTOMER SUCCESS STORIES

      • Ford
      • Intuit
      • JPMorgan Chase
      • READ MORE SUCCESS STORIES
      • Jaguar Land Rover
      • Xbox
  • Partners
    • The World’s Fastest and Most Scalable Graph Platform

      LEARN MORE

      PARTNER PROGRAM

      • Partner Benefits
      • TigerGraph Partners
      • Sign Up
      TigerGraph partners with organizations that offer complementary technology solutions and services.​
  • Resources
    • The World’s Fastest and Most Scalable Graph Platform

      LEARN MORE

      BLOG

      • TigerGraph Blog

      RESOURCES

      • Resource Library
      • Benchmarks
      • Demos
      • O'Reilly Graph + ML Book

      EVENTS & WEBINARS

      • Events &Trade Shows
      • Webinars

      DEVELOPERS

      • Documentation
      • Ecosystem
      • Developers Hub
      • Community Forum

      SUPPORT

      • Contact Support
      • Production Guidelines

      EDUCATION

      • Training & Certifications
  • Company
    • Join the World’s Fastest and Most Scalable Graph Platform

      WE ARE HIRING

      COMPANY

      • Company Overview
      • Leadership
      • Legal Terms
      • Patents
      • Security and Compliance

      CAREERS

      • Join Us
      • Open Positions

      AWARDS

      • Awards and Recognition
      • Leader in Forrester Wave
      • Gartner Research

      PRESS RELEASE

      • Read All Press Releases
      TigerGraph Debuts TigerGraph CoPilot for Graph-Augmented AI, New Cloud-Native Generation of TigerGraph Cloud, and Solution Kits
      April 30, 2024
      Read More »

      NEWS

      • Read All News

      Best paper award at International Conference on Very Large Data Bases

      New TigerGraph CEO Refocuses Efforts on Enterprise Customers

  • START FREE
    • The World’s Fastest and Most Scalable Graph Platform

      GET STARTED

      • Request a Demo
      • CONTACT US
      • Try TigerGraph
      • START FREE
      • TRY AN ONLINE DEMO

Utilizing Multi-edge for Temporal Search in a Sales Agent Hierarchy

  • Xuanlei Lin
  • September 14, 2023
  • blog, Engineers
  • Blog >
  • Utilizing Multi-edge for Temporal Search in a Sales Agent Hierarchy
Utilizing multi-edge for temporal search in a sales agent hierarchy

Introduction

Hello everyone! I’m Xuanlei Lin. I have worked as a solution engineer at TigerGraph for two years and as a customer success consultant for another two years. Throughout this period, I have been involved in over 60 projects utilizing TigerGraph. In this blog, I would like to introduce you to a powerful feature of TigerGraph called multi-edge. Multi-edge refers to a concept in graph theory where multiple edges, or connections, exist between two nodes in a graph. In a traditional graph, each pair of nodes can have at most one edge connecting them. However, in a multi-edge graph, two nodes can be connected by multiple edges, indicating different types of relationships or interactions between them. Multi-edge graphs are often used to model complex systems where multiple interactions or relationships exist between entities.

Recently, I had the opportunity to leverage the multi-edge functionality to assist an insurance customer in implementing temporal search for agent hierarchy. While this project was specific to the insurance industry, multi-edge is a solution for temporal search for many other industries and use cases.


In this blog post, I will present a simplified version of the demo based on the project I recently completed. Firstly, I will outline the business requirements and the technical challenges associated with their implementation. Next, I will introduce a solution that leverages TigerGraph’s multi-edge functionality. Additionally, I will explore further use cases of multi-edge in the insurance industry and other sectors.

Requirements

Before we begin, let me provide some background information on the business domain. In the insurance industry, particularly in life insurance companies, agents, also referred to as salespersons, play a crucial role as the primary sales channel for insurance policies. A large insurance company may have many thousands of agents organized into multi-level groups. The hierarchical structure consists of groups at the lowest level, departments in the middle, and regions at the highest level. Each group/department/region is overseen by a manager, and every agent belongs to one specific group/department/region.

Apart from the hierarchical relationships, there are two additional types of relationships between agents. The first is the introduction relationship, where any agent can recommend new agents to the company. The second is the fostering relationship, which occurs when an agent is promoted to a higher managerial position within a group/department/region. In this case, the agent’s former direct leader establishes a fostering relationship with the agent. The fostering relationship can be further categorized into three types based on the level of the new rank attained by the fostered agent: group, department, and region.

Let’s consider the leftmost group in Figure 1 as an example. Agents D, F, H, and K form a group, with D serving as the group manager. D is the manager of F, H, and K. D introduced F and H, and H introduced K. Agent B has a group fostering relationship with D.
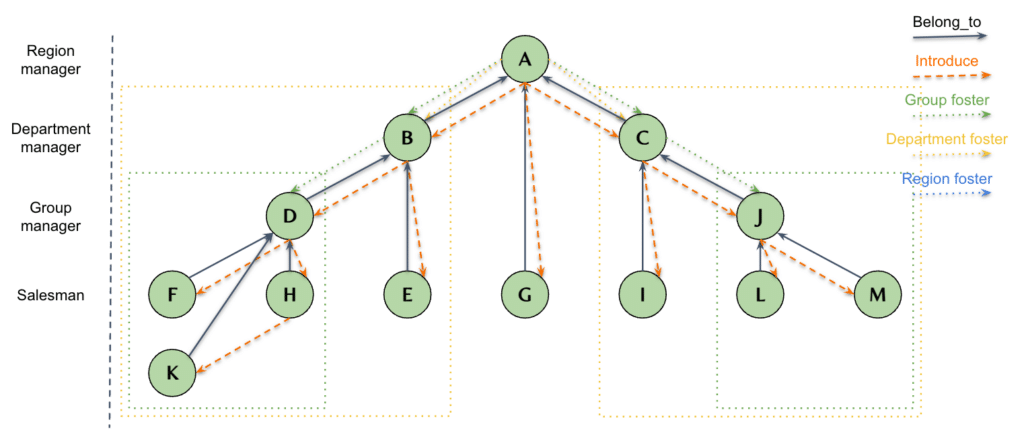
example of insurance agent relationships

Figure 1

The hierarchy, introduction, and fostering relationships play a vital role in the performance appraisal of agents. The commission structure for agents consists of both direct and indirect commissions. The direct commission refers to the commission earned from the insurance policies sold by the agent personally. On the other hand, the indirect commission refers to the commission earned from the policies sold by other agents.

To illustrate, let’s consider an example: Agent A sells an insurance policy and receives a direct commission for the sale. However, not only does Agent A receive a commission, but A’s manager, introducer, and the agent who fostered Also receive a portion of the commission. This means that when Agent A sells a policy, their manager, the agent who introduced them, and the agent who fostered A all receive a share of the commission.

Challenges

As mentioned earlier, there are various relationships between agents, and the complexity arises from the fact that these relationships are subject to change over time. The company promotes or demotes agents on a monthly basis, based on their performance. Additionally, new agents join the organization while old agents may leave. Essentially, this creates a temporal graph where relationships evolve over time.

Traditional technologies like relational databases or big data solutions often struggle to effectively manage and maintain these dynamic relationships. Prior to joining TigerGraph, I was involved in a similar project where extensive SQL and Java code were required to implement the functionality. Unfortunately, the resulting codebase became incredibly complex, making it difficult for anyone to fully comprehend and maintain.

Solution

The challenges posed by this project may indeed be daunting for traditional technologies, but they are well within the capabilities of TigerGraph. Firstly, the scale of millions of agents is not a significant concern for TigerGraph, as it can support billions or even trillions of vertices. Secondly, TigerGraph excels in handling complex relationships and can effectively represent intricate connections.

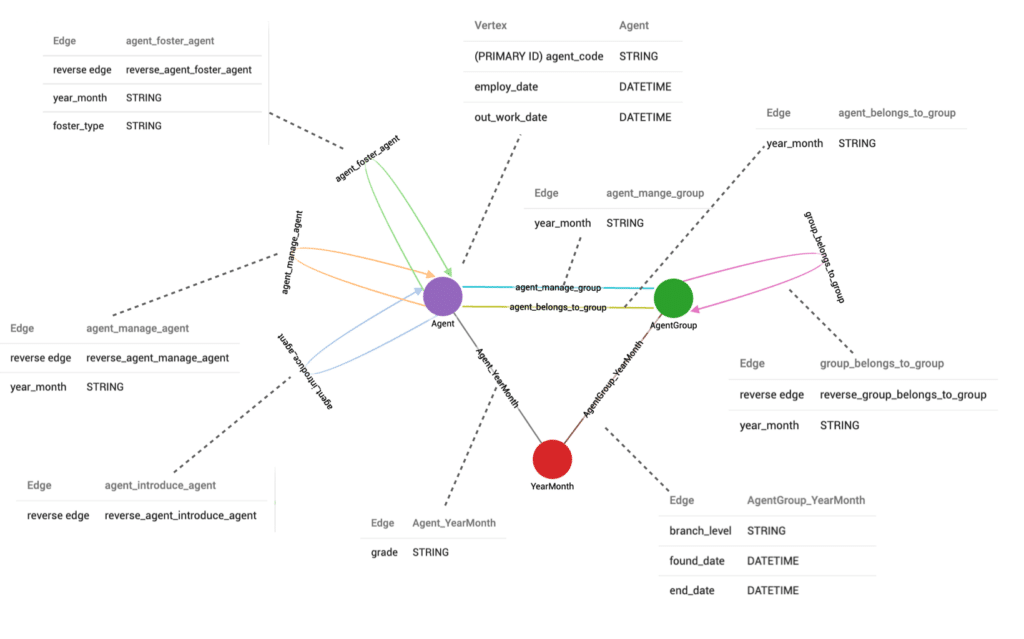
The only difficulty lies in managing temporal relationships. Customers require the ability to view the latest agent hierarchy while also being able to trace the agent hierarchy back to a specific point in time. In earlier versions of TigerGraph, multi-edge support was lacking. As a workaround, an additional vertex type was introduced to record historical data between vertices. However, this workaround is no longer necessary due to the introduction of multi-edge, a more elegant and high-performance solution. Multi-edge allows for the existence of multiple edges of the same type between a pair of vertices. To differentiate between different edges between a pair of vertices, a Discriminator has been added, which can be understood as a primary key on the edge. For example, the following code is used to create edges representing the management relationship.

Defining a multiedge with temporal discrimantor

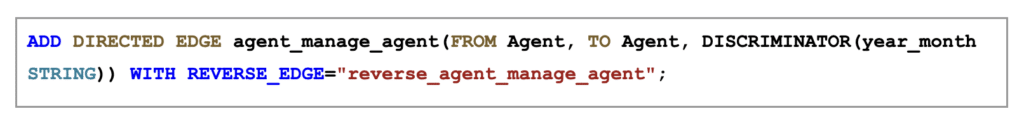
The schema design consists of a single vertex type, “Agent,” and an edge type, “agent_manage_agent,” which incorporates the “year_month” Discriminator to differentiate the management relationships for each month.

Below is the complete schema design:

multiedge schema for insurance agents


After designing the schema and loading the data, we can create a query to perform the temporal search. This query will enable us to search for the hierarchy of agents at a specific moment in history. For example, if we input the date “2008-01-01,” the resulting agent hierarchy at that particular time would be as follows:
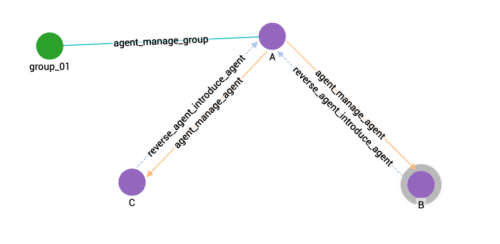
multiedge temporary query 1 result


Figure 2

Next, if we input the date “2014-01-01,” we will obtain the following results:
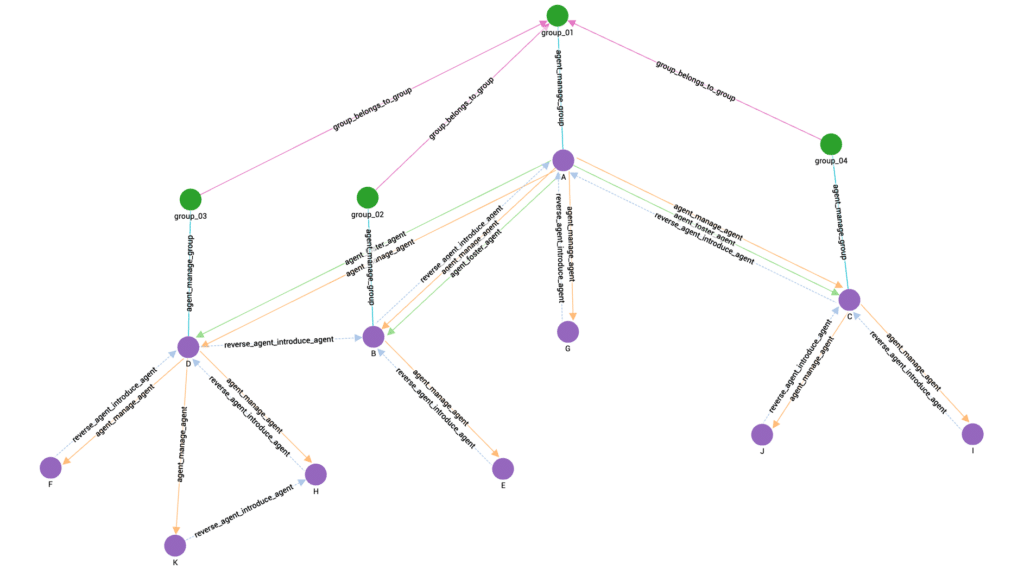
multi-edge temporal query 2 result

Figure 3

Lastly, if we input the date “2019-01-01,” we will obtain the following results:
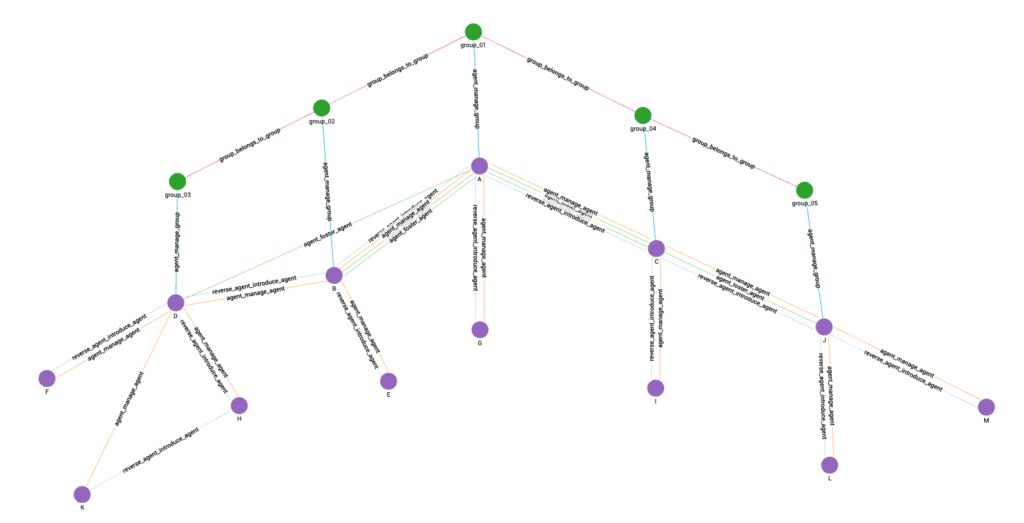
multi-edge temporal query 3 result

Figure 4

It should be noted that the agent hierarchy depicted in Figure 4 is the same as the one shown in Figure 1.

Further applications

As mentioned earlier, the above demo is just a simplified version. In actual projects, after establishing the temporal graph for the agent hierarchy, we can also associate more entities such as policies, applicants, insured individuals, claims, and commissions.

Once a more complete schema is established, we can have more diverse applications. For example:

  • Based on the latest agent hierarchy, precalculate the performance of all agents for the upcoming months, end of quarters, and year-end, and make adjustments to the agent hierarchy based on performance precalculation.

  • Look back at the historical agent hierarchy, and perform data analysis based on the agent hierarchy at that time.

  • Combine with machine learning, extract features, and conduct retrospective testing.

The application of multi-edge in other industries

Multi-edge is a versatile technology that can be applied in various industries. In the telecommunications industry, there can be multiple connections between phones. In the banking industry, there can be multiple transactions between accounts. In the manufacturing industry, each component can have multiple parameters, and each parameter may have been measured at different times. All of these can be addressed using multi-edge.

Many more examples can be given, and you can apply the concept of multi-edge based on the characteristics of your industry’s data. I believe that using multi-edge can help you store data more effectively, write queries more conveniently, and retrieve information faster.

If you’re interested in exploring how TigerGraph can open up new dimensions with your data, you can sign up for a free instance of TigerGraph Cloud at tgcloud.io or contact us at info@localhost.

You Might Also Like

Graph Developer Proficiency Rating

Graph Developer Proficiency Rating

June 16, 2024
Supply Chain Digital Twins Enable Analytics and Resiliency

Supply Chain Digital Twins Enable Analytics...

May 29, 2024
Putting the Customer First: The Power of the Empty Chair

Putting the Customer First: The Power...

May 17, 2024

Xuanlei Lin

TigerGraph Blog

  • Categories
    • blogs
      • Customer 360
      • Cybersecurity
      • Developers
      • Digital Twin
      • Engineers
      • Fraud / Anti-Money Laundering
      • GQL
      • GSQL
      • Supply Chain
      • TigerGraph
      • TigerGraph Cloud
    • Graph AI On Demand
      • Customer Spotlight
      • Digital Transformation, Management, & Strategy
      • Finance, Banking, Insurance
      • Graph + AI
      • Graph Algorithms
      • Retail, Manufacturing, and Supply Chain
    • RulesEngine
    • Video
  • Recent Posts

    • Graph Developer Proficiency Rating
    • Supply Chain Digital Twins Enable Analytics and Resiliency
    • Welcome to ENGAGE 2024!
    • Putting the Customer First: The Power of the Empty Chair
    • Join TigerGraph at ENGAGE 2024: Advancing Financial Crime Solutions
    TigerGraph

    Product

    SOLUTIONS

    customers

    RESOURCES

    start for free

    TIGERGRAPH DB
    • Overview
    • Features
    • GSQL Query Language
    GRAPH DATA SCIENCE
    • Graph Data Science Library
    • Machine Learning Workbench
    TIGERGRAPH CLOUD
    • Overview
    • Cloud Starter Kits
    • Login
    • FAQ
    • Pricing
    • Cloud Marketplaces
    USEr TOOLS
    • GraphStudio
    • TigerGraph Insights
    • Application Workbenches
    • Connectors and Drivers
    • Starter Kits
    • openCypher Support
    SOLUTIONS
    • Why Graph?
    industry
    • Advertising, Media & Entertainment
    • Financial Services
    • Healthcare & Life Sciences
    use cases
    • Benefits
    • Product & Service Marketing
    • Entity Resolution
    • Customer 360/MDM
    • Recommendation Engine
    • Anti-Money Laundering
    • Cybersecurity Threat Detection
    • Fraud Detection
    • Risk Assessment & Monitoring
    • Energy Management
    • Network & IT Management
    • Supply Chain Analysis
    • AI & Machine Learning
    • Geospatial Analysis
    • Time Series Analysis
    success stories
    • Customer Success Stories

    Partners

    Partner program
    • Partner Benefits
    • TigerGraph Partners
    • Sign Up
    LIBRARY
    • Resources
    • Benchmark
    • Webinars
    Events
    • Trade Shows
    • Graph + AI Summit
    • Million Dollar Challenge
    EDUCATION
    • Training & Certifications
    Blog
    • TigerGraph Blog
    DEVELOPERS
    • Developers Hub
    • Community Forum
    • Documentation
    • Ecosystem

    COMPANY

    Company
    • Overview
    • Careers
    • News
    • Press Release
    • Awards
    • Legal Terms
    • Patents
    • Security and Compliance
    • Contact
    Get Started
    • Start Free
    • Compare Editions
    • Online Demo - Test Drive
    • Request a Demo

    Product

    • Overview
    • TigerGraph 3.0
    • TIGERGRAPH DB
    • TIGERGRAPH CLOUD
    • GRAPHSTUDIO
    • TRY NOW

    customers

    • success stories

    RESOURCES

    • LIBRARY
    • Events
    • EDUCATION
    • BLOG
    • DEVELOPERS

    SOLUTIONS

    • SOLUTIONS
    • use cases
    • industry

    Partners

    • partner program

    company

    • Overview
    • news
    • Press Release
    • Awards

    start for free

    • Request Demo
    • take a test drive
    • SUPPORT
    • COMMUNITY
    • CONTACT
    • Copyright © 2024 TigerGraph
    • Privacy Policy
    • Linkedin
    • Twitter

    Copyright © 2020 TigerGraph | Privacy Policy

    Copyright © 2020 TigerGraph Privacy Policy

    • SUPPORT
    • COMMUNITY
    • COMPANY
    • CONTACT
    • Linkedin
    • Facebook
    • Twitter

    Copyright © 2020 TigerGraph

    Privacy Policy

    • Products
    • Solutions
    • Customers
    • Partners
    • Resources
    • Company
    • START FREE
    START FOR FREE
    START FOR FREE
    TigerGraph
    PRODUCT
    PRODUCT
    • Overview
    • GraphStudio UI
    • Graph Data Science Library
    TIGERGRAPH DB
    • Overview
    • Features
    • GSQL Query Language
    TIGERGRAPH CLOUD
    • Overview
    • Cloud Starter Kits
    TRY TIGERGRAPH
    • Get Started for Free
    • Compare Editions
    SOLUTIONS
    SOLUTIONS
    • Why Graph?
    use cases
    • Benefits
    • Product & Service Marketing
    • Entity Resolution
    • Customer Journey/360
    • Recommendation Engine
    • Anti-Money Laundering (AML)
    • Cybersecurity Threat Detection
    • Fraud Detection
    • Risk Assessment & Monitoring
    • Energy Management
    • Network Resources Optimization
    • Supply Chain Analysis
    • AI & Machine Learning
    • Geospatial Analysis
    • Time Series Analysis
    industry
    • Advertising, Media & Entertainment
    • Financial Services
    • Healthcare & Life Sciences
    CUSTOMERS
    read all success stories


    PARTNERS
    Partner program
    • Partner Benefits
    • TigerGraph Partners
    • Sign Up
    RESOURCES
    LIBRARY
    • Resource Library
    • Benchmark
    • Webinars
    Events
    • Trade Shows
    • Graph + AI Summit
    • Graph for All - Million Dollar Challenge
    EDUCATION
    • TigerGraph Academy
    • Certification
    Blog
    • TigerGraph Blog
    DEVELOPERS
    • Developers Hub
    • Community Forum
    • Documentation
    • Ecosystem
    COMPANY
    COMPANY
    • Overview
    • Leadership
    • Careers  
    NEWS
    PRESS RELEASE
    AWARDS
    START FREE
    Start Free
    • Request a Demo
    • SUPPORT
    • COMMUNITY
    • CONTACT
    Dr. Jay Yu

    Dr. Jay Yu | VP of Product and Innovation

    Dr. Jay Yu is the VP of Product and Innovation at TigerGraph, responsible for driving product strategy and roadmap, as well as fostering innovation in graph database engine and graph solutions. He is a proven hands-on full-stack innovator, strategic thinker, leader, and evangelist for new technology and product, with 25+ years of industry experience ranging from highly scalable distributed database engine company (Teradata), B2B e-commerce services startup, to consumer-facing financial applications company (Intuit). He received his PhD from the University of Wisconsin - Madison, where he specialized in large scale parallel database systems

    Todd Blaschka | COO

    Todd Blaschka is a veteran in the enterprise software industry. He is passionate about creating entirely new segments in data, analytics and AI, with the distinction of establishing graph analytics as a Gartner Top 10 Data & Analytics trend two years in a row. By fervently focusing on critical industry and customer challenges, the companies under Todd's leadership have delivered significant quantifiable results to the largest brands in the world through channel and solution sales approach. Prior to TigerGraph, Todd led go to market and customer experience functions at Clustrix (acquired by MariaDB), Dataguise and IBM.