Skip to content
START FOR FREE
START FOR FREE
  • SUPPORT
  • COMMUNITY
  • CONTACT US
  • SUPPORT
  • COMMUNITY
  • CONTACT US
MENUMENU
  • Products
    • The World’s Fastest and Most Scalable Graph Platform

      LEARN MORE

      Watch a TigerGraph Demo

      TIGERGRAPH CLOUD

      • Overview
      • TigerGraph Cloud Suite
      • FAQ
      • Pricing

      USER TOOLS

      • GraphStudio
      • Insights
      • Application Workbenches
      • Connectors and Drivers
      • Starter Kits
      • openCypher Support

      TIGERGRAPH DB

      • Overview
      • GSQL Query Language
      • Compare Editions

      GRAPH DATA SCIENCE

      • Graph Data Science Library
      • Machine Learning Workbench

      Success Plans

  • Solutions
    • The World’s Fastest and Most Scalable Graph Platform

      LEARN MORE

      Watch a TigerGraph Demo

      Solutions

      • Solutions Overview

      INCREASE REVENUE

      • Customer Journey/360
      • Product Marketing
      • Entity Resolution
      • Recommendation Engine

      MANAGE RISK

      • Fraud Detection
      • Anti-Money Laundering
      • Threat Detection
      • Risk Monitoring

      IMPROVE OPERATIONS

      • Supply Chain Analysis
      • Energy Management
      • Network Optimization

      By Industry

      • Advertising, Media & Entertainment
      • Financial Services
      • Healthcare & Life Sciences

      FOUNDATIONAL

      • AI & Machine Learning
      • Time Series Analysis
      • Geospatial Analysis
  • Customers
    • The World’s Fastest and Most Scalable Graph Platform

      LEARN MORE

      CUSTOMER SUCCESS STORIES

      • Ford
      • Intuit
      • JPMorgan Chase
      • READ MORE SUCCESS STORIES
      • Jaguar Land Rover
      • Xbox
  • Partners
    • The World’s Fastest and Most Scalable Graph Platform

      LEARN MORE

      PARTNER PROGRAM

      • Partner Benefits
      • TigerGraph Partners
      • Sign Up
      TigerGraph partners with organizations that offer complementary technology solutions and services.​
  • Resources
    • The World’s Fastest and Most Scalable Graph Platform

      LEARN MORE

      BLOG

      • TigerGraph Blog

      RESOURCES

      • Resource Library
      • Benchmarks
      • Demos
      • O'Reilly Graph + ML Book

      EVENTS & WEBINARS

      • Events &Trade Shows
      • Webinars

      DEVELOPERS

      • Documentation
      • Ecosystem
      • Developers Hub
      • Community Forum

      SUPPORT

      • Contact Support
      • Production Guidelines

      EDUCATION

      • Training & Certifications
  • Company
    • Join the World’s Fastest and Most Scalable Graph Platform

      WE ARE HIRING

      COMPANY

      • Company Overview
      • Leadership
      • Legal Terms
      • Patents
      • Security and Compliance

      CAREERS

      • Join Us
      • Open Positions

      AWARDS

      • Awards and Recognition
      • Leader in Forrester Wave
      • Gartner Research

      PRESS RELEASE

      • Read All Press Releases
      TigerGraph Debuts TigerGraph CoPilot for Graph-Augmented AI, New Cloud-Native Generation of TigerGraph Cloud, and Solution Kits
      April 30, 2024
      Read More »

      NEWS

      • Read All News

      Best paper award at International Conference on Very Large Data Bases

      New TigerGraph CEO Refocuses Efforts on Enterprise Customers

  • START FREE
    • The World’s Fastest and Most Scalable Graph Platform

      GET STARTED

      • Request a Demo
      • CONTACT US
      • Try TigerGraph
      • START FREE
      • TRY AN ONLINE DEMO

Using Graph Machine Learning to Improve Fraud Detection Rates

  • Parker Erickson
  • August 30, 2023
  • blog, Fraud / Anti-Money Laundering
  • Blog >
  • Using Graph Machine Learning to Improve Fraud Detection Rates

by Parker Erickson

Fraud comes in all shapes and forms across many industries; from account takeovers, to transaction fraud, the financial services industry to healthcare, fraud is both prevalent and costly for many companies. As the world becomes further interconnected and increasingly digital, businesses must adapt to better fight fraudulent activities. In this blog, we will apply graph machine learning techniques to improve fraud detection by up to 20% in the Ethereum blockchain. Follow along with this Jupyter notebook.

Structure of Fraud

Fraudulent activities come in many forms, but a core idea behind fraud detection is to find individuals who behave similar to suspected fraudsters. This might mean using the same address or device id or conducting a similar series of transactions. Given these similarities, and known fraudulent behavior, one can find many fraudsters based on the knowledge of how one operated. The same logic applies to using machine learning for fraud detection. Data scientists need to extract features to feed to their ML pipelines that capture the similarity of various entities that they are trying to classify. In the case of this blog, we are going to be utilizing the structure of Ethereum blockchain transactions to detect account takeover fraud.

Why Graph Machine Learning?

As data scientists try to generate richer features that capture the similarity between different entities, they often look towards graph data structures. Graphs provide a very natural way to represent relationships between entities, such as “Person 1 used Device 36” or “Person 2 transacted with Person 723.” Making a profile of relationships and comparing profiles is the basis for many similarity determinations. If two persons use the same IP address, they will be connected in the graph: Person 1 → IP333 ← Person 2. Additionally, two accounts that transacted with one another would be connected as well. By analyzing these connections and relationships, data scientists can use graph algorithms to extract new features that they wouldn’t have been able to in a traditional tabular setting due to the compute cost of implementing the algorithms through complex JOIN operations. As TigerGraph is a very scalable and performant graph database, leading financial institutions use TigerGraph to compute these novel graph features.

graph-enhanced ML, 2 ways


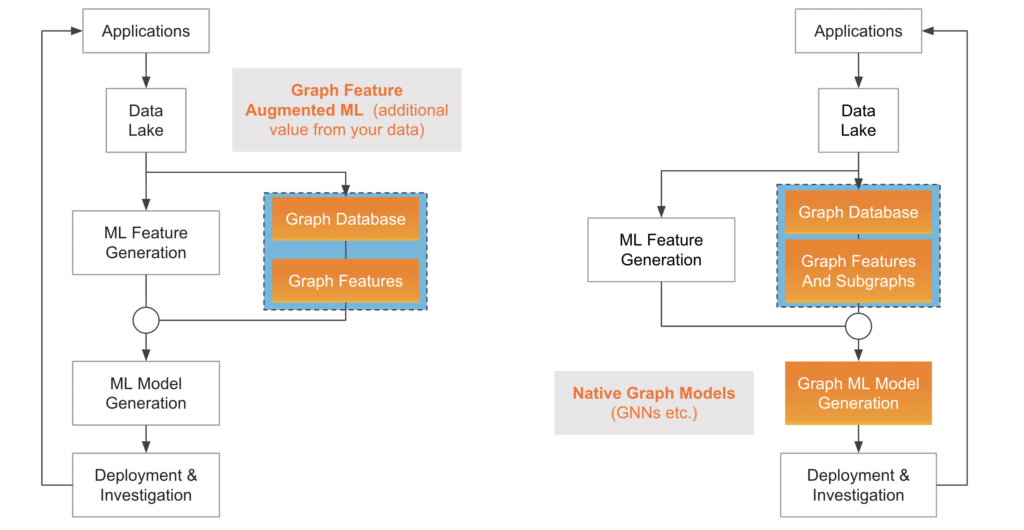
Two methods of Graph Machine Learning. Pictured on the left is incorporating graph features with traditional ML models, while the right represents utilizing native graph ML models such as GNNs.

Graph Machine Learning Applied to Ethereum Fraud Detection

While graph features are a good starting point to detecting more fraud, “native” graph models, such as Graph Neural Networks, incorporate the relationship between data points in a more direct and holistic manner, thereby reducing the need for complex feature engineering pipelines. This gives rise to two different approaches to take when incorporating graph machine learning techniques into data pipelines: one in which graph features are extracted and then passed to traditional, tabular ML models such as XGBoost, or one that uses graph neural networks to make their predictions.

Ethereum Transaction Dataset

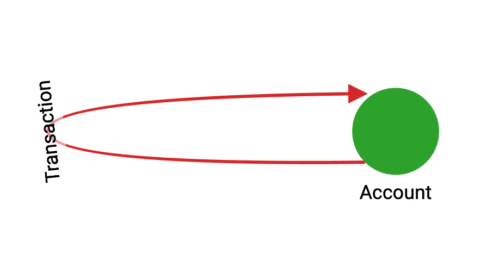
The dataset used in the demo comprises transactions on the Ethereum platform, forming a transaction graph for Ether, the second-largest cryptocurrency. Wallets (i.e., accounts) on the platform serve as vertices in the graph, while edges represent transactions between these accounts. With 32,168 vertices and 84,088 edges, the dataset is derived from the publicly available Ethereum dataset from XBlock. We will be predicting if an account is fraudulent or benign.

ethereum transaction schema

TigerGraph Schema for the Ethereum Dataset

As a baseline test, the notebook trains a model using features that a data scientist might normally calculate in a traditional tabular manner. This includes the amount an account has received, the amount that it has sent, the number of transactions that it has received and sent, and the minimum of the transactions that have been sent and received. Using these features, an XGBoost model achieves a 77% accuracy on the fraud detection task. We will now add more graph-derived features to the model to see how incorporating information from the graph structure of the dataset will improve the accuracy of the fraud detection.

Graph Features And Traditional Machine Learning

The next model in the notebook trains an XGBoost model that incorporates three different graph features: PageRank, Betweenness Centrality, and Weakly Connected Component size. These features are some of the more common algorithms to execute in fraud detection use cases. TigerGraph offers a library of over 50 built-in graph algorithms, organized into seven categories. The notebook’s three features fall into two of those categories described below.

  • Centrality: Centrality algorithms, such as PageRank and Betweenness, can measure the influence or closeness of a vertex to others within the graph. Many fraud patterns exhibit higher than average centralities, so these can be useful features for training an ML model.

centrality algorithms

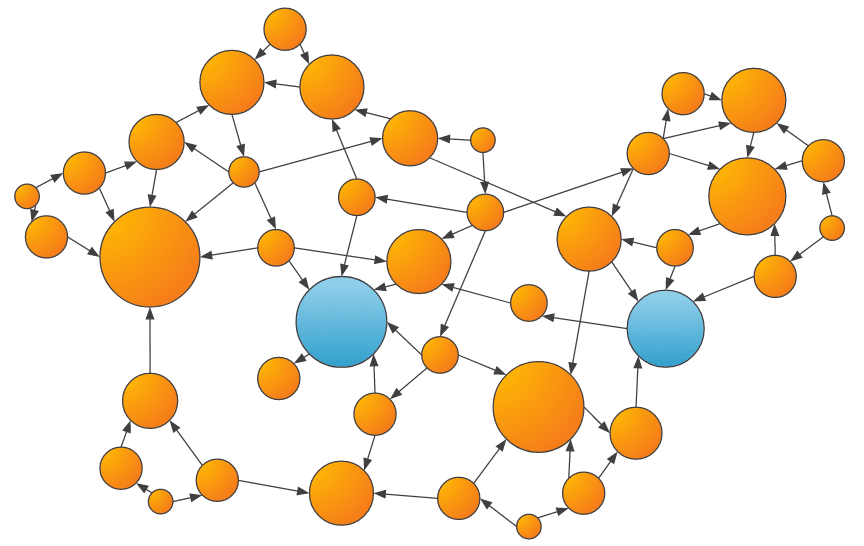
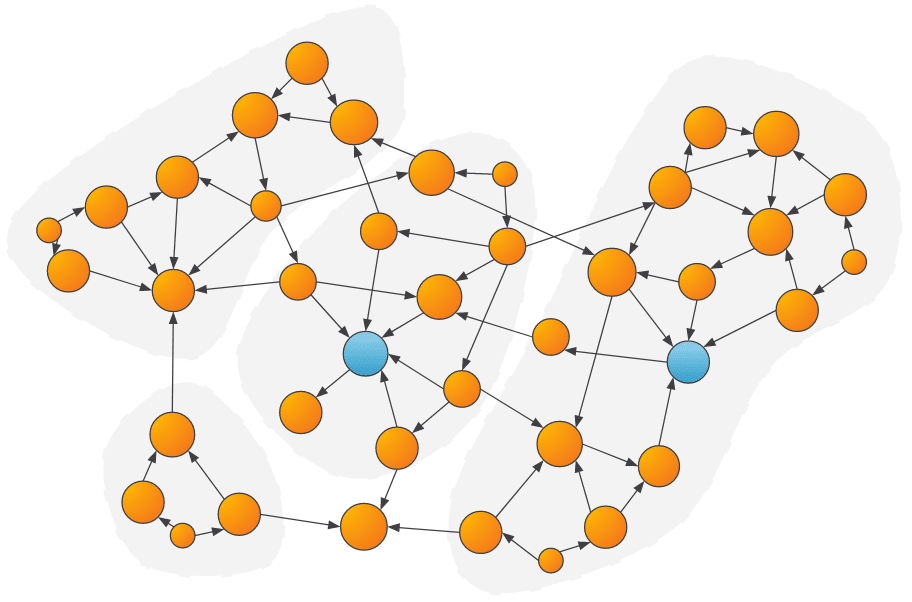
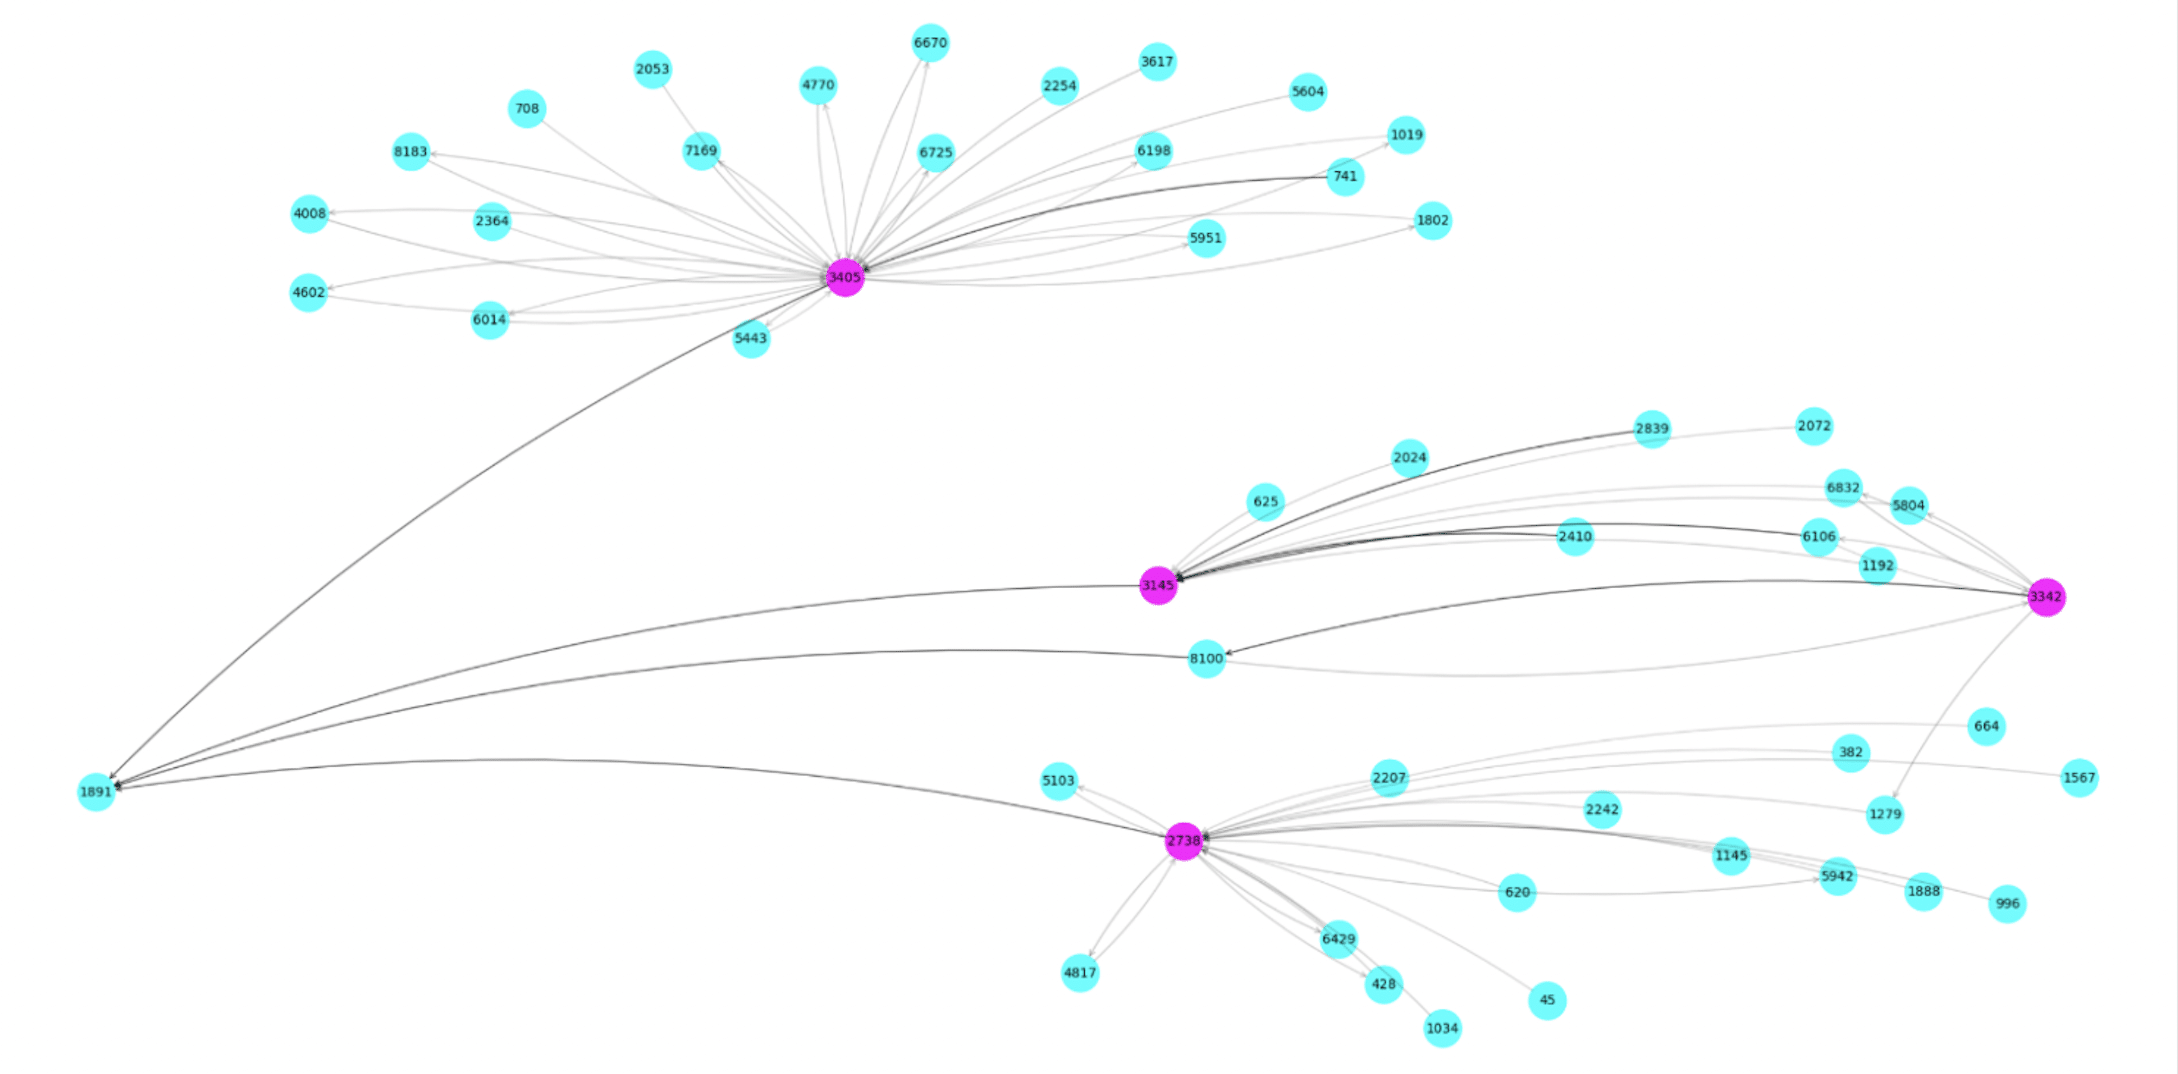
An example of the output of a centrality algorithm, where larger scores are denoted by larger vertices. Entities that are more central have more transaction inflow and outflow, which may be fraudulent behavior.

  • Community Detection: Community algorithms, such as Weakly Connected Components (WCC) or Louvain, can be used to determine groups of vertices that share common characteristics or heavily interact with each other. Once the communities are determined, features such as the community size, the number/amount of transactions within the community, and more can be calculated and passed to the ML model.

community detection algorithms

Example of communities detected within a graph. Parties that are within the same community as a suspicious party might be more likely to be suspicious as well.

Another important graph algorithm category is Shortest Path. While not used in this demo, shortest path algorithms can answer questions like “how close is the entity in interest to a known fraudulent entity?”, which may provide a useful signal to the downstream machine learning model.

shortest path algorithms

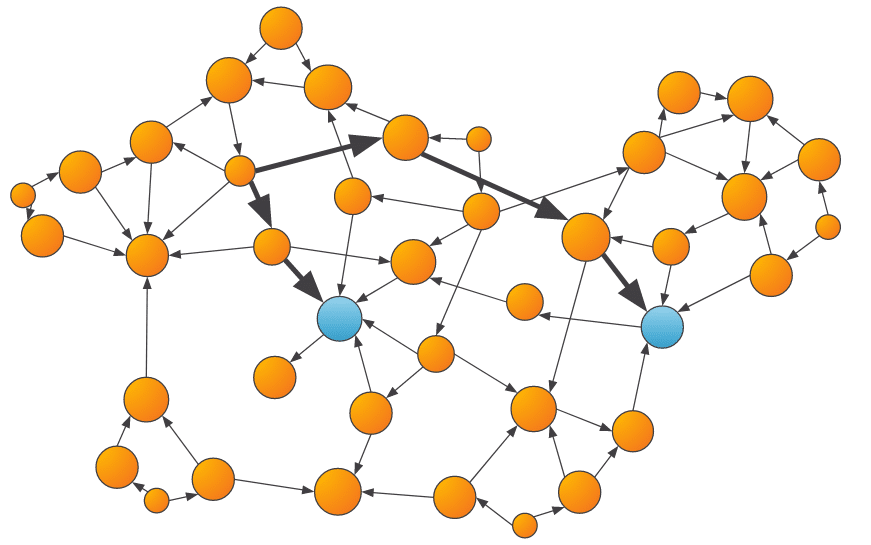
An example of shortest path algorithms determining how close an entity is to a known fraudulent entity.

The different features calculated in the Ethereum dataset resulted in an increase of the XGBoost model accuracy. When used with the traditional features we calculated beforehand, the model achieved a 91% accuracy, a 14% accuracy improvement! In addition, we can view the importance of the features in the model’s decision, and see that PageRank and the size of the Weakly Connected Component are quite important in the model’s classification.

graph and other feature importance, for ethereum demo

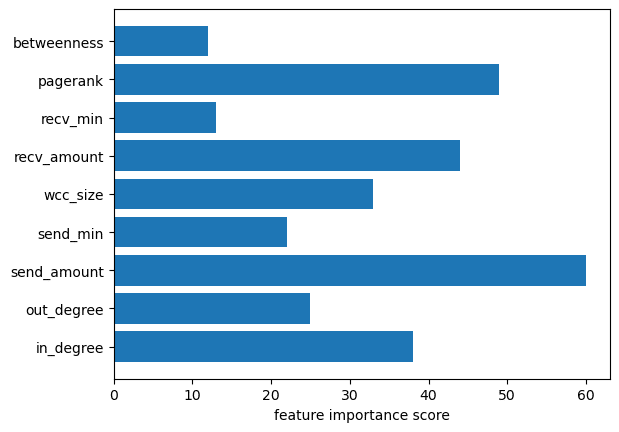
Global feature importance scores from the XGBoost Model trained on graph-derived features.

Graph Embeddings

Graph embeddings are a way to capture a lot of information about the graph in an unsupervised manner, without the need for time-consuming feature engineering that some of the other approaches require. TigerGraph offers graph embedding algorithms in its graph data science library and in its pyTigerGraph Python library. The specific approach that we use here is called FastRP, or Fast Random Projection. The idea behind this algorithm is to perform operations on the graph’s adjacency matrix such that vertices that are highly connected in the graph are close to each other in the embedding space produced.

neighbors in graph embedding

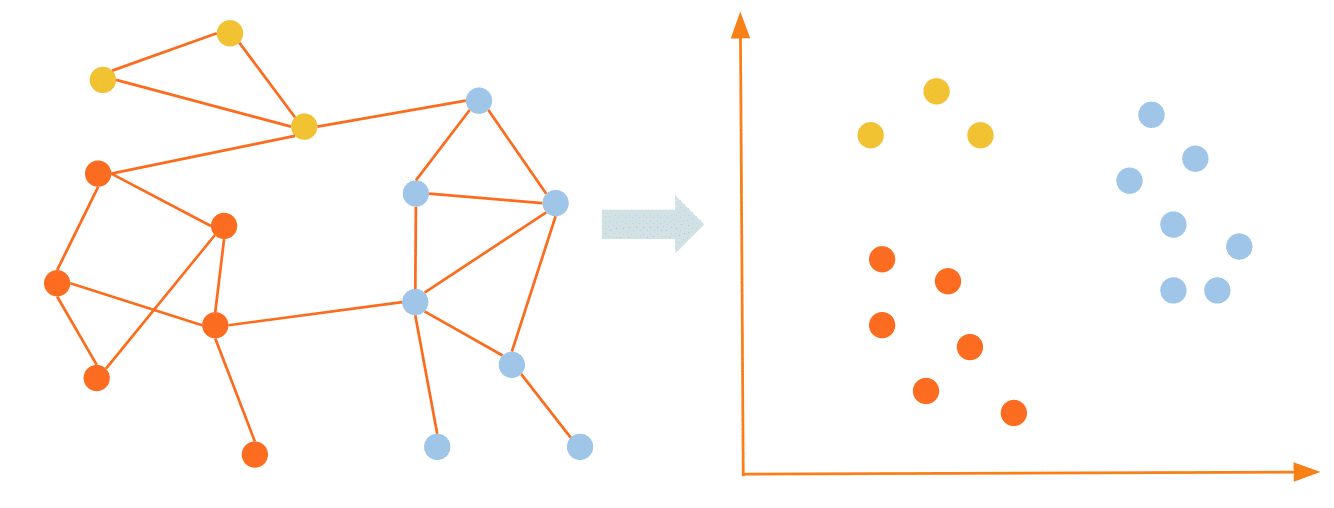
Graph embeddings map vertices that are close together (well connected) in the graph to areas within the embedding space such that they remain close to each other.

Graph embeddings are the best way to incorporate the most amount of graph information into traditional ML algorithms such as XGBoost. However, they do come at a considerable memory and computational cost, so they are not always used. In the Ethereum notebook, we saw they contributed an additional 3% accuracy increase over the model incorporating graph features, for a 17% increase in accuracy over the baseline model. Additionally, as the figure below shows, the holistic nature of an embedding means that it contributes far more to the model than any other single feature.

embedding and other feature important, for ethereum demo

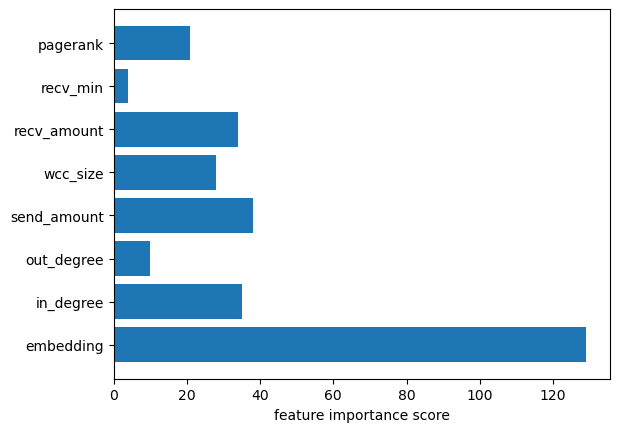
Global feature importance scores from the XGBoost Model trained on graph-derived features and FastRP embedding.

Graph Neural Networks

Graph Neural Networks (GNNs) are a flavor of neural network architecture that operates on graph data structures. These algorithms take into account both the numerical attributes of vertices in the graph, but also the edges between the vertices explicitly. This method can result in an additional accuracy lift over just incorporating graph features into traditional machine learning models. Additionally, they can provide an extra layer of explainability to investigators, as the model not only provides feature importance, but also the importance of the edges between different vertices in the graph.

gnn neighbor aggregation


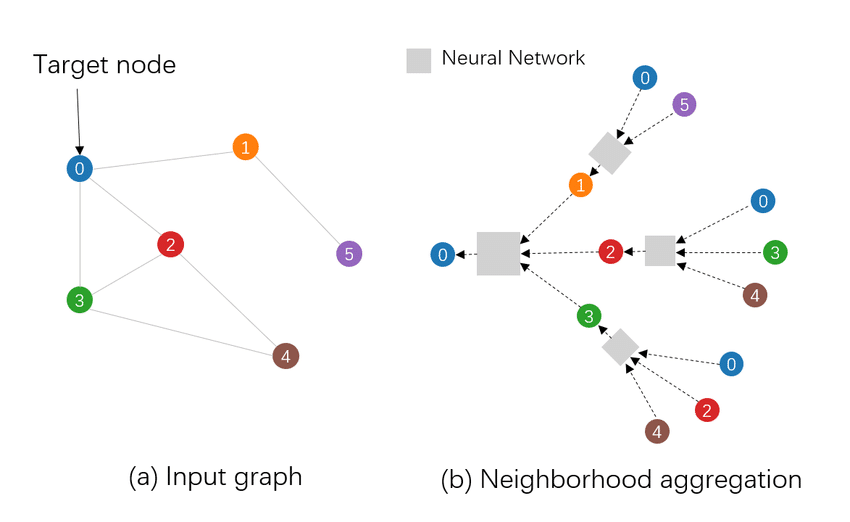
Example of how a Graph Neural Network makes its predictions. 

Image Source: https://www.researchgate.net/figure/Given-an-input-graph-a-GNN-predicts-the-label-of-the-target-node-eg-the-blue-node_fig2_346143176/a>

By using the built-in GraphSAGE model in pyTigerGraph, we trained a GNN on the Ethereum dataset. This resulted in an accuracy of 97%, a 20% improvement in accuracy over the baseline model! Additionally, we can view the local feature importance and the subgraph used to analyze why the model made the prediction it did for the exact account we are interested in.


Conclusion

While the example of the Ethereum dataset used throughout the blog focused on one type of fraud and a relatively simple dataset, the ideas presented carry throughout various different industries and types of fraud. By incorporating information about the structure and relationships between data points, graph machine learning techniques provide a substantial accuracy improvement over traditional machine learning techniques. TigerGraph can compute graph-derived features scalably and performantly, leading to more actionable insights and improved outcomes for businesses.

Compilation of results from the Ethereum demo. As more graph structure is incorporated into the ML model, accuracy improves.

A note on TigerGraph

TigerGraph is the leading platform for analytics and machine learning on connected data.

TigerGraph Inc. was established in 2012 and is based in Redwood City, California. TigerGraph is successfully deployed and is adding value to Forbes 2000 customers all over the world. TigerGraph was included in the Gartner Magic Quadrant in 2022, and inducted into the JP Morgan Chase Hall of Innovation in 2021. Forrester Research calculated the average ROI from TigerGraph at over 600% with a payback of less than 6 months.

TigerGraph is the only graph database powerful enough to run graph algorithms at the scale and accuracy required for fraud detection in large enterprises like financial institutions. TigerGraph runs most graph algorithms 10x to 1000x times faster than its nearest competitors, providing more answers, more efficiency, and more time to converge to correct answers. When it comes to scale, there’s no competition. TigerGraph is the only answer for multi-terabyte graphs in a single, non-sharded database.

There are many ways to use TigerGraph – on cloud or on premises. You can sign up for a free instance of TigerGraph Cloud at tgcloud.io or contact us at info@localhost to find out more.

You Might Also Like

Graph Developer Proficiency Rating

Graph Developer Proficiency Rating

June 16, 2024
Supply Chain Digital Twins Enable Analytics and Resiliency

Supply Chain Digital Twins Enable Analytics...

May 29, 2024
Putting the Customer First: The Power of the Empty Chair

Putting the Customer First: The Power...

May 17, 2024

Parker Erickson

TigerGraph Blog

  • Categories
    • blogs
      • Customer 360
      • Cybersecurity
      • Developers
      • Digital Twin
      • Engineers
      • Fraud / Anti-Money Laundering
      • GQL
      • GSQL
      • Supply Chain
      • TigerGraph
      • TigerGraph Cloud
    • Graph AI On Demand
      • Customer Spotlight
      • Digital Transformation, Management, & Strategy
      • Finance, Banking, Insurance
      • Graph + AI
      • Graph Algorithms
      • Retail, Manufacturing, and Supply Chain
    • RulesEngine
    • Video
  • Recent Posts

    • Graph Developer Proficiency Rating
    • Supply Chain Digital Twins Enable Analytics and Resiliency
    • Welcome to ENGAGE 2024!
    • Putting the Customer First: The Power of the Empty Chair
    • Join TigerGraph at ENGAGE 2024: Advancing Financial Crime Solutions
    TigerGraph

    Product

    SOLUTIONS

    customers

    RESOURCES

    start for free

    TIGERGRAPH DB
    • Overview
    • Features
    • GSQL Query Language
    GRAPH DATA SCIENCE
    • Graph Data Science Library
    • Machine Learning Workbench
    TIGERGRAPH CLOUD
    • Overview
    • Cloud Starter Kits
    • Login
    • FAQ
    • Pricing
    • Cloud Marketplaces
    USEr TOOLS
    • GraphStudio
    • TigerGraph Insights
    • Application Workbenches
    • Connectors and Drivers
    • Starter Kits
    • openCypher Support
    SOLUTIONS
    • Why Graph?
    industry
    • Advertising, Media & Entertainment
    • Financial Services
    • Healthcare & Life Sciences
    use cases
    • Benefits
    • Product & Service Marketing
    • Entity Resolution
    • Customer 360/MDM
    • Recommendation Engine
    • Anti-Money Laundering
    • Cybersecurity Threat Detection
    • Fraud Detection
    • Risk Assessment & Monitoring
    • Energy Management
    • Network & IT Management
    • Supply Chain Analysis
    • AI & Machine Learning
    • Geospatial Analysis
    • Time Series Analysis
    success stories
    • Customer Success Stories

    Partners

    Partner program
    • Partner Benefits
    • TigerGraph Partners
    • Sign Up
    LIBRARY
    • Resources
    • Benchmark
    • Webinars
    Events
    • Trade Shows
    • Graph + AI Summit
    • Million Dollar Challenge
    EDUCATION
    • Training & Certifications
    Blog
    • TigerGraph Blog
    DEVELOPERS
    • Developers Hub
    • Community Forum
    • Documentation
    • Ecosystem

    COMPANY

    Company
    • Overview
    • Careers
    • News
    • Press Release
    • Awards
    • Legal Terms
    • Patents
    • Security and Compliance
    • Contact
    Get Started
    • Start Free
    • Compare Editions
    • Online Demo - Test Drive
    • Request a Demo

    Product

    • Overview
    • TigerGraph 3.0
    • TIGERGRAPH DB
    • TIGERGRAPH CLOUD
    • GRAPHSTUDIO
    • TRY NOW

    customers

    • success stories

    RESOURCES

    • LIBRARY
    • Events
    • EDUCATION
    • BLOG
    • DEVELOPERS

    SOLUTIONS

    • SOLUTIONS
    • use cases
    • industry

    Partners

    • partner program

    company

    • Overview
    • news
    • Press Release
    • Awards

    start for free

    • Request Demo
    • take a test drive
    • SUPPORT
    • COMMUNITY
    • CONTACT
    • Copyright © 2024 TigerGraph
    • Privacy Policy
    • Linkedin
    • Twitter

    Copyright © 2020 TigerGraph | Privacy Policy

    Copyright © 2020 TigerGraph Privacy Policy

    • SUPPORT
    • COMMUNITY
    • COMPANY
    • CONTACT
    • Linkedin
    • Facebook
    • Twitter

    Copyright © 2020 TigerGraph

    Privacy Policy

    • Products
    • Solutions
    • Customers
    • Partners
    • Resources
    • Company
    • START FREE
    START FOR FREE
    START FOR FREE
    TigerGraph
    PRODUCT
    PRODUCT
    • Overview
    • GraphStudio UI
    • Graph Data Science Library
    TIGERGRAPH DB
    • Overview
    • Features
    • GSQL Query Language
    TIGERGRAPH CLOUD
    • Overview
    • Cloud Starter Kits
    TRY TIGERGRAPH
    • Get Started for Free
    • Compare Editions
    SOLUTIONS
    SOLUTIONS
    • Why Graph?
    use cases
    • Benefits
    • Product & Service Marketing
    • Entity Resolution
    • Customer Journey/360
    • Recommendation Engine
    • Anti-Money Laundering (AML)
    • Cybersecurity Threat Detection
    • Fraud Detection
    • Risk Assessment & Monitoring
    • Energy Management
    • Network Resources Optimization
    • Supply Chain Analysis
    • AI & Machine Learning
    • Geospatial Analysis
    • Time Series Analysis
    industry
    • Advertising, Media & Entertainment
    • Financial Services
    • Healthcare & Life Sciences
    CUSTOMERS
    read all success stories


    PARTNERS
    Partner program
    • Partner Benefits
    • TigerGraph Partners
    • Sign Up
    RESOURCES
    LIBRARY
    • Resource Library
    • Benchmark
    • Webinars
    Events
    • Trade Shows
    • Graph + AI Summit
    • Graph for All - Million Dollar Challenge
    EDUCATION
    • TigerGraph Academy
    • Certification
    Blog
    • TigerGraph Blog
    DEVELOPERS
    • Developers Hub
    • Community Forum
    • Documentation
    • Ecosystem
    COMPANY
    COMPANY
    • Overview
    • Leadership
    • Careers  
    NEWS
    PRESS RELEASE
    AWARDS
    START FREE
    Start Free
    • Request a Demo
    • SUPPORT
    • COMMUNITY
    • CONTACT
    Dr. Jay Yu

    Dr. Jay Yu | VP of Product and Innovation

    Dr. Jay Yu is the VP of Product and Innovation at TigerGraph, responsible for driving product strategy and roadmap, as well as fostering innovation in graph database engine and graph solutions. He is a proven hands-on full-stack innovator, strategic thinker, leader, and evangelist for new technology and product, with 25+ years of industry experience ranging from highly scalable distributed database engine company (Teradata), B2B e-commerce services startup, to consumer-facing financial applications company (Intuit). He received his PhD from the University of Wisconsin - Madison, where he specialized in large scale parallel database systems

    Todd Blaschka | COO

    Todd Blaschka is a veteran in the enterprise software industry. He is passionate about creating entirely new segments in data, analytics and AI, with the distinction of establishing graph analytics as a Gartner Top 10 Data & Analytics trend two years in a row. By fervently focusing on critical industry and customer challenges, the companies under Todd's leadership have delivered significant quantifiable results to the largest brands in the world through channel and solution sales approach. Prior to TigerGraph, Todd led go to market and customer experience functions at Clustrix (acquired by MariaDB), Dataguise and IBM.