


What is a graph database and why should you care?
Making the right business decisions requires understanding the relationships of any one action or asset as they relate to each other. Many enterprises, data analytics companies, and data scientists are finding new ways to explore connections and relationships to see what additional insights our data can give us.
Graph analysis recognizes that all data represents something in the real world, and almost everything in the real world is connected in some way. Finding these new patterns from relationships could be used to search for better product recommendations for e-commerce sites, banks searching for fraud indicators before it happens, or manufacturing companies looking for ways to improve the efficiency of their supply chains.
TigerGraph Cloud is the industry’s first and only distributed native graph database-as-a-service, enabling users to accelerate the adoption of graphs with easy-to-use features that process analytics and transactional workloads in real-time. With the latest 3.8 release, you can also provision your ML Workbench Jupyter notebook on TigerGraph Cloud to have a one-stop shop experience for both your graph database and graph machine learning development environment.
A Case Study: Fraud detection with graph-enhanced ML model
Companies around the world are investing in graphs as a competitive advantage. Research in the field of graph algorithms and machine learning has shown that big improvements in predictive model quality can be made by structuring data in a graph structure that inherently captures context and relationships. Particularly, in the fraud domain, a Graph-enhanced machine learning model can learn the underlying pattern of the relationship between fraudulent transactions and actors which otherwise a traditional ML approach such as an XGBoost model failed to capture.
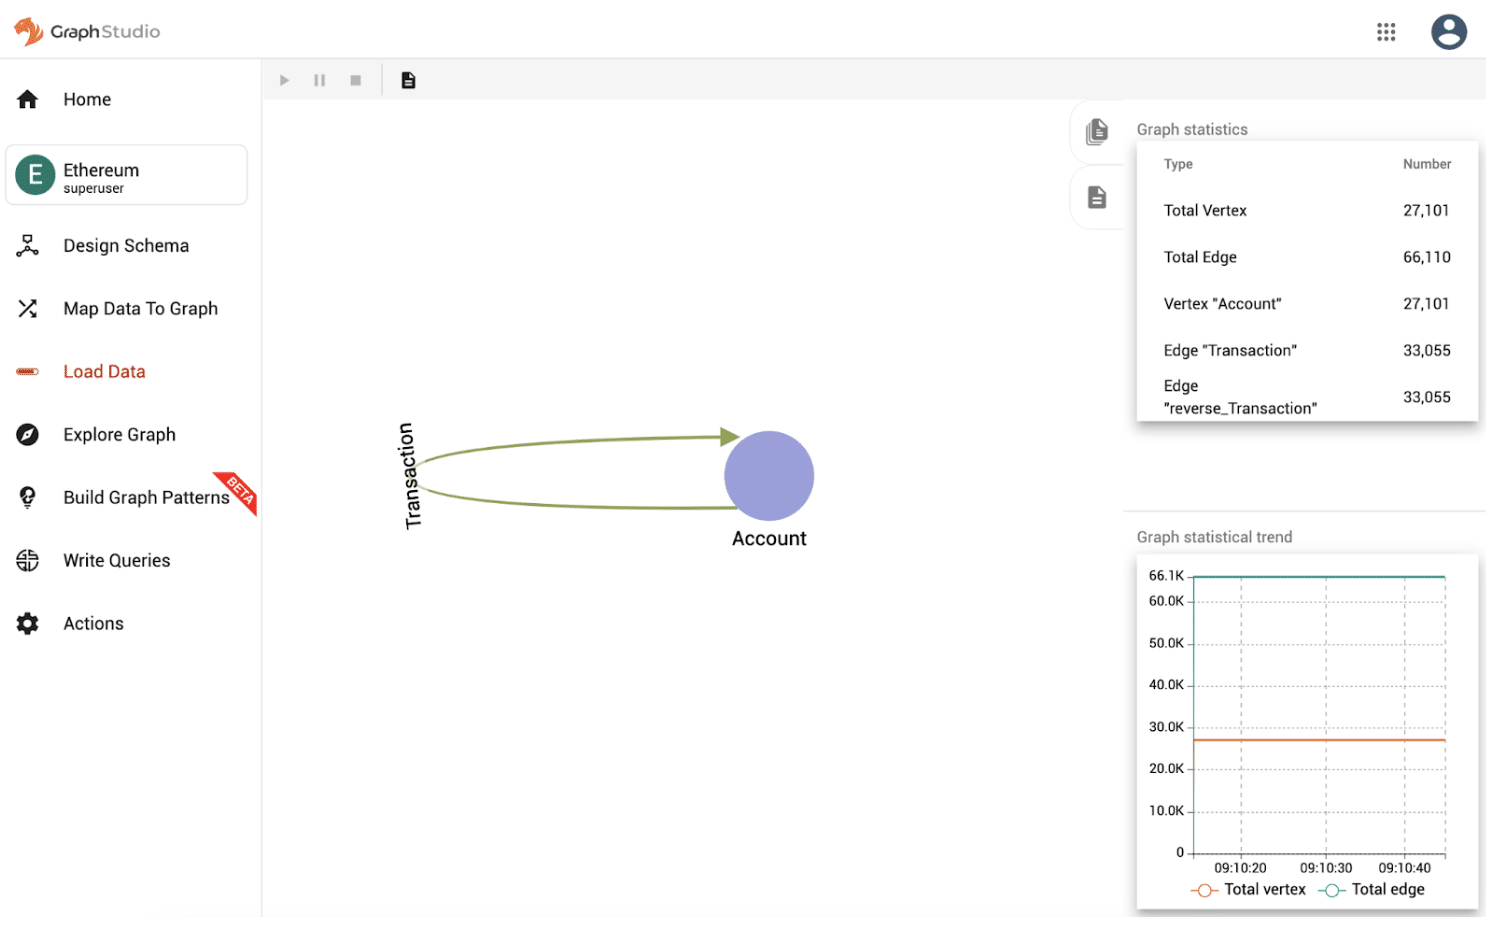
In this blog, we will explore ways you can apply graph algorithms and graph features to tackle fraud detection problems. We will showcase how to construct your graph data set with TigerGraph, then we will walk through a Jupyter notebook example to construct an end-to-end fraud detection application with a GNN model using the Ethereum dataset which contains accounts (with positive and negative labels) and transactions between them. Here is how the schema looks.
 Constructing your Graph on TigerGraph Cloud
Before any model development, we need first to construct your graph. For this example, we will be using a free version of TigerGraph Cloud, the industry’s first and only native parallel graph database-as-a-service.
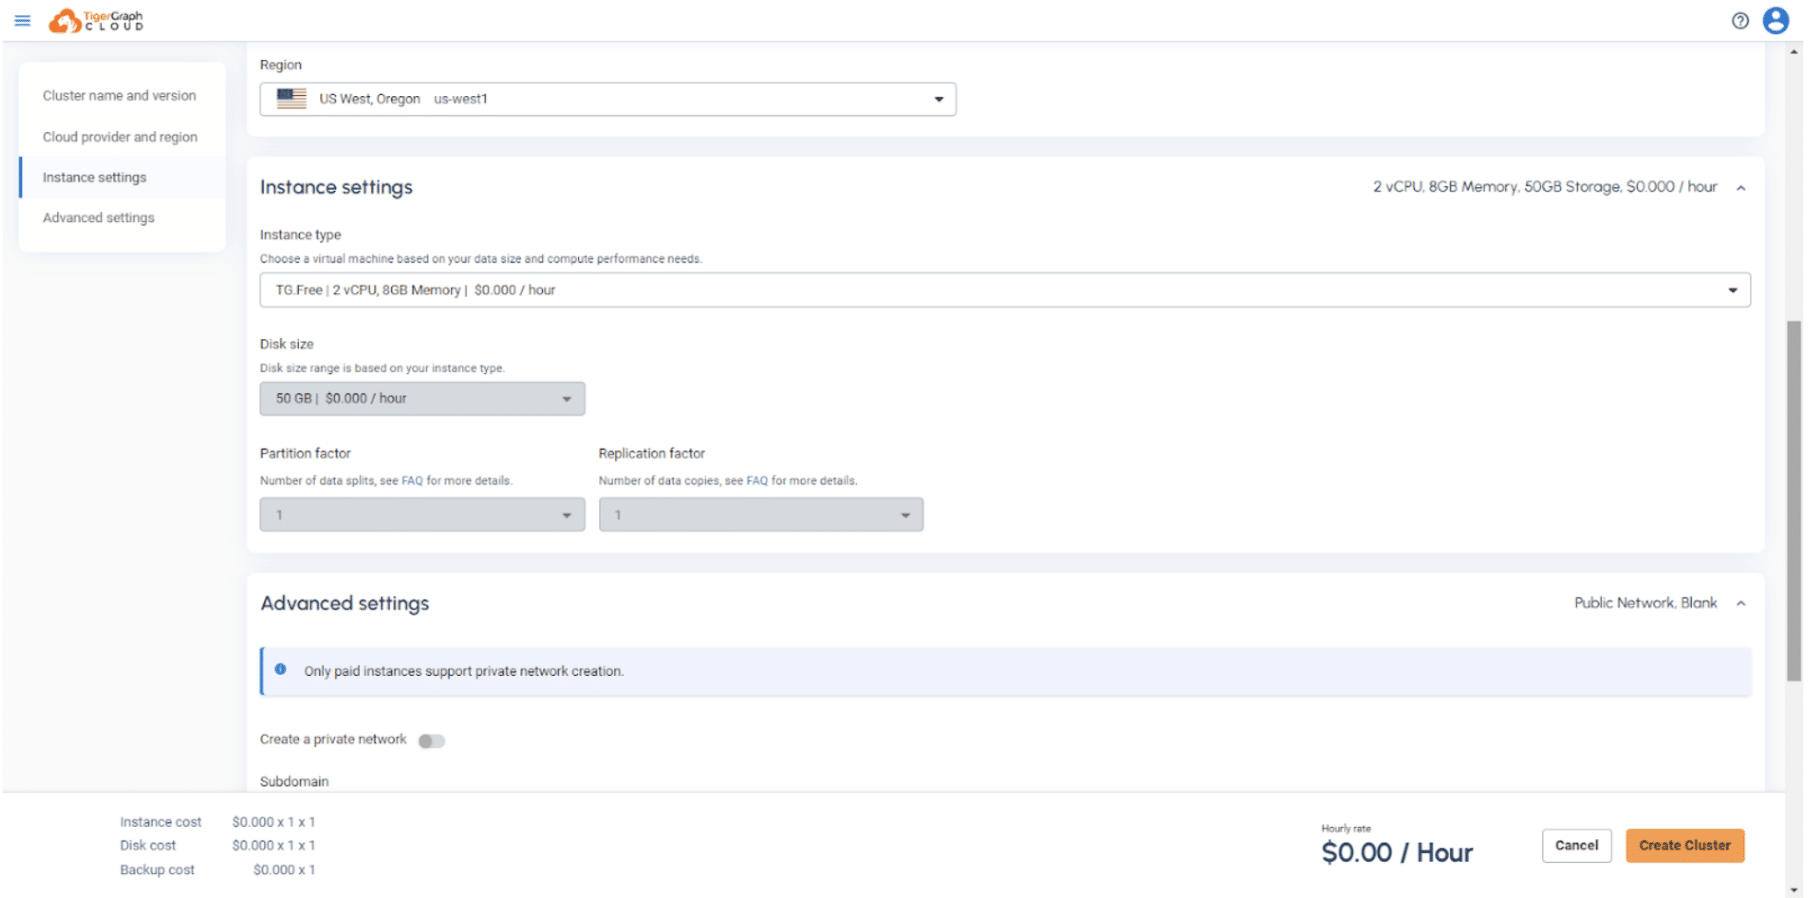
To get started with your TigerGraph database cluster, you simply need to walk through the cluster provisioning process by selecting the hardware configurations
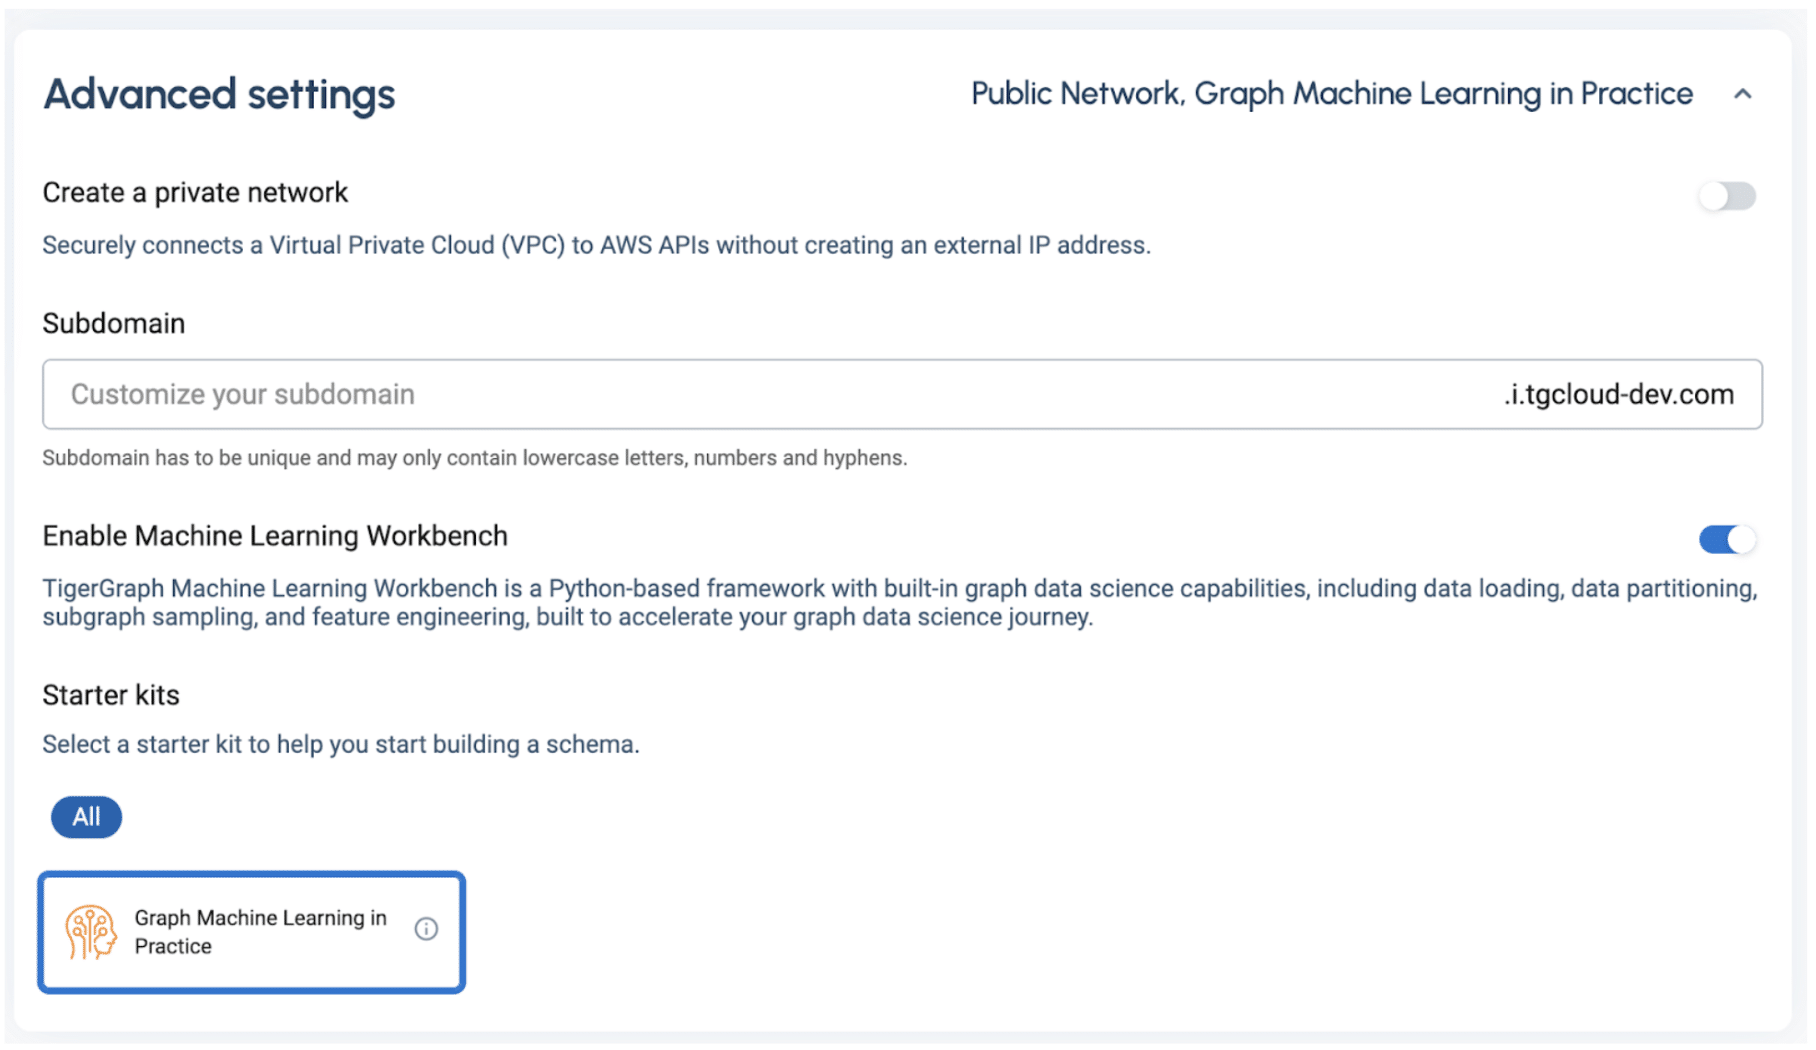
 In the advanced setting section, make sure to enable Machine Learning Workbench, then select Graph Machine Learning in the practice starter kit so it is included in your provisioning cluster. (Note: for this release, we will only support single server configuration i.e. Partition Factor = 1)
TigerGraph ML Workbench on TigerGraph Cloud
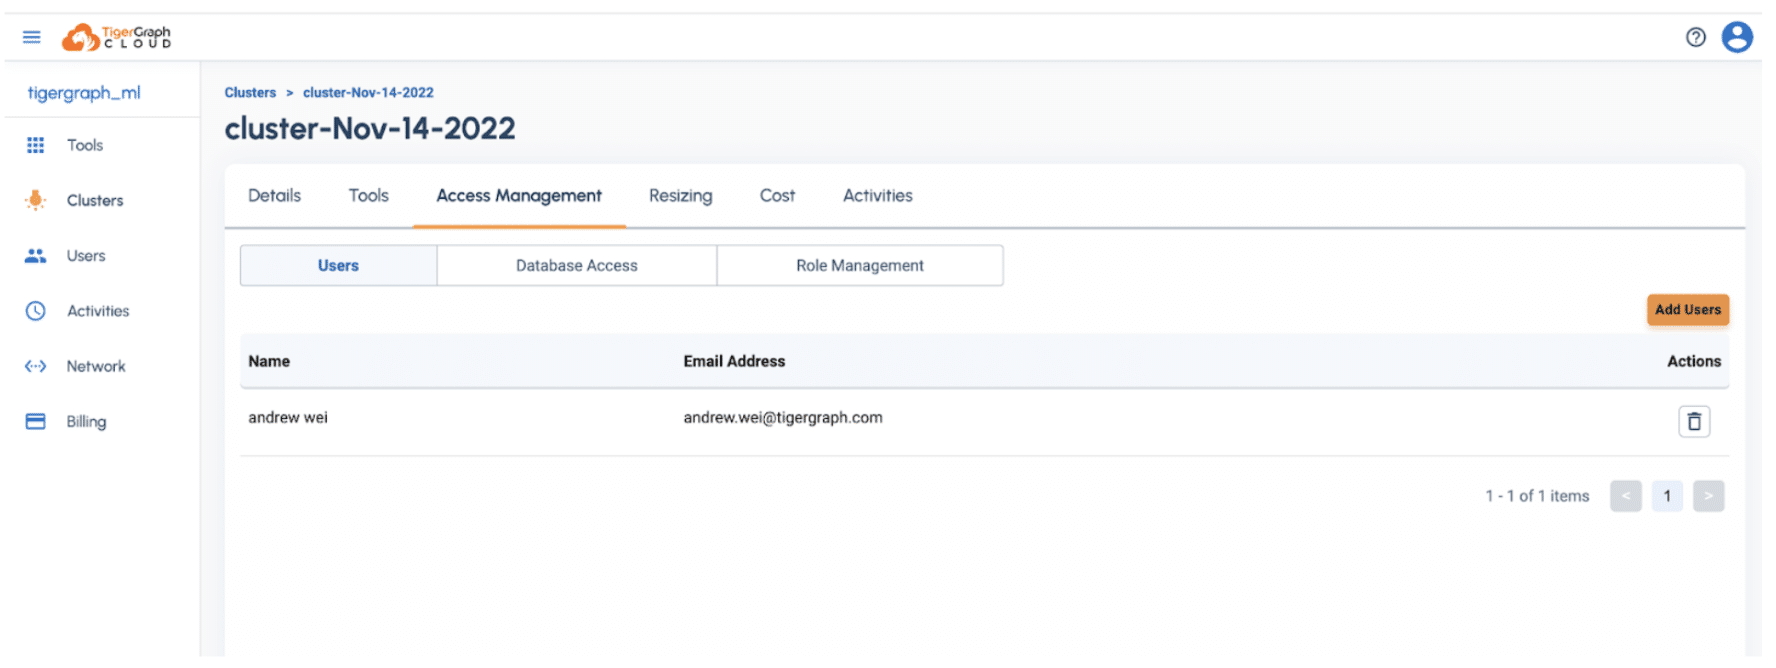
Once your Graph database is provisioned. You will need to add a user and password to connect to the database with the Machine Learning Workbench. Simply click on “Access Management” of the cluster you just provisioned from the “Cluster” tab on the left, then click “Add User” with your credentials.
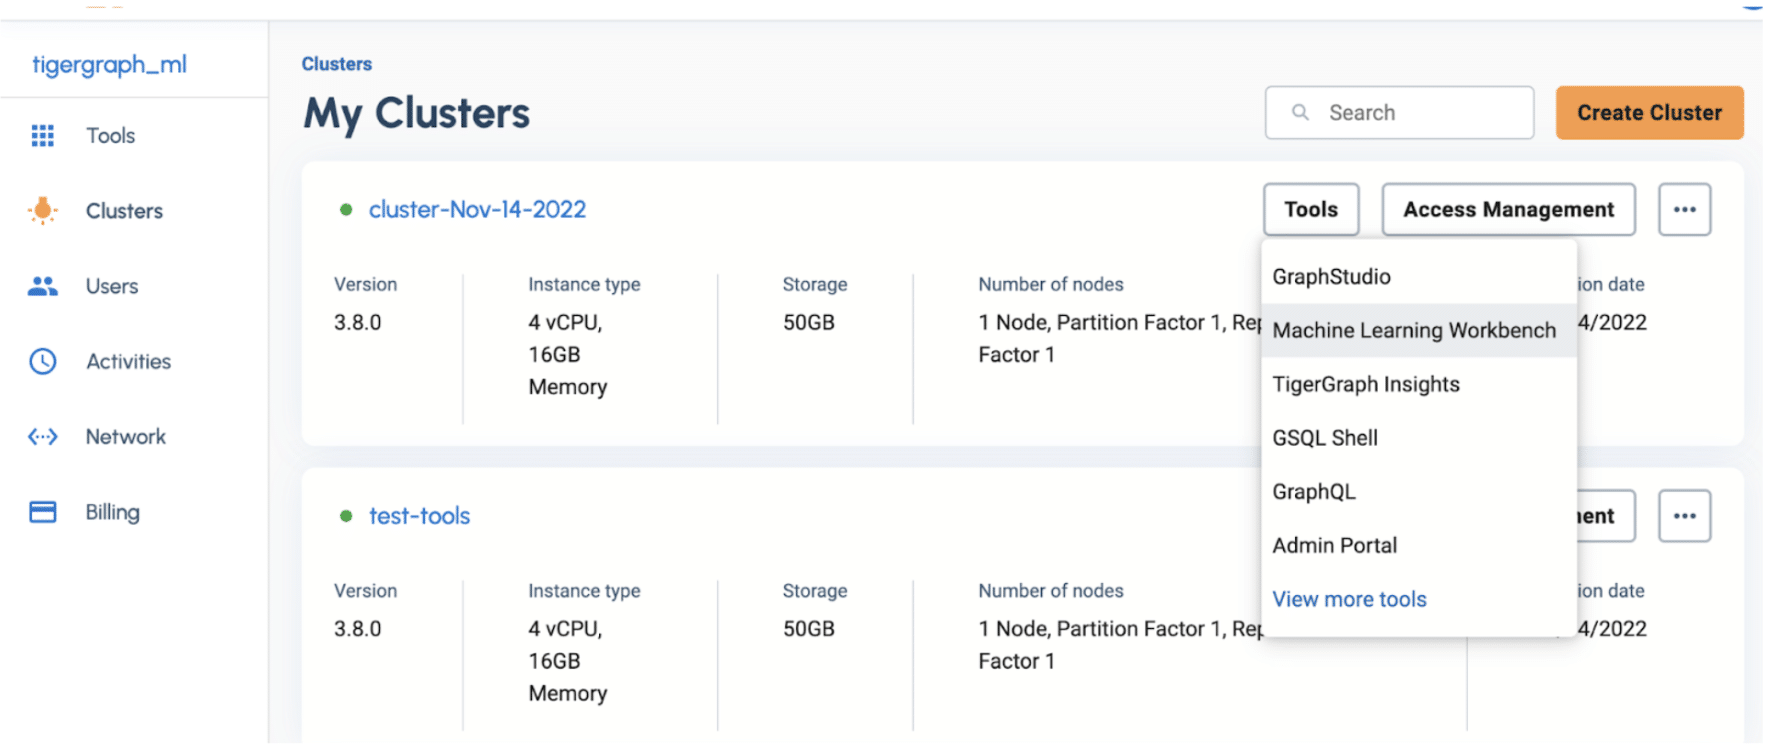
 Once you have added a user, you can now leverage Machine Learning Workbench directly by clicking on the Clusters on the left panel, then click on Tools → Machine Learning Workbench.
 A new browser window will be opened, and you will be landing on Machine Learning Workbench’s Jupyter server.
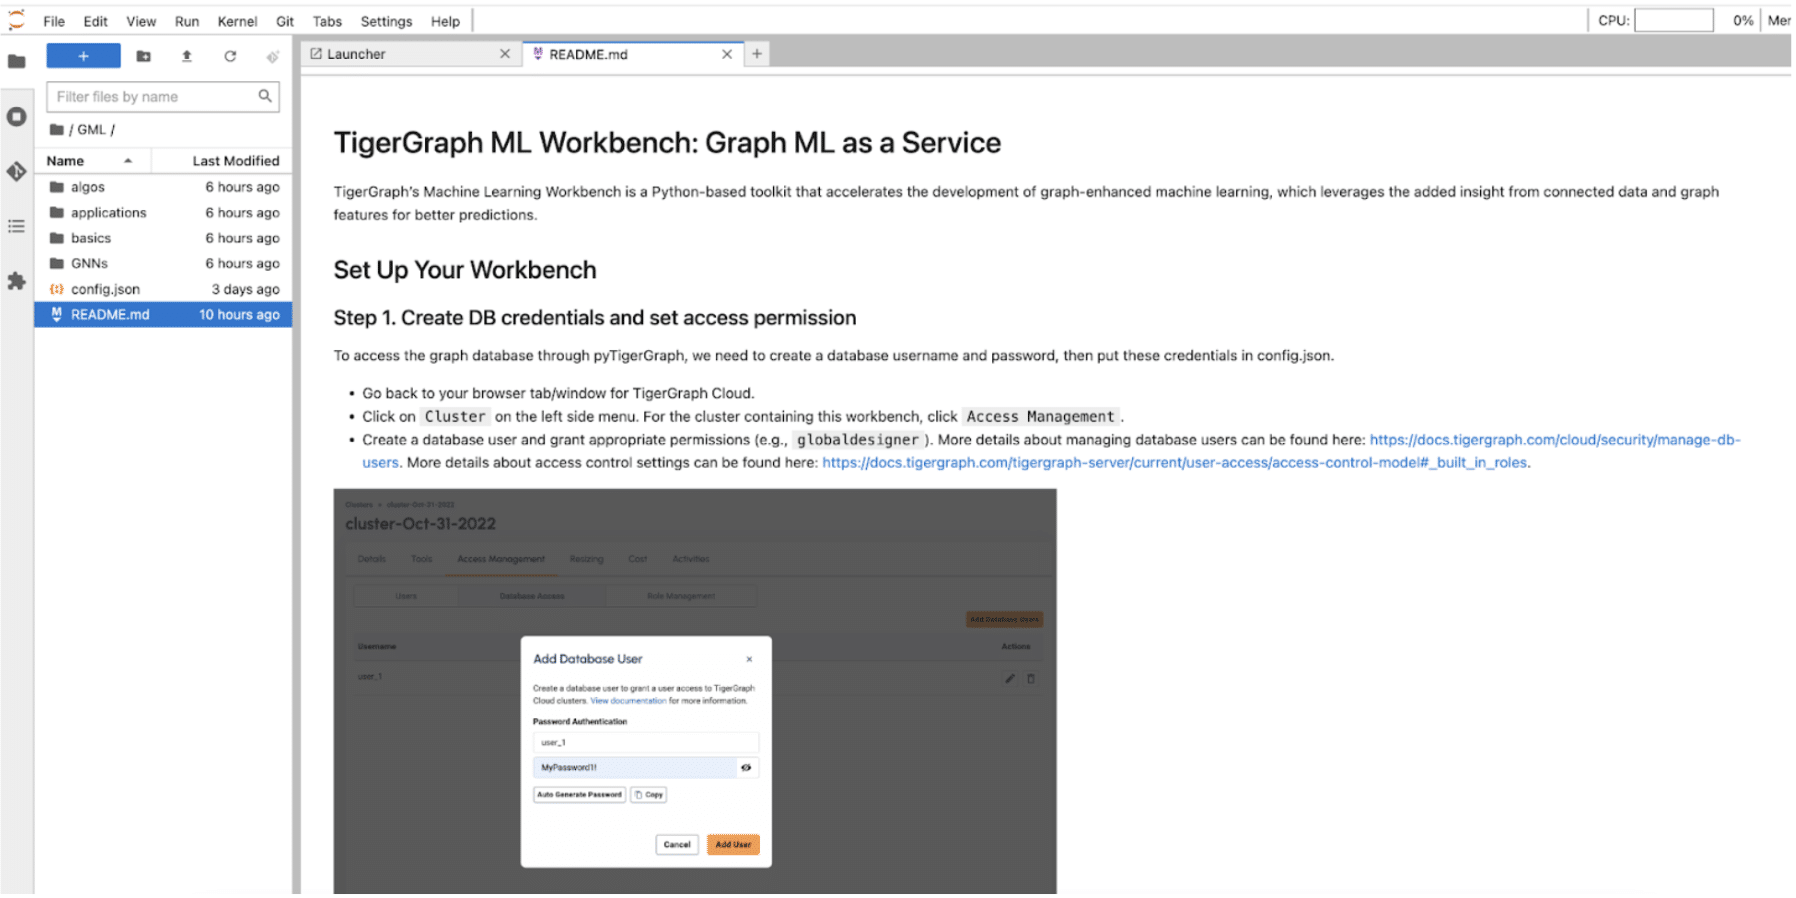
The Machine Learning Workbench comes with many great tutorials, including examples of how to use our ML capabilities using pyTigerGraph, running algorithms from our Graph Data Science Library, as well as end-to-end applications.
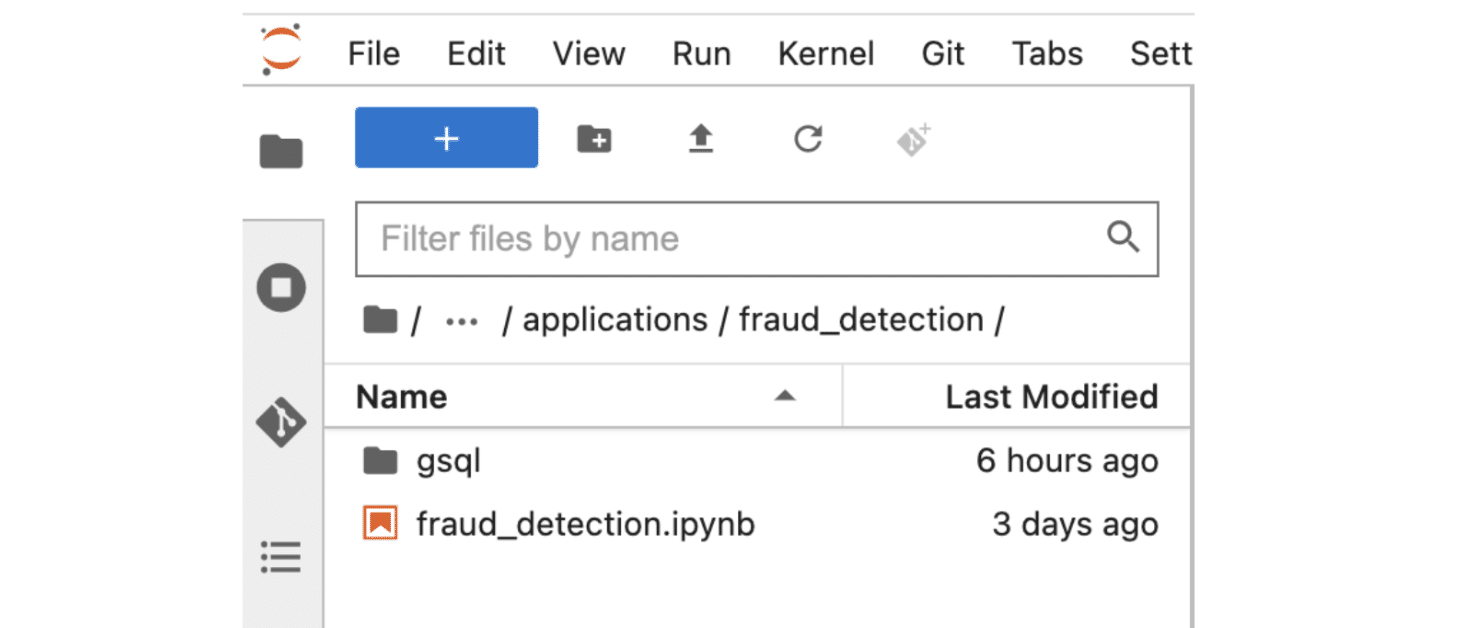
You might have heard of the recent breakthrough in AI/ML with Graph Neural Networks. In this blog, we will showcase how easy it is to build a GNN model with our built-in python capabilities such as graph data partitioning, data exporting/batching, and graph feature engineering. The notebook can be found under GML→ Applications → Fraud_Detection → Fraud_Detection.ipynb.
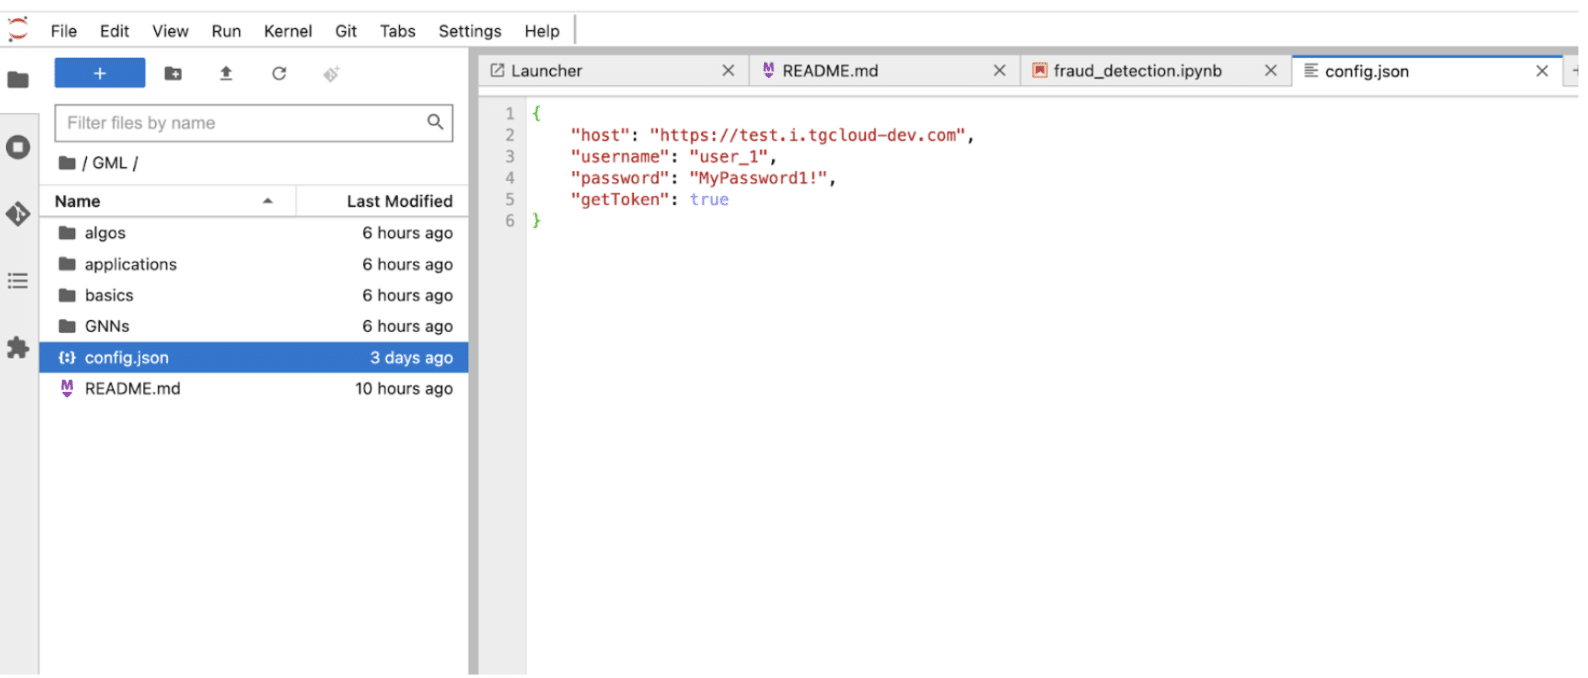
 Before running any code, you first need to make sure the username and password from the config.json (in the root folder of the Jupyter Server) is updated accordingly to the new user you just created from tgcloud.io.
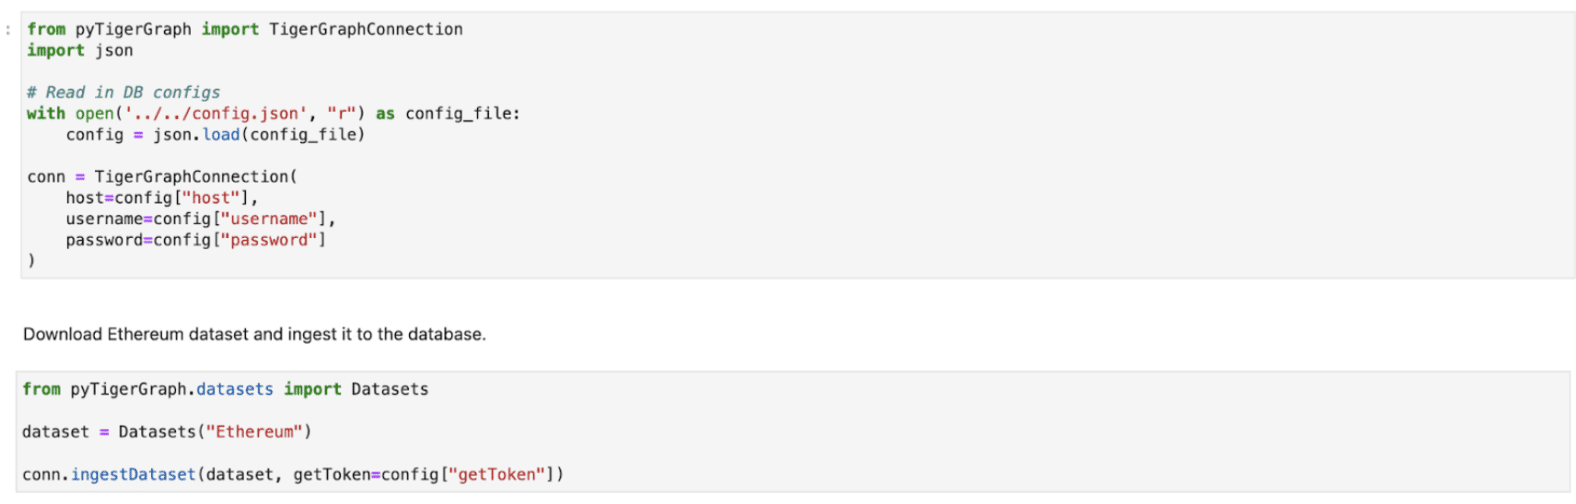
 Now, we are ready to make a connection to your TigerGraph Cloud DB instances by simply running the following code, and importing the Ethereum data set to your instance.
Preparing your Graph Datasets
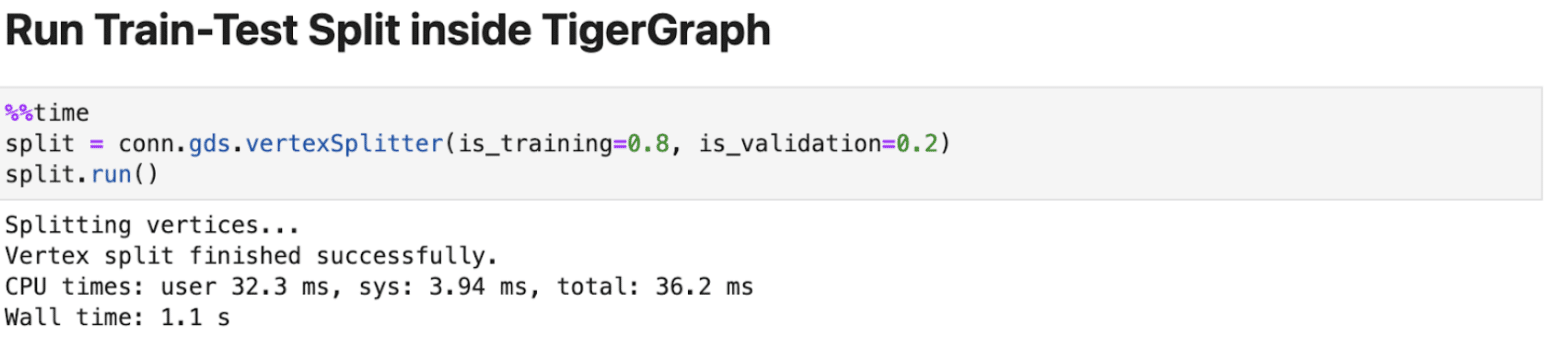
Like any other supervised machine learning model, GNN requires training, validation, and a test set for model development. ML Workbench makes data partitioning easy with a simple command. We will partition your graph data while preserving the relationship of your data set.
Graph Feature Engineering
The ML workbench includes quite a few graph algorithms from TIgerGraph’s Graph Data Science Library to perform feature engineering. The key functions the notebook is highlighting are:
- listAlgorithm(): If it gets the class of algorithms (e.g. Centrality) as an input, it will print the available algorithms for the specified category; otherwise it will print all available algorithm categories.
- installAlgorithm(): Gets the name of the algorithm as input and installs the algorithm if it is not already installed.
- runAlgorithm(): Gets the algorithm name and parameters to run the algorithm with. If the algorithm is not already installed and in TigerGraph’s Graph Data Science library, the algorithm will automatically install the query and create the necessary schema attributes in the graph.
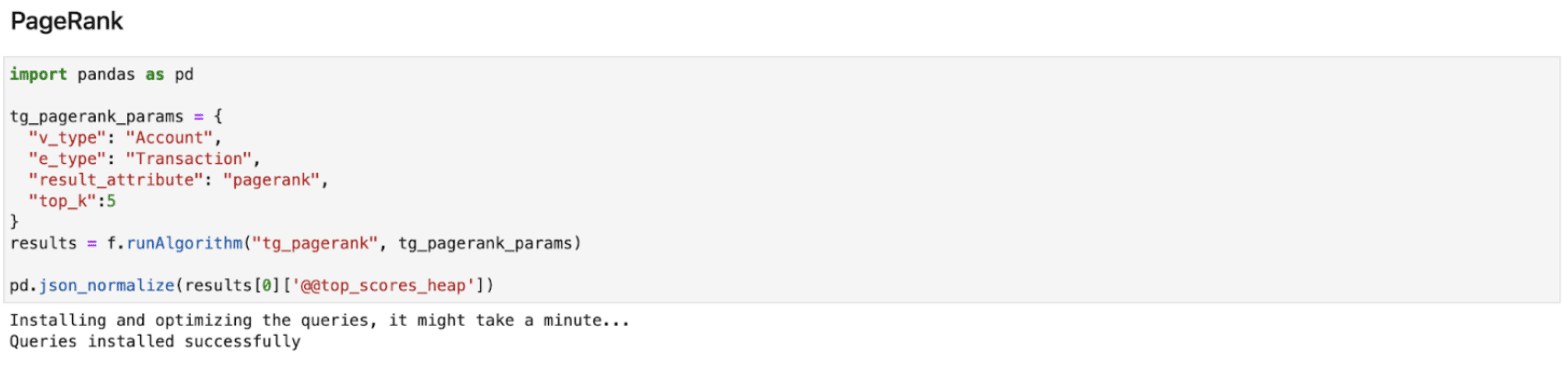
The following code shows how to use the Featurizer to get PageRank as a feature. You can also define your own custom features by running your own GSQL query and running it through Featurizer.
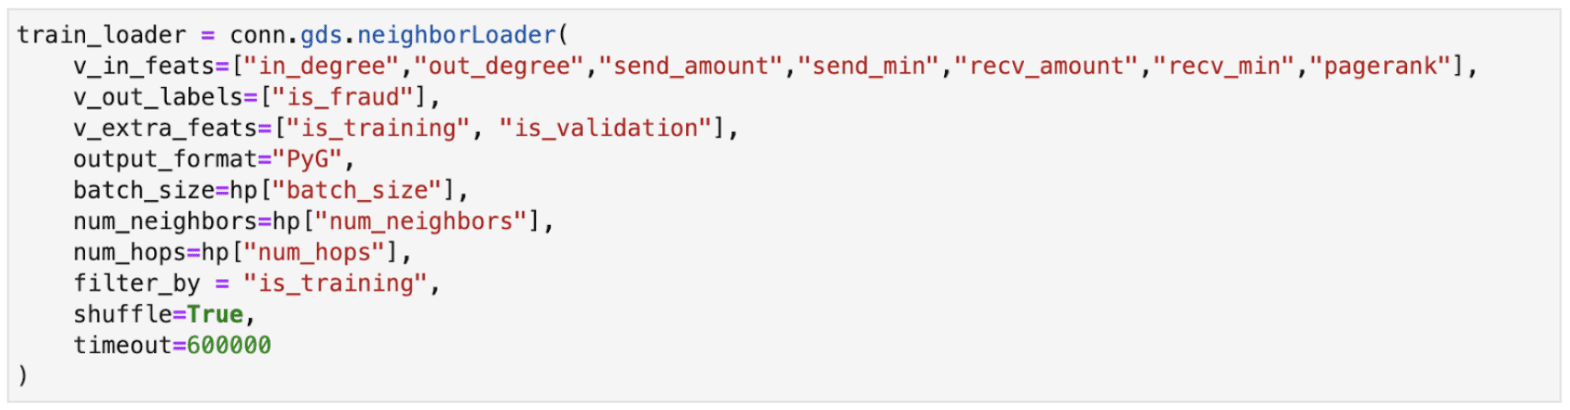
 Now that we are done with feature engineering, the next step is to export your training, validation, and test data set using our Neighbor Loader function. You can define your sampling strategies such as batch size, number of hops, and number of neighbors with our Neighbor Loader function.
Training your GNN model
Now that we are done with graph feature engineering, and have all the data exported into your Machine Learning Workbench environment to train a machine learning model.
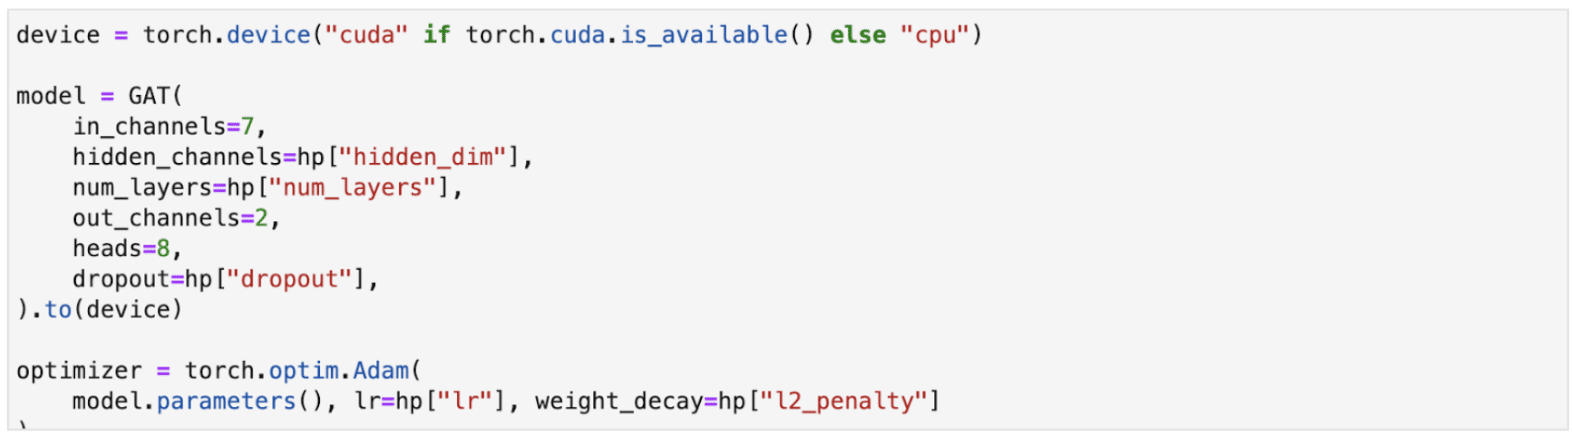
We embrace the open-source community, which is why we make TigerGraph ML Workbench to be compatible with some of the most popular deep learning frameworks such as PyTorch Geometric, and Tensorflow. Notice in the code above, we are directly exporting your connected data in a PyG format specified in the output_format parameter, and you will be able to directly leverage PyG to train a GNN model such as a Graph Attention Network. See the example below:
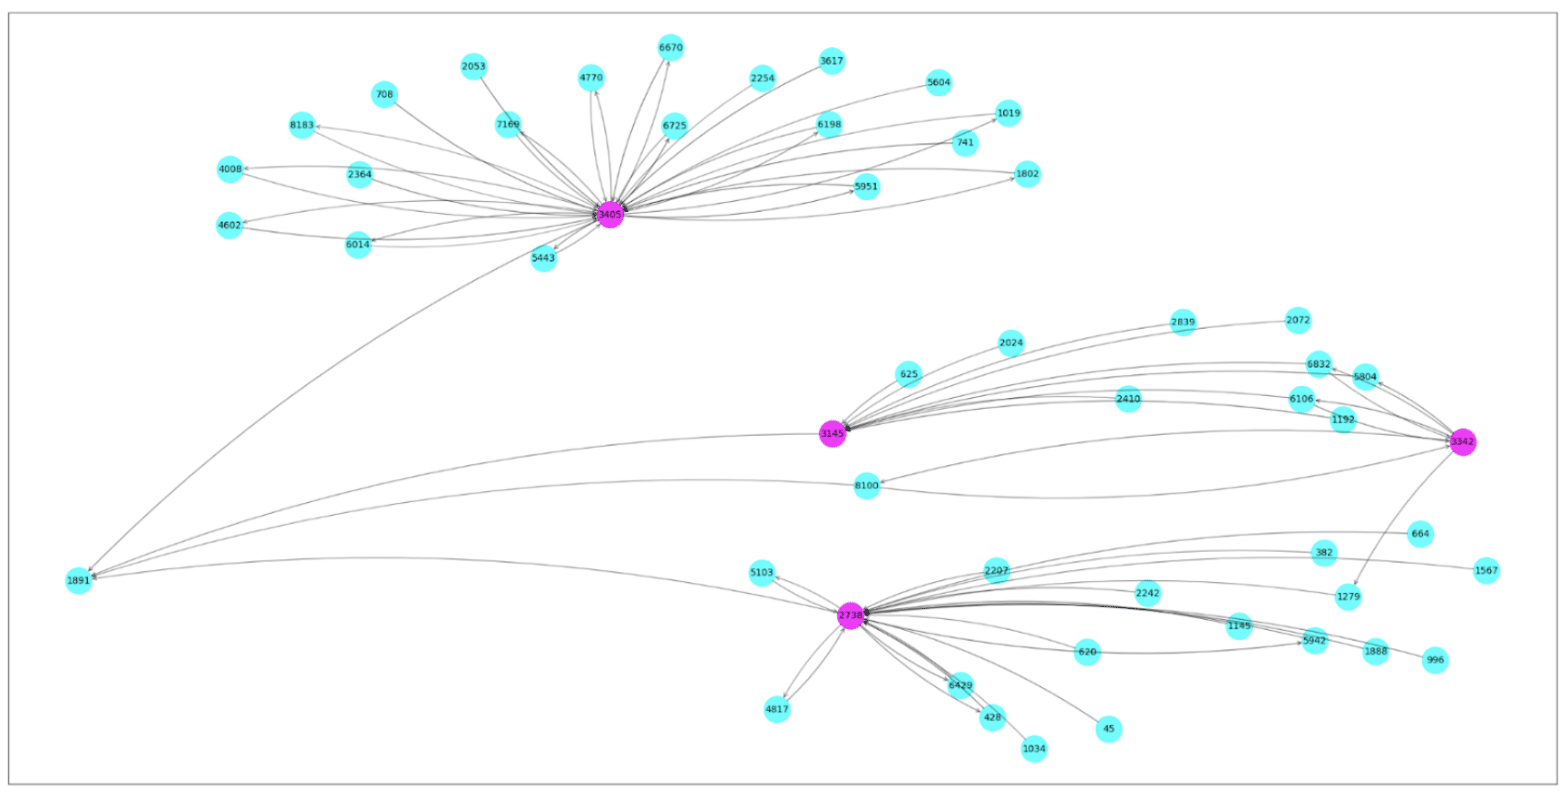
 Once your model training is complete, you can do inference on your model to see how a fraudster is moving transactions through its network. To better explain the prediction behavior, we can visualize the subgraph associated with the predicting vertex.
Visualize Your Model Prediction with Subgraphs
In this example, vertex #1891 is predicted to be a fraud account. Vertices in pink are known fraudulent accounts, and vertices colored in blue are unknown accounts. It looks like vertex 1891 is the mastermind behind a fraudster network that has been taking money from innocent users!
Next Steps
If you found this article interesting and wanted to build your own GNN applications, please try out our TigerGraph Cloud and TigerGraph ML Workbench for free. Check out our tutorials from our Github. You can also find the link to the notebook example we walked through in this blog post. We look forward to learning more about what kind of application you can build with TigerGraph.
Get started with TigerGraph Cloud today for free. No credit card is required.


