Skip to content
START FOR FREE
START FOR FREE
  • SUPPORT
  • COMMUNITY
  • CONTACT US
  • SUPPORT
  • COMMUNITY
  • CONTACT US
MENUMENU
  • Products
    • The World’s Fastest and Most Scalable Graph Platform

      LEARN MORE

      Watch a TigerGraph Demo

      TIGERGRAPH CLOUD

      • Overview
      • TigerGraph Cloud Suite
      • FAQ
      • Pricing

      USER TOOLS

      • GraphStudio
      • Insights
      • Application Workbenches
      • Connectors and Drivers
      • Starter Kits
      • openCypher Support

      TIGERGRAPH DB

      • Overview
      • GSQL Query Language
      • Compare Editions

      GRAPH DATA SCIENCE

      • Graph Data Science Library
      • Machine Learning Workbench

      Success Plans

  • Solutions
    • The World’s Fastest and Most Scalable Graph Platform

      LEARN MORE

      Watch a TigerGraph Demo

      Solutions

      • Solutions Overview

      INCREASE REVENUE

      • Customer Journey/360
      • Product Marketing
      • Entity Resolution
      • Recommendation Engine

      MANAGE RISK

      • Fraud Detection
      • Anti-Money Laundering
      • Threat Detection
      • Risk Monitoring

      IMPROVE OPERATIONS

      • Supply Chain Analysis
      • Energy Management
      • Network Optimization

      By Industry

      • Advertising, Media & Entertainment
      • Financial Services
      • Healthcare & Life Sciences

      FOUNDATIONAL

      • AI & Machine Learning
      • Time Series Analysis
      • Geospatial Analysis
  • Customers
    • The World’s Fastest and Most Scalable Graph Platform

      LEARN MORE

      CUSTOMER SUCCESS STORIES

      • Ford
      • Intuit
      • JPMorgan Chase
      • READ MORE SUCCESS STORIES
      • Jaguar Land Rover
      • Xbox
  • Partners
    • The World’s Fastest and Most Scalable Graph Platform

      LEARN MORE

      PARTNER PROGRAM

      • Partner Benefits
      • TigerGraph Partners
      • Sign Up
      TigerGraph partners with organizations that offer complementary technology solutions and services.​
  • Resources
    • The World’s Fastest and Most Scalable Graph Platform

      LEARN MORE

      BLOG

      • TigerGraph Blog

      RESOURCES

      • Resource Library
      • Benchmarks
      • Demos
      • O'Reilly Graph + ML Book

      EVENTS & WEBINARS

      • Events &Trade Shows
      • Webinars

      DEVELOPERS

      • Documentation
      • Ecosystem
      • Developers Hub
      • Community Forum

      SUPPORT

      • Contact Support
      • Production Guidelines

      EDUCATION

      • Training & Certifications
  • Company
    • Join the World’s Fastest and Most Scalable Graph Platform

      WE ARE HIRING

      COMPANY

      • Company Overview
      • Leadership
      • Legal Terms
      • Patents
      • Security and Compliance

      CAREERS

      • Join Us
      • Open Positions

      AWARDS

      • Awards and Recognition
      • Leader in Forrester Wave
      • Gartner Research

      PRESS RELEASE

      • Read All Press Releases
      TigerGraph Debuts TigerGraph CoPilot for Graph-Augmented AI, New Cloud-Native Generation of TigerGraph Cloud, and Solution Kits
      April 30, 2024
      Read More »

      NEWS

      • Read All News

      Best paper award at International Conference on Very Large Data Bases

      New TigerGraph CEO Refocuses Efforts on Enterprise Customers

  • START FREE
    • The World’s Fastest and Most Scalable Graph Platform

      GET STARTED

      • Request a Demo
      • CONTACT US
      • Try TigerGraph
      • START FREE
      • TRY AN ONLINE DEMO

Reduce AML Investigation Costs with TigerGraph

  • Parker Erickson
  • September 5, 2023
  • blog
  • Blog >
  • Reduce AML Investigation Costs with TigerGraph

by Parker Erickson and Victor Lee

Anti-Money Laundering (AML) refers to the set of laws, regulations, and procedures aimed at preventing and detecting money laundering – the concealment of illegally obtained funds, through the creative use of transactions. A common money laundering pattern called “layering” uses a mesh of mostly ordinary-looking transactions among colluding businesses and individuals that funnel money from one source to a target destination.

Money laundering layering

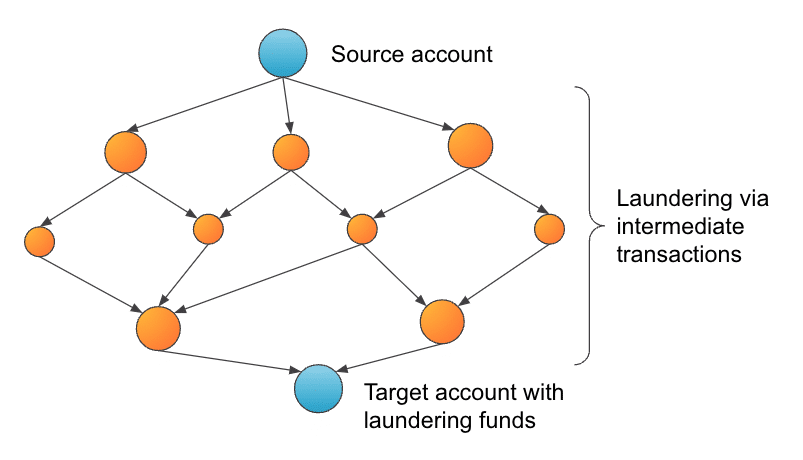
Money laundering through layering

To comply with government regulations, financial institutions build and operate systems that aim to flag potential money laundering behavior, typically done with hard-coded rules. However, due to the complexity of financial transactions and the various legitimate reasons for certain patterns of behavior, these systems often generate a significant number of false positive alerts. As the number of transactions grows worldwide, financial institutions are struggling to keep up with these alerts in a scalable manner, all while having to identify the changing patterns criminals undertake to prevent getting caught. To meet this challenge, more financial institutions are looking towards utilizing machine learning to help sift through the mountain of alerts in order to find suspicious activity.

The AML Investigation Process

The anti-money laundering process starts with the alerting process. In conventional AML systems, a set of alert rules are applied to transactions and the parties involved. A human investigator may need to take a look at flagged activity to judge if it is unusual for the party in question. If it is unusual, the party is elevated to a case status, where a further human review of the activity in question is used to determine if the activity is suspicious and should be reported to the appropriate government authorities. If that is the case, a Suspicious Activity Report (SAR) is filed, and the financial institution has completed their regulatory requirements. If a financial institution fails to report suspicious activity, they become open to being investigated and fined by the regulatory bodies.

AML Workflow

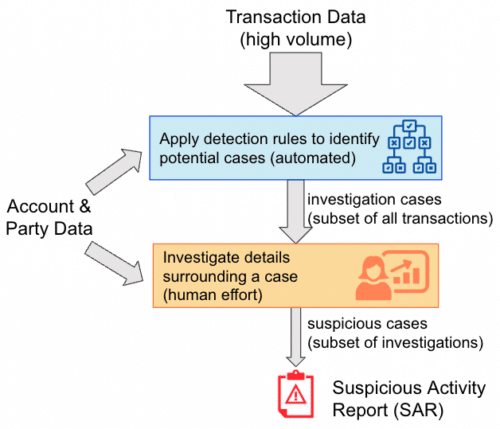
The AML investigation process

Financial institutions need to be as proficient and accurate as possible at detecting money laundering to satisfy regulators. The most efficient method is to improve the alert rules so that there are fewer false positives (alerts that turn out not to be real money laundering) and few false negatives (real money laundering that wasn’t detected). In practice, false positives are the bigger problem. Imperfect screening tends to flag too many transactions, and all those extra alerts (false positives) translate to higher human investigation costs.

Why Graph Machine Learning?

In order to reduce these false positive alerts while maintaining the rate in which suspicious activity is flagged, many institutions are turning towards machine learning (ML) to classify transactions and prioritize the alerts to be investigated. This is because machine learning is able to take a large number of data characteristics (or “features”) and then find the right balance of those factors that optimizes a goal, such as catching 98% of money laundering with a minimal amount of false positives. Conventional machine learning has proven to be helpful, but it is not enough.

Institutions are turning to graph machine learning to reduce their false positives and thereby lower their operating costs, by 10%, 20%, and more. Graph is able to provide this boost because it analyzes relationships. Money laundering only becomes apparent when the connections between parties and events are analyzed. Two types of connections are important:

  • Connections between individuals (e.g., beneficial ownerships, politically exposed persons, etc.)
  • Flows of money between accounts (e.g., cycles of transactions, mule accounts, etc.)

Graph machine learning is a subfield of machine learning that utilizes a graph data structure to either generate features for traditional ML models such as XGBoost, or native graph ML models such as Graph Neural Networks. The core idea is to incorporate information about the relationships between different entities in a complex system. The financial service space is a perfect space to apply these techniques, due to the core form of data – financial transactions – being inherently a relationship between different entities – accounts and parties. As AML is all about determining if relationships between accounts is suspicious activity, it makes it a natural fit to apply graph machine learning.

Graph Machine Learning Techniques

In the anti-money laundering space, there are a few different techniques for incorporating graph structure into ML pipelines. The first is to calculate graph features for existing ML models such as XGBoost, Random Forests, and more. These graph features can be standard graph algorithms, such as PageRank or Shortest Path, or they can be patterns that are tailored to the particular bank’s data model and customer behavior, such as “the number of previously flagged Parties within 3 degrees of separation from the Party in question, weighted by the size of the transactions.”. Another method is to use graph neural networks which natively incorporate relationships between entities in the machine learning model, without the need for explicit feature extraction.

graph-enhanced ML, 2 ways

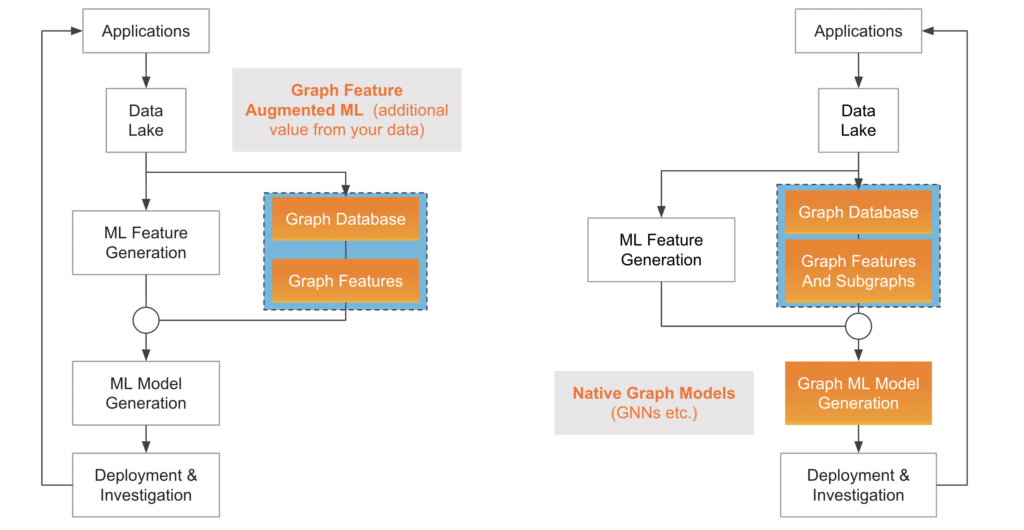
Two methods of Graph Machine Learning. Pictured on the left is incorporating graph features with traditional ML models, while the right represents utilizing native graph ML models such as GNNs.

TigerGraph is a leader in graph feature generation due to its scalability (10s of Terabytes of graph data), as well as execution speed due to its natively distributed and massively parallel processing (MPP) architecture. TigerGraph’s support for Python and several ML libraries make it simple for data scientists to add graph features or graph machine learning to their existing ML workflows.

Graph Features And Traditional Machine Learning

Various graph features can be used to help traditional machine learning models perform in anti-money laundering and financial crime detection in general. Here, we are going to give an overview of 3 main classes of graph algorithms that can be used for graph features:

  • Shortest Path: Shortest path algorithms can answer questions like “how close is the party of interest to a party that has exhibited suspicious behavior in the past?”, which may provide a useful signal to the downstream machine learning model.

shortest path algorithms

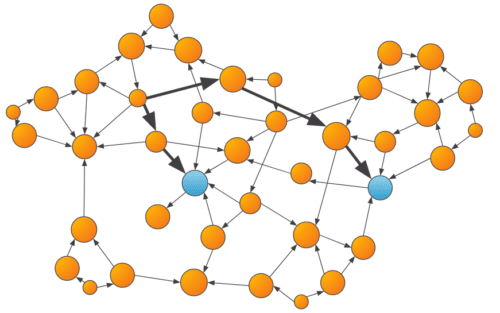
An example of shortest path algorithms determining how close a party is to a known suspicious party.

  • Centrality: Centrality algorithms, such as PageRank, can measure the influence of a vertex on others within the graph, which can be a useful feature in the ML model, especially when used in conjunction with if the influential parties were known to be suspicious in the past.

centrality algorithms

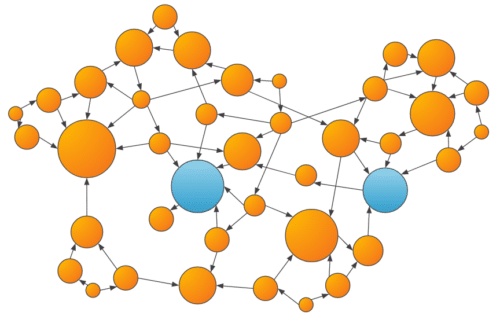
An example of the output of a centrality algorithm, where larger scores are denoted by larger vertices. Parties that are more central have more transaction inflow and outflow, which may be a suspicious behavior.

  • Community Detection: Community algorithms, such as Weakly Connected Components (WCC) or Louvain, can be used to determine groups of vertices that share common characteristics or heavily interact with each other. Once the communities are determined, features such as the community size, the number/amount of transactions within the community, and more, can be calculated and passed to the ML model.

community detection algorithms

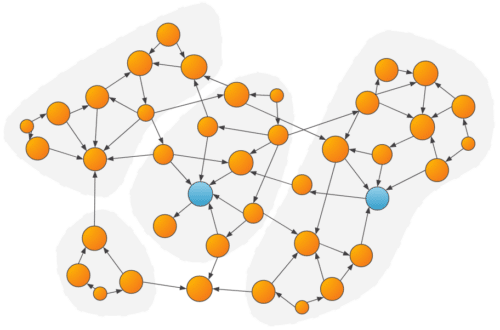
Example of communities detected within a graph. Parties that are within the same community as a suspicious party might be more likely to be suspicious as well.

Through these algorithms, we can then perform other manipulations or aggregations to the data. For example, how many parties within a community have had a SAR filed on them? How many unique addresses are within the community? What are the most influential parties within the community as measured by PageRank? All these different types of features usually result in top feature importance values when analyzed via SHAP or XGBoost feature importance measures.

Graph Neural Networks

Graph Neural Networks (GNNs) are a flavor of neural network architecture that operates on graph data structures. These algorithms take into account both the numerical attributes of vertices in the graph, but also the edges between the vertices explicitly. This method can result in an additional accuracy lift over just incorporating graph features into traditional machine learning models. Additionally, they can provide an extra layer of explainability to investigators, as the model not only provides feature importance, but also the importance of the edges between different vertices in the graph.

gnn neighbor aggregation

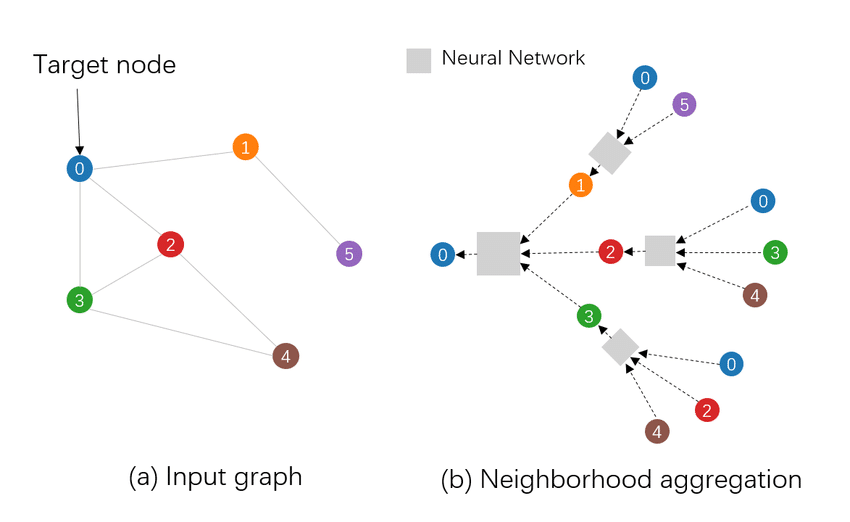
Example of how a Graph Neural Network makes its predictions.
Image Source: https://www.researchgate.net/figure/Given-an-input-graph-a-GNN-predicts-the-label-of-the-target-node-eg-the-blue-node_fig2_346143176

Conclusion

In the dynamic arena of Anti-Money Laundering (AML), the conventional rule-based approach to spotting potential financial crimes is yielding to the transformative potential of graph machine learning. The escalating volume of financial transactions and the prevalence of false positive alerts have catalyzed the adoption of innovative techniques that prioritize investigation efficiency. Graph machine learning, with its ability to decipher intricate relationships between entities in financial data, emerges as a pivotal solution. By leveraging graph features and advanced Graph Neural Networks, institutions can not only mitigate false positives but also enhance investigative accuracy. In this landscape, TigerGraph’s prowess shines – its scalability and performance in generating graph features have positioned it as a leader. As financial institutions navigate the complex terrain of AML, the convergence of graph machine learning and TigerGraph’s capabilities promises a more resilient defense against money laundering while optimizing resource allocation for investigations.

TigerGraph has demo examples of graph analytics for financial crime detection, which you can try for free on TigerGraph Cloud.

Download TigerGraph’s O’Reilly book Graph-Powered Analytics and Machine Learning. This book uses use case examples, including financial crime detection, to teach about graph analytics and graph machine learning.

You Might Also Like

Graph Developer Proficiency Rating

Graph Developer Proficiency Rating

June 16, 2024
Supply Chain Digital Twins Enable Analytics and Resiliency

Supply Chain Digital Twins Enable Analytics...

May 29, 2024
Putting the Customer First: The Power of the Empty Chair

Putting the Customer First: The Power...

May 17, 2024

Parker Erickson

TigerGraph Blog

  • Categories
    • blogs
      • Customer 360
      • Cybersecurity
      • Developers
      • Digital Twin
      • Engineers
      • Fraud / Anti-Money Laundering
      • GQL
      • GSQL
      • Supply Chain
      • TigerGraph
      • TigerGraph Cloud
    • Graph AI On Demand
      • Customer Spotlight
      • Digital Transformation, Management, & Strategy
      • Finance, Banking, Insurance
      • Graph + AI
      • Graph Algorithms
      • Retail, Manufacturing, and Supply Chain
    • RulesEngine
    • Video
  • Recent Posts

    • Graph Developer Proficiency Rating
    • Supply Chain Digital Twins Enable Analytics and Resiliency
    • Welcome to ENGAGE 2024!
    • Putting the Customer First: The Power of the Empty Chair
    • Join TigerGraph at ENGAGE 2024: Advancing Financial Crime Solutions
    TigerGraph

    Product

    SOLUTIONS

    customers

    RESOURCES

    start for free

    TIGERGRAPH DB
    • Overview
    • Features
    • GSQL Query Language
    GRAPH DATA SCIENCE
    • Graph Data Science Library
    • Machine Learning Workbench
    TIGERGRAPH CLOUD
    • Overview
    • Cloud Starter Kits
    • Login
    • FAQ
    • Pricing
    • Cloud Marketplaces
    USEr TOOLS
    • GraphStudio
    • TigerGraph Insights
    • Application Workbenches
    • Connectors and Drivers
    • Starter Kits
    • openCypher Support
    SOLUTIONS
    • Why Graph?
    industry
    • Advertising, Media & Entertainment
    • Financial Services
    • Healthcare & Life Sciences
    use cases
    • Benefits
    • Product & Service Marketing
    • Entity Resolution
    • Customer 360/MDM
    • Recommendation Engine
    • Anti-Money Laundering
    • Cybersecurity Threat Detection
    • Fraud Detection
    • Risk Assessment & Monitoring
    • Energy Management
    • Network & IT Management
    • Supply Chain Analysis
    • AI & Machine Learning
    • Geospatial Analysis
    • Time Series Analysis
    success stories
    • Customer Success Stories

    Partners

    Partner program
    • Partner Benefits
    • TigerGraph Partners
    • Sign Up
    LIBRARY
    • Resources
    • Benchmark
    • Webinars
    Events
    • Trade Shows
    • Graph + AI Summit
    • Million Dollar Challenge
    EDUCATION
    • Training & Certifications
    Blog
    • TigerGraph Blog
    DEVELOPERS
    • Developers Hub
    • Community Forum
    • Documentation
    • Ecosystem

    COMPANY

    Company
    • Overview
    • Careers
    • News
    • Press Release
    • Awards
    • Legal Terms
    • Patents
    • Security and Compliance
    • Contact
    Get Started
    • Start Free
    • Compare Editions
    • Online Demo - Test Drive
    • Request a Demo

    Product

    • Overview
    • TigerGraph 3.0
    • TIGERGRAPH DB
    • TIGERGRAPH CLOUD
    • GRAPHSTUDIO
    • TRY NOW

    customers

    • success stories

    RESOURCES

    • LIBRARY
    • Events
    • EDUCATION
    • BLOG
    • DEVELOPERS

    SOLUTIONS

    • SOLUTIONS
    • use cases
    • industry

    Partners

    • partner program

    company

    • Overview
    • news
    • Press Release
    • Awards

    start for free

    • Request Demo
    • take a test drive
    • SUPPORT
    • COMMUNITY
    • CONTACT
    • Copyright © 2024 TigerGraph
    • Privacy Policy
    • Linkedin
    • Twitter

    Copyright © 2020 TigerGraph | Privacy Policy

    Copyright © 2020 TigerGraph Privacy Policy

    • SUPPORT
    • COMMUNITY
    • COMPANY
    • CONTACT
    • Linkedin
    • Facebook
    • Twitter

    Copyright © 2020 TigerGraph

    Privacy Policy

    • Products
    • Solutions
    • Customers
    • Partners
    • Resources
    • Company
    • START FREE
    START FOR FREE
    START FOR FREE
    TigerGraph
    PRODUCT
    PRODUCT
    • Overview
    • GraphStudio UI
    • Graph Data Science Library
    TIGERGRAPH DB
    • Overview
    • Features
    • GSQL Query Language
    TIGERGRAPH CLOUD
    • Overview
    • Cloud Starter Kits
    TRY TIGERGRAPH
    • Get Started for Free
    • Compare Editions
    SOLUTIONS
    SOLUTIONS
    • Why Graph?
    use cases
    • Benefits
    • Product & Service Marketing
    • Entity Resolution
    • Customer Journey/360
    • Recommendation Engine
    • Anti-Money Laundering (AML)
    • Cybersecurity Threat Detection
    • Fraud Detection
    • Risk Assessment & Monitoring
    • Energy Management
    • Network Resources Optimization
    • Supply Chain Analysis
    • AI & Machine Learning
    • Geospatial Analysis
    • Time Series Analysis
    industry
    • Advertising, Media & Entertainment
    • Financial Services
    • Healthcare & Life Sciences
    CUSTOMERS
    read all success stories


    PARTNERS
    Partner program
    • Partner Benefits
    • TigerGraph Partners
    • Sign Up
    RESOURCES
    LIBRARY
    • Resource Library
    • Benchmark
    • Webinars
    Events
    • Trade Shows
    • Graph + AI Summit
    • Graph for All - Million Dollar Challenge
    EDUCATION
    • TigerGraph Academy
    • Certification
    Blog
    • TigerGraph Blog
    DEVELOPERS
    • Developers Hub
    • Community Forum
    • Documentation
    • Ecosystem
    COMPANY
    COMPANY
    • Overview
    • Leadership
    • Careers  
    NEWS
    PRESS RELEASE
    AWARDS
    START FREE
    Start Free
    • Request a Demo
    • SUPPORT
    • COMMUNITY
    • CONTACT
    Dr. Jay Yu

    Dr. Jay Yu | VP of Product and Innovation

    Dr. Jay Yu is the VP of Product and Innovation at TigerGraph, responsible for driving product strategy and roadmap, as well as fostering innovation in graph database engine and graph solutions. He is a proven hands-on full-stack innovator, strategic thinker, leader, and evangelist for new technology and product, with 25+ years of industry experience ranging from highly scalable distributed database engine company (Teradata), B2B e-commerce services startup, to consumer-facing financial applications company (Intuit). He received his PhD from the University of Wisconsin - Madison, where he specialized in large scale parallel database systems

    Todd Blaschka | COO

    Todd Blaschka is a veteran in the enterprise software industry. He is passionate about creating entirely new segments in data, analytics and AI, with the distinction of establishing graph analytics as a Gartner Top 10 Data & Analytics trend two years in a row. By fervently focusing on critical industry and customer challenges, the companies under Todd's leadership have delivered significant quantifiable results to the largest brands in the world through channel and solution sales approach. Prior to TigerGraph, Todd led go to market and customer experience functions at Clustrix (acquired by MariaDB), Dataguise and IBM.