Skip to content
START FOR FREE
START FOR FREE
  • SUPPORT
  • COMMUNITY
  • CONTACT US
  • SUPPORT
  • COMMUNITY
  • CONTACT US
MENUMENU
  • Products
    • The World’s Fastest and Most Scalable Graph Platform

      LEARN MORE

      Watch a TigerGraph Demo

      TIGERGRAPH CLOUD

      • Overview
      • TigerGraph Cloud Suite
      • FAQ
      • Pricing

      USER TOOLS

      • GraphStudio
      • Insights
      • Application Workbenches
      • Connectors and Drivers
      • Starter Kits
      • openCypher Support

      TIGERGRAPH DB

      • Overview
      • GSQL Query Language
      • Compare Editions

      GRAPH DATA SCIENCE

      • Graph Data Science Library
      • Machine Learning Workbench

      Success Plans

  • Solutions
    • The World’s Fastest and Most Scalable Graph Platform

      LEARN MORE

      Watch a TigerGraph Demo

      Solutions

      • Solutions Overview

      INCREASE REVENUE

      • Customer Journey/360
      • Product Marketing
      • Entity Resolution
      • Recommendation Engine

      MANAGE RISK

      • Fraud Detection
      • Anti-Money Laundering
      • Threat Detection
      • Risk Monitoring

      IMPROVE OPERATIONS

      • Supply Chain Analysis
      • Energy Management
      • Network Optimization

      By Industry

      • Advertising, Media & Entertainment
      • Financial Services
      • Healthcare & Life Sciences

      FOUNDATIONAL

      • AI & Machine Learning
      • Time Series Analysis
      • Geospatial Analysis
  • Customers
    • The World’s Fastest and Most Scalable Graph Platform

      LEARN MORE

      CUSTOMER SUCCESS STORIES

      • Ford
      • Intuit
      • JPMorgan Chase
      • READ MORE SUCCESS STORIES
      • Jaguar Land Rover
      • Xbox
  • Partners
    • The World’s Fastest and Most Scalable Graph Platform

      LEARN MORE

      PARTNER PROGRAM

      • Partner Benefits
      • TigerGraph Partners
      • Sign Up
      TigerGraph partners with organizations that offer complementary technology solutions and services.​
  • Resources
    • The World’s Fastest and Most Scalable Graph Platform

      LEARN MORE

      BLOG

      • TigerGraph Blog

      RESOURCES

      • Resource Library
      • Benchmarks
      • Demos
      • O'Reilly Graph + ML Book

      EVENTS & WEBINARS

      • Events &Trade Shows
      • Webinars

      DEVELOPERS

      • Documentation
      • Ecosystem
      • Developers Hub
      • Community Forum

      SUPPORT

      • Contact Support
      • Production Guidelines

      EDUCATION

      • Training & Certifications
  • Company
    • Join the World’s Fastest and Most Scalable Graph Platform

      WE ARE HIRING

      COMPANY

      • Company Overview
      • Leadership
      • Legal Terms
      • Patents
      • Security and Compliance

      CAREERS

      • Join Us
      • Open Positions

      AWARDS

      • Awards and Recognition
      • Leader in Forrester Wave
      • Gartner Research

      PRESS RELEASE

      • Read All Press Releases
      TigerGraph Debuts TigerGraph CoPilot for Graph-Augmented AI, New Cloud-Native Generation of TigerGraph Cloud, and Solution Kits
      April 30, 2024
      Read More »

      NEWS

      • Read All News

      Best paper award at International Conference on Very Large Data Bases

      New TigerGraph CEO Refocuses Efforts on Enterprise Customers

  • START FREE
    • The World’s Fastest and Most Scalable Graph Platform

      GET STARTED

      • Request a Demo
      • CONTACT US
      • Try TigerGraph
      • START FREE
      • TRY AN ONLINE DEMO

Optimized Counting of Common Neighbors/Vertices in GSQL

  • Victor Lee
  • November 17, 2023
  • blog, Engineers
  • Blog >
  • Optimized Counting of Common Neighbors/Vertices in GSQL
Optimized counting of neighbors by Prateek Agarwal

By Prateek Agrawal

Graph analytics plays a crucial role in finding hidden relationships within large datasets. One fundamental operation in this domain is calculating the number of common neighbors between pairs of vertices in a graph. This has applications in similarity measurement, link prediction, graph compression, community detection, and more.

Current multi-threaded approaches often rely on set intersection techniques or do not easily lend themselves to parallelization. In this blog post, we’ll explore:

  • An optimized algorithm for counting common neighbors that outperforms the set intersection method.
  • How to implement this optimized algorithm in GSQL, a Turing-complete language.
  • A comparative performance analysis of both methods.

1.0 Counting Common Neighbors/Vertices

In a graph, vertices (also known as nodes) represent entities, and edges signify relationships between those entities. If an edge connects two vertices, we say those vertices are neighbors. If vertex C is a neighbor of vertex A, and C is also a neighbor of vertex B, we say that C is a common neighbor of A and B.

Some use cases that can utilize the common neighbors are described below:

  • Community Detection: Identifying vertices that have a high number of common neighbors can indicate that they belong to the same community or cluster within the graph.
  • Recommendation Systems: Common neighbors can be used to make recommendations. If two users in a social network have common friends, it might suggest they have shared interests.
  • Link Prediction: Analyzing common neighbors can help predict potential connections between vertices that are not directly linked yet. If two vertices share many common neighbors, there’s a higher chance they might form a direct connection in the future.
  • Graph Similarity: Comparing the sets of common neighbors between vertices can be used to measure the similarity or relatedness of vertices within the graph.

1.1 Merchant-Merchant Graph Use Case

In the use case below, we will be using a graph that captures how strongly two Merchants, represented by point-of-sale (POS) devices, are connected to each other based on common distinct credit or debit Cards that are used at both Merchants. See Figure 1 below.

merchant-merchant graph schema 
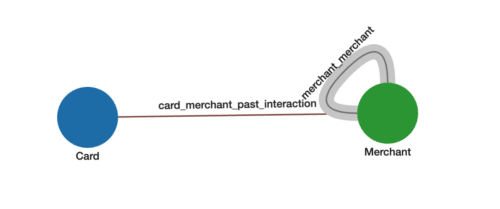
Figure 1. Merchant-to-merchant graph schema.

For the Merchant-Merchant Graph:

  • Each Merchant vertex and Card vertex represents a distinct entity
  • The edges card_merchant_past_interaction come directly from Card (shopper) to Merchant transactions.
  • The weighted edges merchant_merchant between two Merchants represents how many common Cards are shopping between the two Merchants. These edges and their weights are not in the original data but are the result of analyzing the graph. The higher number of common Cards between two Merchants, the higher the weight and stronger the connection.

If a shopper is shopping at a given Merchant, we can use the strengths of connections to predict which other merchants they are most likely to shop at (recommendation). Or this metric can also be used as a signal for fraudulent transactions (fraud detection).

The schema for our graph looks like below where card_merchant_past_interaction edges are already available to us and we want to insert merchant_merchant edges and their corresponding weight.

Figure 2 shows an example of how merchant_merchant weighted edges would be inserted. The edge weight inserted between the two Merchants is 4 because 4 cards are in common between the two Merchants:

merchant-to-merchant commonality example

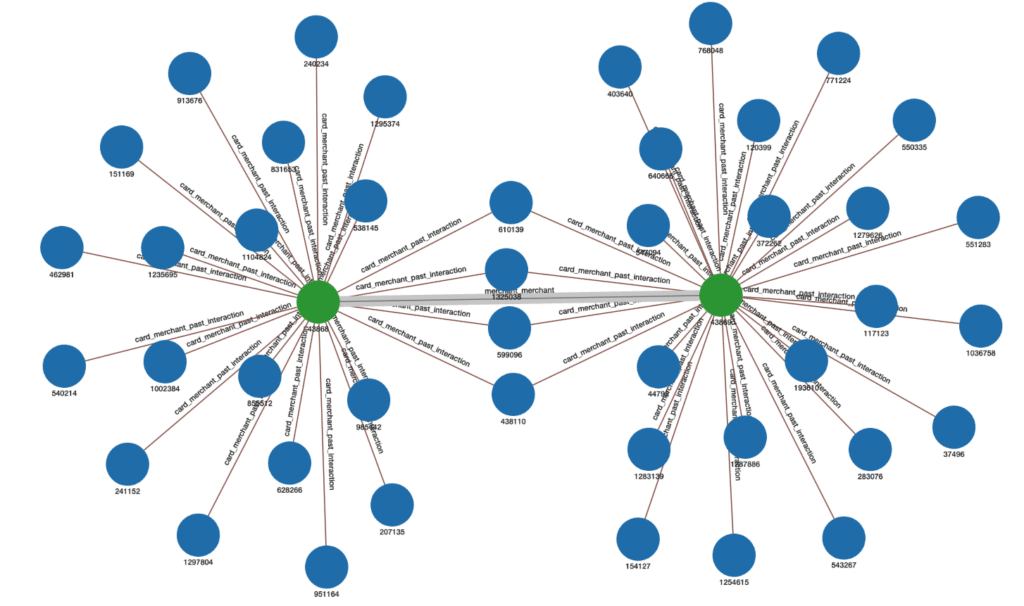
Figure 2. Example of weighted edge representing the number of common Cards between two Merchants.

2.0  Complexity Analysis and Optimization

2.1 Time Complexity of the Naive Intersection Method

To count the common neighbors (Cards in this case) between two given (Merchant) vertices A and B, we can collect the set of Card neighbors of A, those of B, and do a set intersection between the two. The time complexity for this algorithm can be determined as follows:

  1. Getting Neighbors for Vertex A and B: Retrieving the set of neighbors for a single vertex in an adjacency list representation of an undirected graph takes O(K) time, where K is the degree (number of incident edges) of the vertex. So, for vertices A and B it would take O(K_a + K_b) time to collect the sets of neighbors.
  1. Calculating Intersection: Finding the intersection of two sets with sizes n and m would generally require O(n+m) time. In our case,  n=K_a and m=K_b, the number of neighbors for vertices A and B, respectively.

Time complexity for a single pair:

Combining these steps, the time complexity to calculate the Common Neighbors for a single pair of vertices (A,B) would be O(K_a + K_b).

Time complexity for all pairs:

For calculating Common Neighbors for all possible pairs of n vertices in the graph, we would need to perform this calculation n(n-1)/2 times, leading to a worst-case time complexity of O(n2K), where K is the maximum degree in the graph.

It is possible to not count intersections for all n2 pairs. To be a common neighbor, a (Card) vertex must have at least two neighbors.  For each card, we can collect its list of neighboring Merchants and only continue to work with those having degree K ≥ 2. This takes O(nK) time. We only need to calculate the intersection between Merchants on these neighbor lists.  The worst case length of this list would be degree K. Hence the new worst case time complexity for n vertices becomes O(nK2).

2.2 Optimized Time complexity

The optimized method aims to reduce the time complexity by altering the approach to how we count the common neighbors (or “Cards”) between two vertices (or “Merchants”) A and B. Instead of creating sets of neighbors for two merchants A and B and then finding their intersection, this method uses a direct counting approach.

Consider the Example of three Cards (C1,C2,C3) and five Merchants (M1,M2,M3,M4,M5) connected as in Figure 3:

Merchant-Card graph example

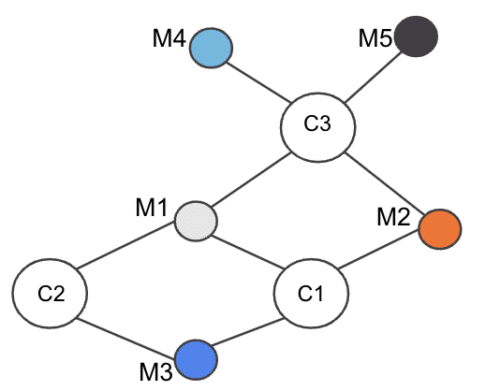
Figure 3. Merchant-Card graph example

Our objective is to find the number of common cards between each Merchant-Merchant pair.

Consider Merchant pair (M1,M3). To compute the common Cards between M1 and M3, find the set of Cards neighboring M1, i.e., S1 = {C1,C2,C3}. Next find the set of Cards neighboring M3:  S2 = {C1,C2}. Now if we run the intersection , we see the set size is 2, i.e., 2 cards are common between M1 and M3. Running for all Merchant pairs M1 to M5, we can get the edge weight for all pairs of Merchants with O(nK2) complexity.

However, instead of doing intersection for each merchant pair, we can compute the edge weight using the following steps:

  1. Find the set of all Merchants shopped at by a Card (neighbors of the Card)
  2. For each Card, get each pair of Merchants in the set and do:
    1. Add a merchant_merchant edge if it doesn’t exist, with initial weight of 0
    2. Increment edge weight by 1

So for our example above in Step 1, we find all neighbors of each Card:

  • C1 Set: (M1,M2,M3)
  • C2 Set: (M1,M3)
  • C3 Set: (M1,M2,M4,M5)

And then we iterate over each card and each Merchant pair in the set, incrementing the edge weight by 1:

  • For C1 edge weight update applied:
    • (M1,M2) += 1 → 1
    • (M2,M3) += 1 → 1
    • (M1,M3) += 1 → 1
  • For C2 edge weight update applied:
    • (M1,M3) += 1 → 2
  • For C3 edge weights update applied:
    • (M1,M2) += 1 → 2
    • (M1,M4) += 1 → 1
    • (M1,M5) += 1 → 1
    • (M2,M4) += 1 → 1
    • (M2,M5) += 1 → 1
    • (M4,M5) += 1 → 1

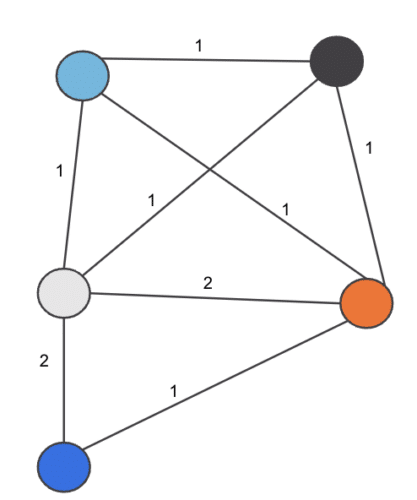
Hence the final edge_weight pairs are as shown in Figure 4:

weighted edges between merchants\

Figure 4. Weighted edges between Merchants

Hence we see from the example the time complexity  can be optimized by observing the fact that we can count the number of common vertices between two vertices instead of doing an intersection and the counting operation can be done in O(1) and hence the complexity can be reduced from O(n K2) to O(nK).

3.0 Implementation in TigerGraph Using GSQL

To execute Common Neighbors algorithms, we will utilize the TigerGraph database as our graph data storage and use GSQL for algorithm implementation. Because of TigerGraph’s distributed nature we can run the algorithm distributedly and with memory efficiency.

We will evaluate performance differences between the intersect method and the optimized approach by using the above pre-established use-case: calculating common cardholders who shop at two different merchants and then assigning a weighted edge between those merchants based on that count.

The files for building Schema/Load Data and running queries in TigerGraph are in the appendix.

3.1 Intersect method GSQL implementation:

The query below shows the implementation of the Intersection method and how to insert the merchant-merchant edges in O(nK2) time.


CREATE DISTRIBUTED QUERY _02_common_cards_intersect(
  INT min_edge_weight = 1
)
FOR GRAPH optimizing_common_neighbors {
  SetAccum @merchants;
  MapAccum<VERTEX, INT> @edge_weight;
  DATETIME before;

  cards = {Card.*};
  before=(now());
  // Collect all Merchants on the Card
  merchants = SELECT m FROM cards:c- (card_merchant_past_interaction:e) - Merchant:m
              ACCUM c.@merchants+=m; //O(M) where M= number of cards
  PRINT "Time to collection of merchants on cards ",datetime_diff(now(), before);

  // INSERT edges and weights using the INTERSECT method.
  before=(now());
  temp = SELECT m FROM merchants:m -(card_merchant_past_interaction:e)- Card:c
          ACCUM
            FOREACH merc IN c.@merchants DO // O(N*K) where N =number of Merchants and K= Max degree of Card
              IF getvid(m) < getvid(merc) THEN
                tg_common_neighbors(m,merc,min_edge_weight) //O(K_a+K_b) where K_a and K_b are the degrees of the merchant pair
              END
            END; //Total complexity O(N*K*(K_a+K_b))=O(N.K^2)
  PRINT "Time to INSERT edges using intersect method",datetime_diff(now(), before);
}

The sub-query tg_common_neighbors called in the above query does the actual intersection in O(K_a + K_b) time.
Below is the sub query logic:


//Intersect subquery
CREATE QUERY tg_common_neighbors(
  VERTEX v_source,
  VERTEX v_target,
  INT min_edge_weight
)
FOR GRAPH optimizing_common_neighbors {
  avs = {v_source};
  bvs = {v_target};
  INT sz;
  na = SELECT n
       FROM avs -(card_merchant_past_interaction:e)- :n;

  nb = SELECT n
       FROM bvs -(card_merchant_past_interaction:e)- :n;

  # Get neighbors in common for source and target and compute the common neighbors
  u = na INTERSECT nb;
  sz=u.size();

  # Insert edge only if the weight is >= min_edge_weight
  IF sz >= min_edge_weight THEN
    INSERT INTO merchant_merchant (FROM ,TO ,weight) VALUES (v_source,v_target,sz) ;
  END;
}

3.2 Optimized Common Neighbors implementation

For optimization we simply replace the intersect sub query tg_common_neighbors by counting the edge weight for each merchant-merchant vertex pair and hence reduce the complexity to O(K).


CREATE DISTRIBUTED QUERY _02_common_cards_optimized(
  INT min_edge_weight = 1
) 
FOR GRAPH optimizing_common_neighbors { 
  SetAccum @merchants;
  MapAccum<VERTEX, INT> @edge_weight;
  DATETIME before;
  
  cards = {Card.*};
  before=(now());
  // Collect all Merchants on the Card
  merchants = SELECT m FROM cards:c- (card_merchant_past_interaction:e) - Merchant:m
              ACCUM c.@merchants+=m; //O(M) where M= number of cards
  PRINT "Time to collection of merchants on cards ",datetime_diff(now(), before);
  
  // Establish logical edges an summed weights 
  before=(now());
  temp = SELECT m FROM merchants:m -(card_merchant_past_interaction:e)- Card:c
          ACCUM
            FOREACH merc IN c.@merchants DO // O(N*K) where N =number of Merchants and K= Max degree of Card
              IF getvid(m) < getvid(merc) THEN m.@edge_weight += (merc -> 1) //O(1)
              END
            END; //Total complexity O(N*K*1)=O(N.K)
  PRINT "Time to establish merchant-merchant edges using optimized common neighbors ",datetime_diff(now(), before);
  
  // Insert edges
  before=(now());  
  temp = SELECT m FROM merchants:m
          POST-ACCUM
            FOREACH (merc, w) IN m.@edge_weight DO
              IF w >= min_edge_weight THEN                 // Insert edge only if the weight is >= min_edge_weight
                  INSERT INTO merchant_merchant VALUES (m, merc, w)
              END
            END;
  PRINT "Time to INSERT merchant-merchant edges  ",datetime_diff(now(), before); 
}

4. Performance Comparison

For comparing the performance of the two algorithms the data metrics and hardware being used are as follows:

Data Metrics:

Table 1: test graph size statistics
MetricCount
All Vertices1,807,672
All Edges6,872,163
Vertex “Card”1,335,486
Vertex “Merchant”472,186
Edge “card_merchant_past_interaction”6,872,163
Edge “merchant_merchant”0


Raw Data size = 95.1MB.

The final count of “merchant_merchant” edges inserted is 20,607,316.

Hardware Configuration:

2 x TG.C16.M64 TigerGraph Cloud instances (16 CPUs, 64GB Memory)

The following Table captures the performance of the two algorithms.

Table 2: Speed comparison of two common neighbor methods
MetricIntersection MethodOptimized Method Notes
Execution Time (Seconds)3517.4923.33153x Speed improvement
Peak Memory Usage (GB)8.12.14x Memory reduction

Lorem ipsum dolor sit amet, consectetur adipiscing elit. Ut elit tellus, luctus nec ullamcorper mattis, pulvinar dapibus leo.

5.0 Conclusion

The optimized algorithm significantly outperforms the intersection-based approach, not just in speed but also in memory efficiency. TigerGraph’s GSQL enables users to tailor algorithms to their specific needs, offering unparalleled flexibility and scalability. For additional examples of graph algorithms implemented in GSQL, please refer to our Graph Data Science Library.

Appendix

Solution that can be run in GSQL shell Notebook to create Schema/Load_data/install queries Graph Data File for Card-Merchant Edges If you’re interested in exploring how TigerGraph can open up new dimensions with your data, you can sign up for a free instance of TigerGraph Cloud at tgcloud.io or contact us at info@localhost.

You Might Also Like

Graph Developer Proficiency Rating

Graph Developer Proficiency Rating

June 16, 2024
Supply Chain Digital Twins Enable Analytics and Resiliency

Supply Chain Digital Twins Enable Analytics...

May 29, 2024
Putting the Customer First: The Power of the Empty Chair

Putting the Customer First: The Power...

May 17, 2024

Victor Lee

TigerGraph Blog

  • Categories
    • blogs
      • Customer 360
      • Cybersecurity
      • Developers
      • Digital Twin
      • Engineers
      • Fraud / Anti-Money Laundering
      • GQL
      • GSQL
      • Supply Chain
      • TigerGraph
      • TigerGraph Cloud
    • Graph AI On Demand
      • Customer Spotlight
      • Digital Transformation, Management, & Strategy
      • Finance, Banking, Insurance
      • Graph + AI
      • Graph Algorithms
      • Retail, Manufacturing, and Supply Chain
    • RulesEngine
    • Video
  • Recent Posts

    • Graph Developer Proficiency Rating
    • Supply Chain Digital Twins Enable Analytics and Resiliency
    • Welcome to ENGAGE 2024!
    • Putting the Customer First: The Power of the Empty Chair
    • Join TigerGraph at ENGAGE 2024: Advancing Financial Crime Solutions
    TigerGraph

    Product

    SOLUTIONS

    customers

    RESOURCES

    start for free

    TIGERGRAPH DB
    • Overview
    • Features
    • GSQL Query Language
    GRAPH DATA SCIENCE
    • Graph Data Science Library
    • Machine Learning Workbench
    TIGERGRAPH CLOUD
    • Overview
    • Cloud Starter Kits
    • Login
    • FAQ
    • Pricing
    • Cloud Marketplaces
    USEr TOOLS
    • GraphStudio
    • TigerGraph Insights
    • Application Workbenches
    • Connectors and Drivers
    • Starter Kits
    • openCypher Support
    SOLUTIONS
    • Why Graph?
    industry
    • Advertising, Media & Entertainment
    • Financial Services
    • Healthcare & Life Sciences
    use cases
    • Benefits
    • Product & Service Marketing
    • Entity Resolution
    • Customer 360/MDM
    • Recommendation Engine
    • Anti-Money Laundering
    • Cybersecurity Threat Detection
    • Fraud Detection
    • Risk Assessment & Monitoring
    • Energy Management
    • Network & IT Management
    • Supply Chain Analysis
    • AI & Machine Learning
    • Geospatial Analysis
    • Time Series Analysis
    success stories
    • Customer Success Stories

    Partners

    Partner program
    • Partner Benefits
    • TigerGraph Partners
    • Sign Up
    LIBRARY
    • Resources
    • Benchmark
    • Webinars
    Events
    • Trade Shows
    • Graph + AI Summit
    • Million Dollar Challenge
    EDUCATION
    • Training & Certifications
    Blog
    • TigerGraph Blog
    DEVELOPERS
    • Developers Hub
    • Community Forum
    • Documentation
    • Ecosystem

    COMPANY

    Company
    • Overview
    • Careers
    • News
    • Press Release
    • Awards
    • Legal Terms
    • Patents
    • Security and Compliance
    • Contact
    Get Started
    • Start Free
    • Compare Editions
    • Online Demo - Test Drive
    • Request a Demo

    Product

    • Overview
    • TigerGraph 3.0
    • TIGERGRAPH DB
    • TIGERGRAPH CLOUD
    • GRAPHSTUDIO
    • TRY NOW

    customers

    • success stories

    RESOURCES

    • LIBRARY
    • Events
    • EDUCATION
    • BLOG
    • DEVELOPERS

    SOLUTIONS

    • SOLUTIONS
    • use cases
    • industry

    Partners

    • partner program

    company

    • Overview
    • news
    • Press Release
    • Awards

    start for free

    • Request Demo
    • take a test drive
    • SUPPORT
    • COMMUNITY
    • CONTACT
    • Copyright © 2024 TigerGraph
    • Privacy Policy
    • Linkedin
    • Twitter

    Copyright © 2020 TigerGraph | Privacy Policy

    Copyright © 2020 TigerGraph Privacy Policy

    • SUPPORT
    • COMMUNITY
    • COMPANY
    • CONTACT
    • Linkedin
    • Facebook
    • Twitter

    Copyright © 2020 TigerGraph

    Privacy Policy

    • Products
    • Solutions
    • Customers
    • Partners
    • Resources
    • Company
    • START FREE
    START FOR FREE
    START FOR FREE
    TigerGraph
    PRODUCT
    PRODUCT
    • Overview
    • GraphStudio UI
    • Graph Data Science Library
    TIGERGRAPH DB
    • Overview
    • Features
    • GSQL Query Language
    TIGERGRAPH CLOUD
    • Overview
    • Cloud Starter Kits
    TRY TIGERGRAPH
    • Get Started for Free
    • Compare Editions
    SOLUTIONS
    SOLUTIONS
    • Why Graph?
    use cases
    • Benefits
    • Product & Service Marketing
    • Entity Resolution
    • Customer Journey/360
    • Recommendation Engine
    • Anti-Money Laundering (AML)
    • Cybersecurity Threat Detection
    • Fraud Detection
    • Risk Assessment & Monitoring
    • Energy Management
    • Network Resources Optimization
    • Supply Chain Analysis
    • AI & Machine Learning
    • Geospatial Analysis
    • Time Series Analysis
    industry
    • Advertising, Media & Entertainment
    • Financial Services
    • Healthcare & Life Sciences
    CUSTOMERS
    read all success stories


    PARTNERS
    Partner program
    • Partner Benefits
    • TigerGraph Partners
    • Sign Up
    RESOURCES
    LIBRARY
    • Resource Library
    • Benchmark
    • Webinars
    Events
    • Trade Shows
    • Graph + AI Summit
    • Graph for All - Million Dollar Challenge
    EDUCATION
    • TigerGraph Academy
    • Certification
    Blog
    • TigerGraph Blog
    DEVELOPERS
    • Developers Hub
    • Community Forum
    • Documentation
    • Ecosystem
    COMPANY
    COMPANY
    • Overview
    • Leadership
    • Careers  
    NEWS
    PRESS RELEASE
    AWARDS
    START FREE
    Start Free
    • Request a Demo
    • SUPPORT
    • COMMUNITY
    • CONTACT
    Dr. Jay Yu

    Dr. Jay Yu | VP of Product and Innovation

    Dr. Jay Yu is the VP of Product and Innovation at TigerGraph, responsible for driving product strategy and roadmap, as well as fostering innovation in graph database engine and graph solutions. He is a proven hands-on full-stack innovator, strategic thinker, leader, and evangelist for new technology and product, with 25+ years of industry experience ranging from highly scalable distributed database engine company (Teradata), B2B e-commerce services startup, to consumer-facing financial applications company (Intuit). He received his PhD from the University of Wisconsin - Madison, where he specialized in large scale parallel database systems

    Todd Blaschka | COO

    Todd Blaschka is a veteran in the enterprise software industry. He is passionate about creating entirely new segments in data, analytics and AI, with the distinction of establishing graph analytics as a Gartner Top 10 Data & Analytics trend two years in a row. By fervently focusing on critical industry and customer challenges, the companies under Todd's leadership have delivered significant quantifiable results to the largest brands in the world through channel and solution sales approach. Prior to TigerGraph, Todd led go to market and customer experience functions at Clustrix (acquired by MariaDB), Dataguise and IBM.