Skip to content
START FOR FREE
START FOR FREE
  • SUPPORT
  • COMMUNITY
  • CONTACT US
  • SUPPORT
  • COMMUNITY
  • CONTACT US
MENUMENU
  • Products
    • The World’s Fastest and Most Scalable Graph Platform

      LEARN MORE

      Watch a TigerGraph Demo

      TIGERGRAPH CLOUD

      • Overview
      • TigerGraph Cloud Suite
      • FAQ
      • Pricing

      USER TOOLS

      • GraphStudio
      • Insights
      • Application Workbenches
      • Connectors and Drivers
      • Starter Kits
      • openCypher Support

      TIGERGRAPH DB

      • Overview
      • GSQL Query Language
      • Compare Editions

      GRAPH DATA SCIENCE

      • Graph Data Science Library
      • Machine Learning Workbench

      Success Plans

  • Solutions
    • The World’s Fastest and Most Scalable Graph Platform

      LEARN MORE

      Watch a TigerGraph Demo

      Solutions

      • Solutions Overview

      INCREASE REVENUE

      • Customer Journey/360
      • Product Marketing
      • Entity Resolution
      • Recommendation Engine

      MANAGE RISK

      • Fraud Detection
      • Anti-Money Laundering
      • Threat Detection
      • Risk Monitoring

      IMPROVE OPERATIONS

      • Supply Chain Analysis
      • Energy Management
      • Network Optimization

      By Industry

      • Advertising, Media & Entertainment
      • Financial Services
      • Healthcare & Life Sciences

      FOUNDATIONAL

      • AI & Machine Learning
      • Time Series Analysis
      • Geospatial Analysis
  • Customers
    • The World’s Fastest and Most Scalable Graph Platform

      LEARN MORE

      CUSTOMER SUCCESS STORIES

      • Ford
      • Intuit
      • JPMorgan Chase
      • READ MORE SUCCESS STORIES
      • Jaguar Land Rover
      • Xbox
  • Partners
    • The World’s Fastest and Most Scalable Graph Platform

      LEARN MORE

      PARTNER PROGRAM

      • Partner Benefits
      • TigerGraph Partners
      • Sign Up
      TigerGraph partners with organizations that offer complementary technology solutions and services.​
  • Resources
    • The World’s Fastest and Most Scalable Graph Platform

      LEARN MORE

      BLOG

      • TigerGraph Blog

      RESOURCES

      • Resource Library
      • Benchmarks
      • Demos
      • O'Reilly Graph + ML Book

      EVENTS & WEBINARS

      • Events &Trade Shows
      • Webinars

      DEVELOPERS

      • Documentation
      • Ecosystem
      • Developers Hub
      • Community Forum

      SUPPORT

      • Contact Support
      • Production Guidelines

      EDUCATION

      • Training & Certifications
  • Company
    • Join the World’s Fastest and Most Scalable Graph Platform

      WE ARE HIRING

      COMPANY

      • Company Overview
      • Leadership
      • Legal Terms
      • Patents
      • Security and Compliance

      CAREERS

      • Join Us
      • Open Positions

      AWARDS

      • Awards and Recognition
      • Leader in Forrester Wave
      • Gartner Research

      PRESS RELEASE

      • Read All Press Releases
      TigerGraph Debuts TigerGraph CoPilot for Graph-Augmented AI, New Cloud-Native Generation of TigerGraph Cloud, and Solution Kits
      April 30, 2024
      Read More »

      NEWS

      • Read All News

      Best paper award at International Conference on Very Large Data Bases

      New TigerGraph CEO Refocuses Efforts on Enterprise Customers

  • START FREE
    • The World’s Fastest and Most Scalable Graph Platform

      GET STARTED

      • Request a Demo
      • CONTACT US
      • Try TigerGraph
      • START FREE
      • TRY AN ONLINE DEMO

How Is Graph Database Used to Combat Money Laundering? ~ by Mingxi Wu, CEO, TigerGraph

  • Julia Astashkina
  • July 3, 2023
  • blog, blogs, Fraud / Anti-Money Laundering
  • Blog >
  • How Is Graph Database Used to Combat Money Laundering? ~ by Mingxi Wu, CEO, TigerGraph

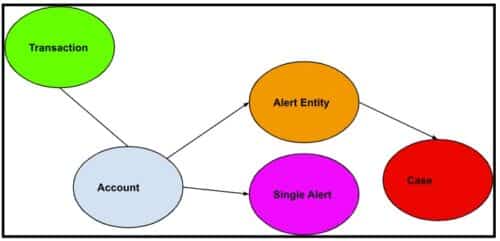
Figure 1: AML generic workflow. 

Financial accounts are linked to many transactions. Alert entities are suspicious accounts that are presented to fraud analysts, who can further put alert entities into a case study container.

Introduction

In the world of finance, preventing money laundering is of paramount importance. This blog aims to provide insights into how financial institutions implement Anti-Money Laundering (AML) practices using graph databases. By examining the relationship between commercial accounts, consumer accounts, and their associated financial transactions, we can better understand the steps involved in combating money laundering.

We also observe that although AML software is subject to compliance regulations, its impact on the financial institutions’ overall revenue may not be direct. However, it is worth mentioning that the same techniques and frameworks employed in AML software can be effectively utilized to identify instances of fraud and minimize the number of false positives encountered by fraud analysts. This, in turn, alleviates the workload on analysts and leads to significant operational cost savings for financial institutions.

Accounts and Transactions

Financial institutions serve both commercial and consumer customers, each having their respective accounts (blue node). These accounts are linked to numerous financial transactions (green node), including deposits, withdrawals, money transfers, and more. By analyzing these transactions, institutions can identify suspicious activities indicative of money laundering.

Steps to Combat Money Laundering

1.Run an entity resolution algorithm on all accounts based on common address, common phone, common ssn etc. to detect identical or similar accounts and merge them into one entity.  


Note: This step is easy in TigerGraph GSQL, but not easy by relational database or Neo4j Cypher.  This is a graph clustering algorithm problem, GSQL’s accumulator makes it easy. 

2. After grouping all accounts, the transactions of each account group will be used to generate single alerts (pink node). Each alert means some rules are violated. Common rules are:

  • Does the account have a transaction that has been marked as fraudulent?
  • Does the account reside in a group whose group size is 100 or above? Looks like a non-human natural setup!
  • Does the account have international wire transfer (inbound or outbound) passing a threshold? Red flag!
     

Note: This is a 1-hop aggregate query, it check each account’s transactions, and insert into the graph a “single alert” node, and connect the newly created node with the account node. GSQL supports insertion of nodes and edges.

3. Based on the generated alerts, risk scores are calculated for each account group. These risk scores provide an overall indication of the associated risk level. If an account group’s risk score exceeds a predefined threshold, an “Alert Entity” node is created. Such entities are subjected to thorough scrutiny by alert analysts. Alert analysts can further create a “case” node to group a set of related alert entities. 

Note: This is a 1-hop aggregate query, it check and aggregate each account’s single alerts, and insert into the graph “Alert entity” node, and connect the newly created node with the account node. GSQL supports insertion of node and edges.  

4. Case analysts can further examine the case for further fraud study. 

Why Graph Database

Entity resolution is easier. Fraudulent users have finite physical resources– IP, device, residential address, SSN etc. By grouping accounts based on those finite resources, we can find suspicious account groups that are artificially manipulated by fraudsters. Graph database can naturally run a weakly connected component algorithm or other unsupervised cluster algorithms to find such account groups, which is hard in relational database. 

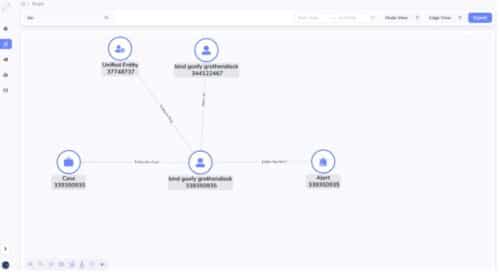
Avoid ad hoc joins. Graph storage format is just a better way to manage data. Why? Essentially, unlike relational databases which do runtime join to connect table rows at a per query basis, graph database obviate the runtime join for all queries. Instead, graph database materialize all joins at loading time. When you finish the initial data ingestion, or you do incremental data ingestion, each insertion materialize a relationship. At runtime, you just traverse the edge (relationship) for a source to a target, you never need to do a join for two vertices that you know they have a relationship. For example, in step 2 above, if you use a graph database, you just aggregate all transactions following the edges from the transactions to their linked accounts. But in relational databases, you need to join the transaction table with the account table to achieve this. In step 3 and 4 above, when alert entity or case are presented to the fraud analysts, they will double click the alert entity or the case, which brings them to a graph (network) exploration panel, the alert entity’s 1-hop neighborhood will be unfold on the screen (no join for graph database here, but will trigger a runtime join for relational database query engine), and the analysts can continue her ad hoc double click to investigate the traces of the alert entity, 3-hop, 4-hop etc., all have not join cost for graph database, but a join cost for relational database. In other words, graph database storage is just smarter, in that it can avoid repetitive runtime joins by materializing joins as edges. It is just greener for the planet.

Why TigerGraph

Scalability: transactions are large, can be 500G to 10T. TigerGaph has been proven to be capable to handle 100T challenging multi-hop queries. 

Performance: MPP architecture can do this AML flow parallelly for all accounts. It’s a data mining problem involves both unsupervised clustering and semi-supervised rule filters. You need to examine each account and its transactions. 

Advanced Aggregation support from Query Language: GSQL query language’s accumulator ingredient makes this ad-hoc vertex-centric aggregation easy. I don’t see how other query languages can do this. The closest one may be SQL stored procedure, but it’s not as good as an accumulator since graph query is vertex oriented, we need to leave side-effects (runtime attributes) on vertices for later iteration examination. 

Mutability: TigerGraph allows queries to insert nodes and edges. This makes alert and case generation possible. 

Contact

If you need to see an AML demo, please contact us here info@localhost. 

You Might Also Like

Graph Developer Proficiency Rating

Graph Developer Proficiency Rating

June 16, 2024
Supply Chain Digital Twins Enable Analytics and Resiliency

Supply Chain Digital Twins Enable Analytics...

May 29, 2024
Putting the Customer First: The Power of the Empty Chair

Putting the Customer First: The Power...

May 17, 2024

Julia Astashkina

TigerGraph Blog

  • Categories
    • blogs
      • Customer 360
      • Cybersecurity
      • Developers
      • Digital Twin
      • Engineers
      • Fraud / Anti-Money Laundering
      • GQL
      • GSQL
      • Supply Chain
      • TigerGraph
      • TigerGraph Cloud
    • Graph AI On Demand
      • Customer Spotlight
      • Digital Transformation, Management, & Strategy
      • Finance, Banking, Insurance
      • Graph + AI
      • Graph Algorithms
      • Retail, Manufacturing, and Supply Chain
    • RulesEngine
    • Video
  • Recent Posts

    • Graph Developer Proficiency Rating
    • Supply Chain Digital Twins Enable Analytics and Resiliency
    • Welcome to ENGAGE 2024!
    • Putting the Customer First: The Power of the Empty Chair
    • Join TigerGraph at ENGAGE 2024: Advancing Financial Crime Solutions
    TigerGraph

    Product

    SOLUTIONS

    customers

    RESOURCES

    start for free

    TIGERGRAPH DB
    • Overview
    • Features
    • GSQL Query Language
    GRAPH DATA SCIENCE
    • Graph Data Science Library
    • Machine Learning Workbench
    TIGERGRAPH CLOUD
    • Overview
    • Cloud Starter Kits
    • Login
    • FAQ
    • Pricing
    • Cloud Marketplaces
    USEr TOOLS
    • GraphStudio
    • TigerGraph Insights
    • Application Workbenches
    • Connectors and Drivers
    • Starter Kits
    • openCypher Support
    SOLUTIONS
    • Why Graph?
    industry
    • Advertising, Media & Entertainment
    • Financial Services
    • Healthcare & Life Sciences
    use cases
    • Benefits
    • Product & Service Marketing
    • Entity Resolution
    • Customer 360/MDM
    • Recommendation Engine
    • Anti-Money Laundering
    • Cybersecurity Threat Detection
    • Fraud Detection
    • Risk Assessment & Monitoring
    • Energy Management
    • Network & IT Management
    • Supply Chain Analysis
    • AI & Machine Learning
    • Geospatial Analysis
    • Time Series Analysis
    success stories
    • Customer Success Stories

    Partners

    Partner program
    • Partner Benefits
    • TigerGraph Partners
    • Sign Up
    LIBRARY
    • Resources
    • Benchmark
    • Webinars
    Events
    • Trade Shows
    • Graph + AI Summit
    • Million Dollar Challenge
    EDUCATION
    • Training & Certifications
    Blog
    • TigerGraph Blog
    DEVELOPERS
    • Developers Hub
    • Community Forum
    • Documentation
    • Ecosystem

    COMPANY

    Company
    • Overview
    • Careers
    • News
    • Press Release
    • Awards
    • Legal Terms
    • Patents
    • Security and Compliance
    • Contact
    Get Started
    • Start Free
    • Compare Editions
    • Online Demo - Test Drive
    • Request a Demo

    Product

    • Overview
    • TigerGraph 3.0
    • TIGERGRAPH DB
    • TIGERGRAPH CLOUD
    • GRAPHSTUDIO
    • TRY NOW

    customers

    • success stories

    RESOURCES

    • LIBRARY
    • Events
    • EDUCATION
    • BLOG
    • DEVELOPERS

    SOLUTIONS

    • SOLUTIONS
    • use cases
    • industry

    Partners

    • partner program

    company

    • Overview
    • news
    • Press Release
    • Awards

    start for free

    • Request Demo
    • take a test drive
    • SUPPORT
    • COMMUNITY
    • CONTACT
    • Copyright © 2024 TigerGraph
    • Privacy Policy
    • Linkedin
    • Twitter

    Copyright © 2020 TigerGraph | Privacy Policy

    Copyright © 2020 TigerGraph Privacy Policy

    • SUPPORT
    • COMMUNITY
    • COMPANY
    • CONTACT
    • Linkedin
    • Facebook
    • Twitter

    Copyright © 2020 TigerGraph

    Privacy Policy

    • Products
    • Solutions
    • Customers
    • Partners
    • Resources
    • Company
    • START FREE
    START FOR FREE
    START FOR FREE
    TigerGraph
    PRODUCT
    PRODUCT
    • Overview
    • GraphStudio UI
    • Graph Data Science Library
    TIGERGRAPH DB
    • Overview
    • Features
    • GSQL Query Language
    TIGERGRAPH CLOUD
    • Overview
    • Cloud Starter Kits
    TRY TIGERGRAPH
    • Get Started for Free
    • Compare Editions
    SOLUTIONS
    SOLUTIONS
    • Why Graph?
    use cases
    • Benefits
    • Product & Service Marketing
    • Entity Resolution
    • Customer Journey/360
    • Recommendation Engine
    • Anti-Money Laundering (AML)
    • Cybersecurity Threat Detection
    • Fraud Detection
    • Risk Assessment & Monitoring
    • Energy Management
    • Network Resources Optimization
    • Supply Chain Analysis
    • AI & Machine Learning
    • Geospatial Analysis
    • Time Series Analysis
    industry
    • Advertising, Media & Entertainment
    • Financial Services
    • Healthcare & Life Sciences
    CUSTOMERS
    read all success stories


    PARTNERS
    Partner program
    • Partner Benefits
    • TigerGraph Partners
    • Sign Up
    RESOURCES
    LIBRARY
    • Resource Library
    • Benchmark
    • Webinars
    Events
    • Trade Shows
    • Graph + AI Summit
    • Graph for All - Million Dollar Challenge
    EDUCATION
    • TigerGraph Academy
    • Certification
    Blog
    • TigerGraph Blog
    DEVELOPERS
    • Developers Hub
    • Community Forum
    • Documentation
    • Ecosystem
    COMPANY
    COMPANY
    • Overview
    • Leadership
    • Careers  
    NEWS
    PRESS RELEASE
    AWARDS
    START FREE
    Start Free
    • Request a Demo
    • SUPPORT
    • COMMUNITY
    • CONTACT
    Dr. Jay Yu

    Dr. Jay Yu | VP of Product and Innovation

    Dr. Jay Yu is the VP of Product and Innovation at TigerGraph, responsible for driving product strategy and roadmap, as well as fostering innovation in graph database engine and graph solutions. He is a proven hands-on full-stack innovator, strategic thinker, leader, and evangelist for new technology and product, with 25+ years of industry experience ranging from highly scalable distributed database engine company (Teradata), B2B e-commerce services startup, to consumer-facing financial applications company (Intuit). He received his PhD from the University of Wisconsin - Madison, where he specialized in large scale parallel database systems

    Todd Blaschka | COO

    Todd Blaschka is a veteran in the enterprise software industry. He is passionate about creating entirely new segments in data, analytics and AI, with the distinction of establishing graph analytics as a Gartner Top 10 Data & Analytics trend two years in a row. By fervently focusing on critical industry and customer challenges, the companies under Todd's leadership have delivered significant quantifiable results to the largest brands in the world through channel and solution sales approach. Prior to TigerGraph, Todd led go to market and customer experience functions at Clustrix (acquired by MariaDB), Dataguise and IBM.