


A Look at How the Financial Software Leader Overcame Key Challenges to Realize the True Benefits of Graph by Uri Lapidot, Senior Product Manager.
Graph-based technologies are key to highlighting what would otherwise be hidden relationships, patterns, and insights. As part of Intuit’s transformation to an AI-driven expert platform company, the 38-year-old organization — which serves small businesses, self-employed workers, and consumers — doubled down on graph to maximize customer confidence and reduce risk. Intuit’s risk team’s primary goal is to make the platform a trusted place for customers to transact and manage finance.
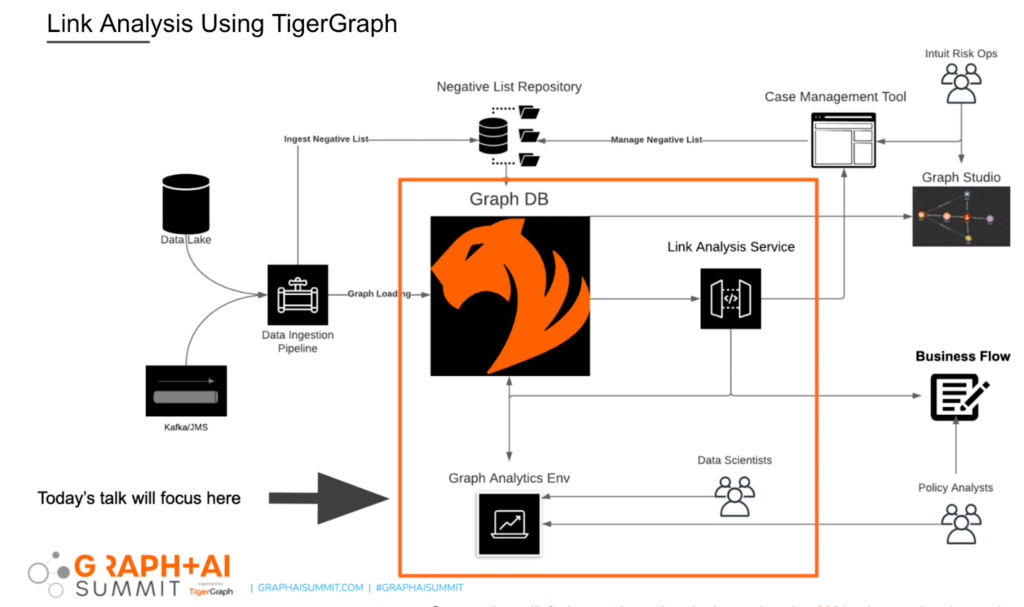
Intuit’s risk and fraud team worked to integrate machine learning with graph databases for a graph-based AI approach that would prevent fraud at scale. In other words, suspicious patterns would be detected before customers (and their money) were impacted. Given Intuit’s shift to an AI-driven fraud and risk platform, most of our risk mitigation controls are based on ML models. We implemented a graph database system to reflect our customer relationships and detect suspicious activity. Specifically, we aimed to use graph insights to link fraudulent entities in our ML/AI models to turbocharge our fraud and risk controls, reduce fraud across multiple checkpoints in our end-to-end ecosystem, and improve the customer experience.
Upping the Ante with Graph
Graph-based features bring a new perspective to the fraud prediction game. Adding graph features to fraud detection models would allow us to detect delicate fraud patterns. Classic ML features include “aggregations” such as count of payments from the same device within 30 days, “ratios” – the number of fraud payments divided by the number of legitimate payments from the same device,or “raw features,” like a geolocation mismatch between an IP address and a zip code. None of these three examples refers to relationships between entities, and this is where graph features come into play.
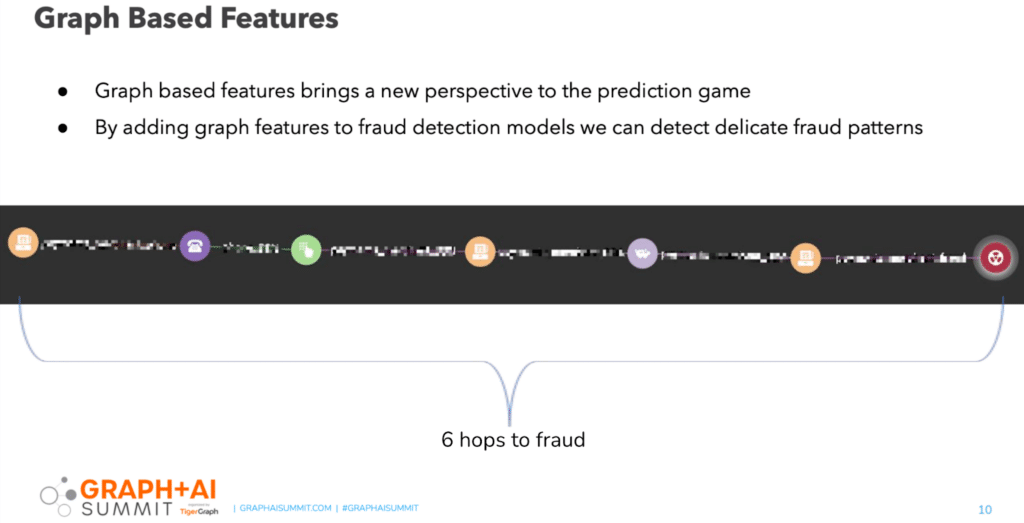
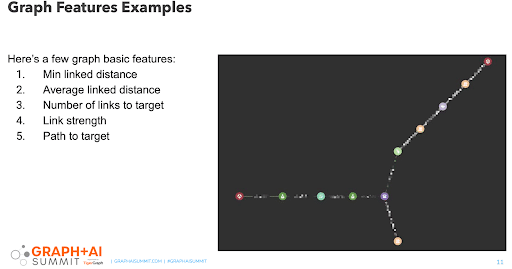
An example of a graph-based feature: “link to fraud in six hops.” Other graph-based features include minimum-linked distance (even with multiple paths, we would locate one with minimal number of hops), average-linked distance, number of links to target, link strength, and path to target. There are many insights we can gain from querying a graph database, which pushed us to serve graph-based features to our models.
In terms of putting our graph goals into practice — specifically, working to combine ML models with graph-based input — we anticipated and planned for two key challenges. We knew that with an AI/ML classic model development flow, a data scientist can explore features and develop them using Python or SQL to query a relational database. Once a feature is developed, training datasets can be generated by calculating historical feature values. This is simple in a classic model scenario, as data exists for any given event, and any feature value can be calculated for any point in time. Conversely, a graph-based features development flow is more difficult — especially the initial two steps.
The first challenge: How do you enable data scientists to explore and develop graph-based features without having to train them on GSQL syntax?
When you write a graph-based policy such as, “find a link between entity A and B in a maximum of four hops,” this is simple logic to implement. However, when it comes to ML model features, you must allow data scientists to develop features for more complicated scenarios. In our case, we needed to enable data scientists to explore and develop graph-based features without using a GSQL syntax.
The catch: How can you derive the benefits of GSQL without needing to learn the GSQL language? Our engineering team recognized that although GSQL is not a common syntax, GraphQL is common. The team implemented an abstraction layer that takes GraphQL syntax as input and then translates functions to GSQL code. Once a data scientist defines a feature and then tests it using a GraphQL UI, he can then make an HTTP call from any Intuit service and get the feature results in real time.
The second challenge: Once you have developed a feature, how do you produce point-in-time simulations of relationships to allow historical graph-based features for model training and testing?
Intuit’s graph is constantly being updated and continually changing. For us to train models using graph-based features, we need to reflect each relationship status as it was at any given point in time. Think of a time machine. We want the ability to simulate relationship status at any given point in time to generate historical feature values using a batch query system. We learned that this ability was not a nice-to-have, but a must-have. If we can’t calculate historical features values, we can’t use graph insights for our models.
We refer to a change in graph as an “addition” or “removal” of a graph edge. We implemented a start date and end date on any edge in the graph. Consider this scenario: We have User A who changes his bank account from Bank 1 to Bank 2 on January 20. We then see a payment from User B processed on January 15 using Bank 2. In that case, B and A are not connected, because Bank 2 was added to User A on January 20. But if that same transaction happened on January 21, we have a link between user A and user B.
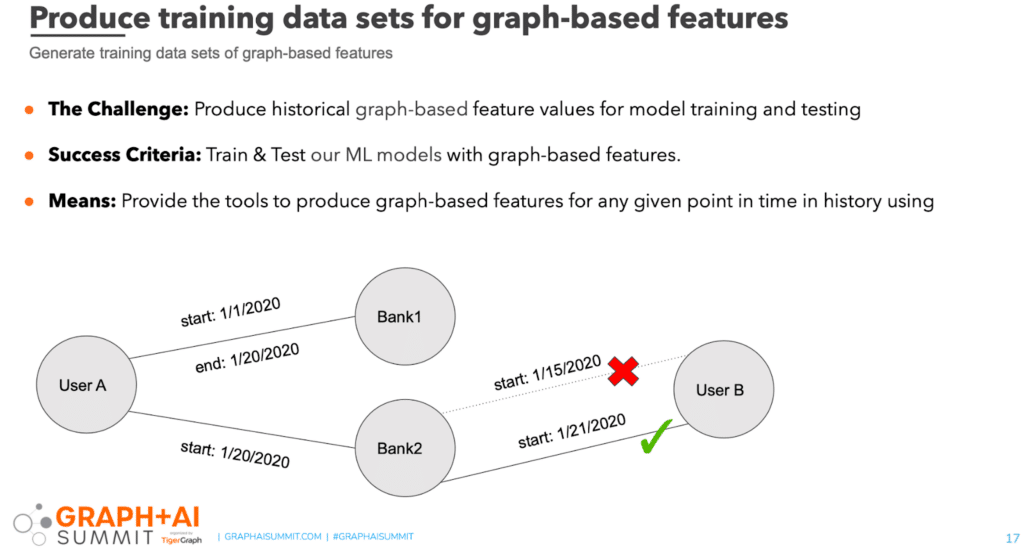
To support this point-in-time simulation, you must apply start and end dates on every edge within the graph. You must also implement the right logic in your GSQL queries. Then, when a query traverses through the graph, it refers to the date and time for the source entity while ignoring relationships that didn’t exist at that point in time. This process addressed the historical features simulation challenge.
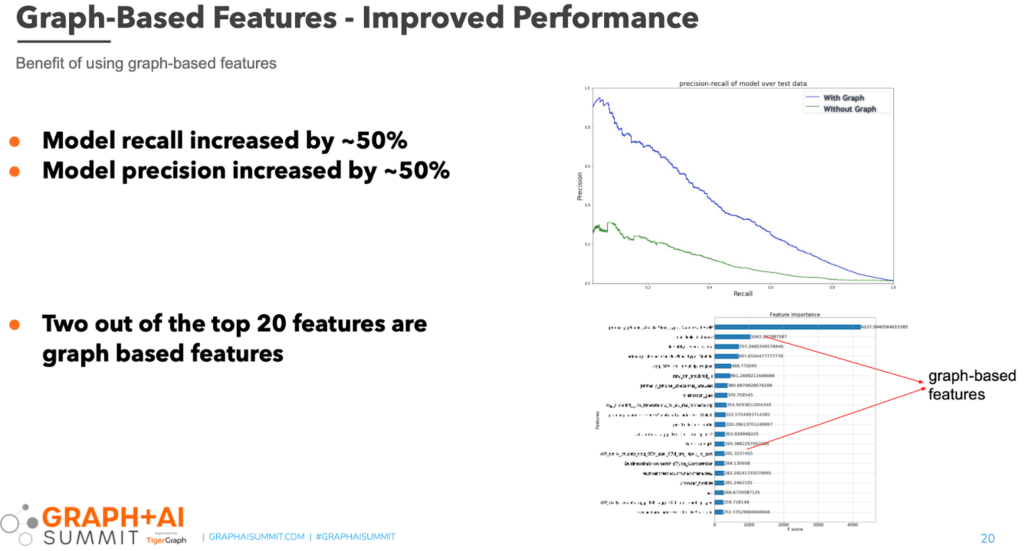
Now that both challenges were solved, what risk management benefits did Intuit see? Our fraud detection model detected 50% more risk events and our model precision improved by 50% — where the majority of this performance boost is due to graph-based features. We led multiple design sessions with customers to fine-tune the solution, and we continue to iterate, adjust, and update as needed. We consider graph to be a game-changing technology, and we plan to develop more graph-based offerings in the future.
Learn more about Intuit’s industry-leading deployment of Graph and AI with this session from Graph + AI Summit Spring 2021.


