Skip to content
START FOR FREE
START FOR FREE
  • SUPPORT
  • COMMUNITY
  • CONTACT US
  • SUPPORT
  • COMMUNITY
  • CONTACT US
MENUMENU
  • Products
    • The World’s Fastest and Most Scalable Graph Platform

      LEARN MORE

      Watch a TigerGraph Demo

      TIGERGRAPH CLOUD

      • Overview
      • TigerGraph Cloud Suite
      • FAQ
      • Pricing

      USER TOOLS

      • GraphStudio
      • Insights
      • Application Workbenches
      • Connectors and Drivers
      • Starter Kits
      • openCypher Support

      TIGERGRAPH DB

      • Overview
      • GSQL Query Language
      • Compare Editions

      GRAPH DATA SCIENCE

      • Graph Data Science Library
      • Machine Learning Workbench

      Success Plans

  • Solutions
    • The World’s Fastest and Most Scalable Graph Platform

      LEARN MORE

      Watch a TigerGraph Demo

      Solutions

      • Solutions Overview

      INCREASE REVENUE

      • Customer Journey/360
      • Product Marketing
      • Entity Resolution
      • Recommendation Engine

      MANAGE RISK

      • Fraud Detection
      • Anti-Money Laundering
      • Threat Detection
      • Risk Monitoring

      IMPROVE OPERATIONS

      • Supply Chain Analysis
      • Energy Management
      • Network Optimization

      By Industry

      • Advertising, Media & Entertainment
      • Financial Services
      • Healthcare & Life Sciences

      FOUNDATIONAL

      • AI & Machine Learning
      • Time Series Analysis
      • Geospatial Analysis
  • Customers
    • The World’s Fastest and Most Scalable Graph Platform

      LEARN MORE

      CUSTOMER SUCCESS STORIES

      • Ford
      • Intuit
      • JPMorgan Chase
      • READ MORE SUCCESS STORIES
      • Jaguar Land Rover
      • Xbox
  • Partners
    • The World’s Fastest and Most Scalable Graph Platform

      LEARN MORE

      PARTNER PROGRAM

      • Partner Benefits
      • TigerGraph Partners
      • Sign Up
      TigerGraph partners with organizations that offer complementary technology solutions and services.​
  • Resources
    • The World’s Fastest and Most Scalable Graph Platform

      LEARN MORE

      BLOG

      • TigerGraph Blog

      RESOURCES

      • Resource Library
      • Benchmarks
      • Demos
      • O'Reilly Graph + ML Book

      EVENTS & WEBINARS

      • Events &Trade Shows
      • Webinars

      DEVELOPERS

      • Documentation
      • Ecosystem
      • Developers Hub
      • Community Forum

      SUPPORT

      • Contact Support
      • Production Guidelines

      EDUCATION

      • Training & Certifications
  • Company
    • Join the World’s Fastest and Most Scalable Graph Platform

      WE ARE HIRING

      COMPANY

      • Company Overview
      • Leadership
      • Legal Terms
      • Patents
      • Security and Compliance

      CAREERS

      • Join Us
      • Open Positions

      AWARDS

      • Awards and Recognition
      • Leader in Forrester Wave
      • Gartner Research

      PRESS RELEASE

      • Read All Press Releases
      TigerGraph Debuts TigerGraph CoPilot for Graph-Augmented AI, New Cloud-Native Generation of TigerGraph Cloud, and Solution Kits
      April 30, 2024
      Read More »

      NEWS

      • Read All News

      Best paper award at International Conference on Very Large Data Bases

      New TigerGraph CEO Refocuses Efforts on Enterprise Customers

  • START FREE
    • The World’s Fastest and Most Scalable Graph Platform

      GET STARTED

      • Request a Demo
      • CONTACT US
      • Try TigerGraph
      • START FREE
      • TRY AN ONLINE DEMO

Integrating TigerGraph and Large Language Models for Generative AI

  • Parker Erickson
  • August 10, 2023
  • blog
  • Blog >
  • Integrating TigerGraph and Large Language Models for Generative AI

by Parker Erickson

Introduction to Large Language Models

Generative AI and Large Language Models are on everyone’s mind – they have been proven to be very useful tools for general purpose information found on the internet. However, businesses are left with the question: how can they ask questions about their data? What if they want a question answered about John Doe’s different financial opportunities given their account status? What if a doctor wants to bounce ideas off of a digital assistant surrounding what care path best fits Maria’s needs and prior health history? Organizations need to enable LLMs to reason with sensitive data that can never be incorporated into a training dataset due to the risk of leaking sensitive information. Additionally, LLMs need ground-truth facts in order to provide correct answers.

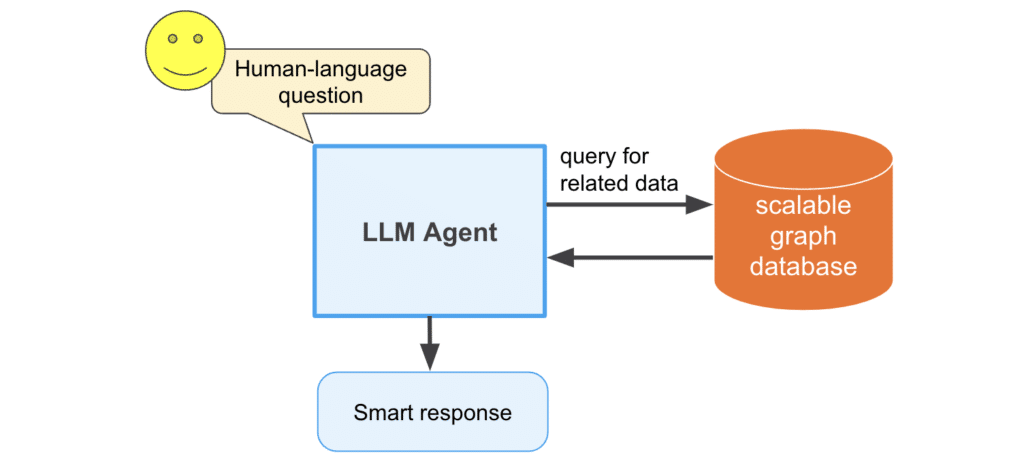
So how does the financial analyst or the doctor get their answers? The LLM has to retrieve information from a source of ground-truth data, and reason with that data passed to it. Maybe one could hypothesize passing all of John’s account statements or Maria’s clinical notes to the model, and it would figure it out, but unfortunately this is not the case. Since LLMs are neural networks, they operate on a fixed-size input. That means that users are limited by how much data they can pass into the model at a time, known as a context length. Another way to put this is LLMs have a limited number of tokens that they can take at once. Additionally, LLM API providers such as OpenAI charge businesses by their token usage, and therefore businesses want to limit the amount of data they pass to the model, and still get high quality results. This is where highly scalable, deduplicated, and relationship-rich external data sources come in – LLMs can reason and interact with these data sources in a token-efficient manner by calling APIs to get the exact data they need to answer the question, rather than a customer’s entire history.

LangChain to DB architecture

Question-Answering LLM Agent – Graph Data General Architecture

When talking about highly scalable, relationship-rich, and generally deduplicated data sources, graph databases usually come to mind. TigerGraph specifically has the capability to scale beyond 10s of TBs, and many of our customers deduplicate their data via entity resolution algorithms run within the database. Graphs in general naturally fit the relationship-rich data that LLMs can reason very well with. Additionally, TigerGraph allows for the scalable execution of graph algorithms that can abstract questions such as the influence or communities of entities within the database. The next question is, how can we link the power of TigerGraph with these LLM agents?

Integrate LLMs with TigerGraph With LangChain

LangChain is a Python library that integrates Large Language Models (LLMs) such as OpenAI’s GPT models and Google’s BARD models, among others. There are many benefits to linking a natural language interface to graph databases such as TigerGraph, as the agent’s response can include data retrieved from the database, ensuring the model has up-to-date information. This reduces the chances of these model’s responses to be inaccurate, known as hallucination.

In this demo, we are going to integrate LangChain with the Python driver of TigerGraph, pyTigerGraph. We will build up various LangChain tools in order for the LLMs to best extract the information from the database. For the full code, check out the notebook here: https://github.com/tigergraph/graph-ml-notebooks/blob/main/applications/large_language_models/TigerGraph_LangChain_Demo.ipynb.

LangChain Tools

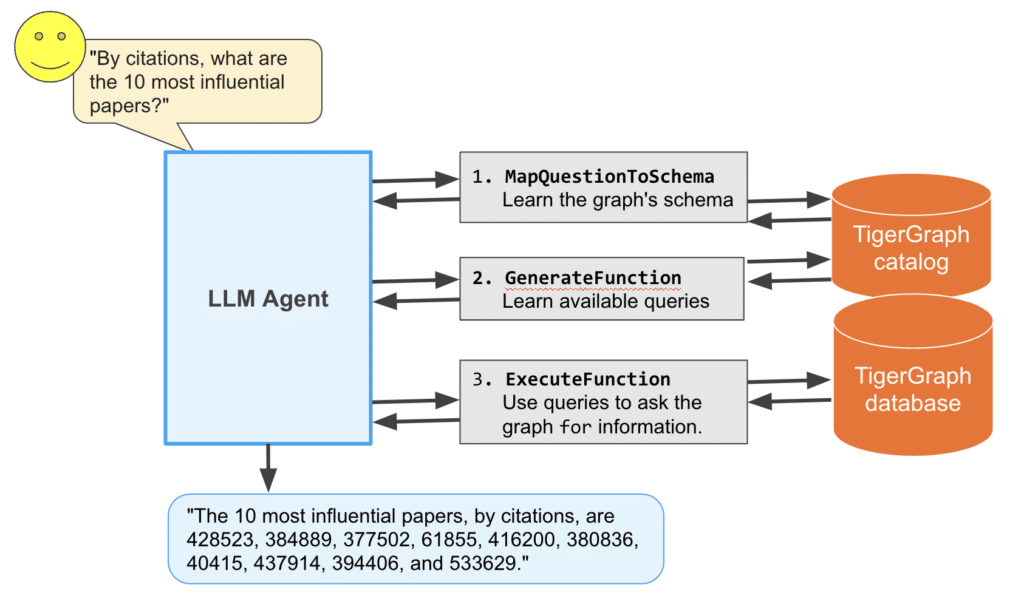
LangChain allows LLMs to interact with the “real-world” through things known as tools. By creating new LangChain tools, developers can connect various data sources into the LLM’s environment, reducing the number of hallucinations and allowing them to answer questions whose answers were not present in their training datasets. In the accompanying notebook, you can see three tools built for interacting with TigerGraph: MapQuestionToSchema, GenerateFunction, and ExecuteFunction.

Agent Workflow

LangChain wraps a LLM into an agent, which can reason and perform sequences of tasks on its own. In this case of integration with the database, the same general flow of execution is performed by the agent regardless of the question asked of it. First, the question is mapped to the graph’s schema using the tool MapQuestionToSchema. Then, the standardized question is passed to the GenerateFunction tool which populates the correct pyTigerGraph function call to run on the database. Finally, that function call is run in the ExecuteFunction tool. This returns the JSON response from the database’s REST endpoints, which is then parsed by the agent and states the answer in natural English.

Langchain - TigerGraph data flow

Question-Answering LLM Agent – TigerGraph Pipeline

The MapQuestionToSchema and GenerateFunction tools actually use another LLM call within their execution. MapQuestionToSchema asks a LLM to translate the user’s question to utilize standard schema elements. For example, if there is a vertex type of “Institution” and the user asks “How many universities are there?”, the tool will return the question “How many Institution vertices are there?” The LLM within the tool automatically converts synonyms of schema elements into their normalized form. GenerateFunction then uses another LLM to create the pyTigerGraph function call. Continuing the example, the question “How many Institution vertices are there?” will then be converted to “getVertexCount(“Institution”)”, which is the valid pyTigerGraph function to count the number of institutions in the graph. This output is then executed in the ExecuteFunction tool.

Example Questions (and Answers)

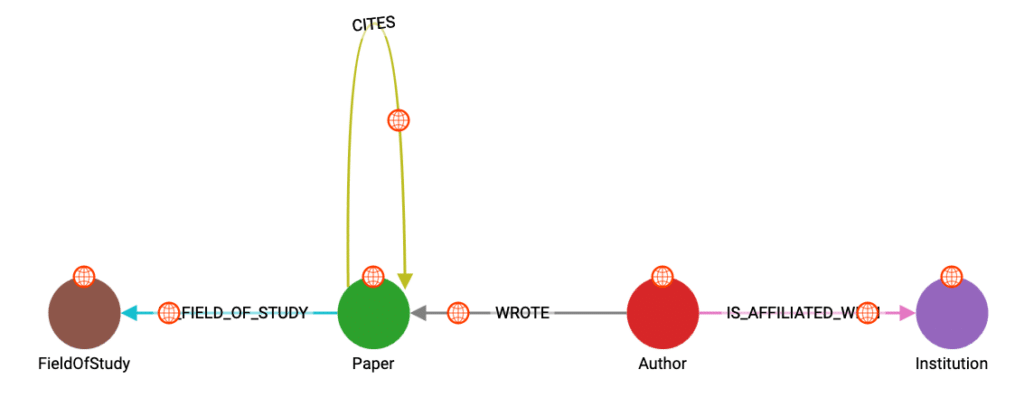
Using the OGB MAG dataset, we can ask the LangChain agent questions about the data. The schema includes information about papers, authors, topics, and institutions, with the relationships shown in the schema below.

paper citation schema

We are going to start with some simple ones, such as asking how many papers are in the data:


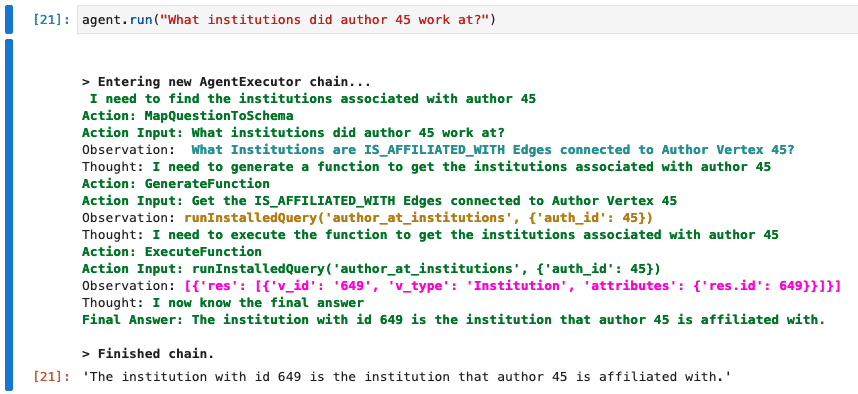
When more complex queries and algorithms are installed, we can start asking more questions about how entities interact with each other in the graph.


We can even ask an abstract question such as the most influential papers:

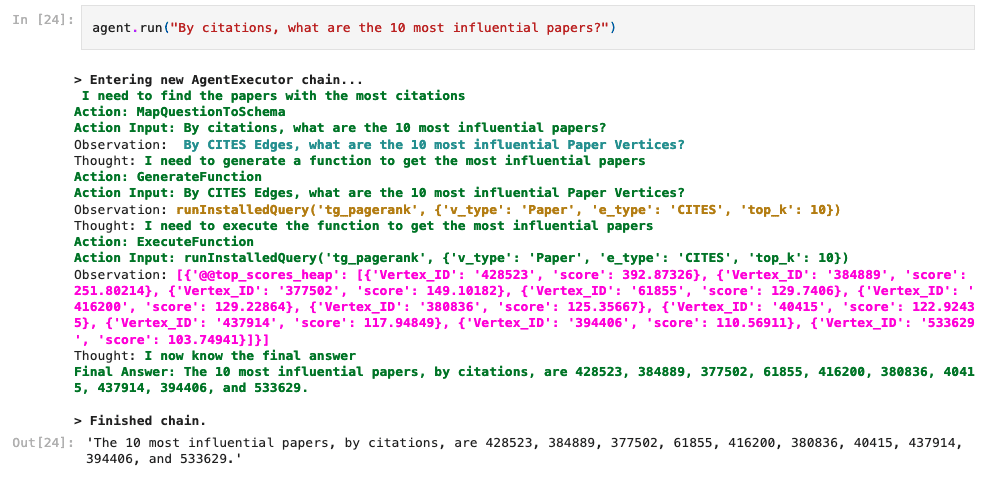
The agent recognizes that PageRank is a query available to it and that it is a measure of influence. Then, it calls it like any other query and returns the results!

Conclusion

Integrating LLMs and TigerGraph combine the best of both worlds: the reasoning and natural language capabilities of LLMs enabled by up-to-date and rich data representations provided by TigerGraph. Through the data’s representation in a graph format, the LLM can answer very complex and abstract questions, such as: find the most influential research papers, or detect a community of bad actors in a financial graph. This integration opens the door to enabling business analysts to be more productive and have richer information at their fingertips. This demo is just the beginning though; stay tuned for future updates that continue to enrich the connection between natural language and TigerGraph.

Want to try this for yourself?  Get TigerGraph Cloud for Free and then add our Python library pyTigerGraph to your server.

You Might Also Like

Graph Developer Proficiency Rating

Graph Developer Proficiency Rating

June 16, 2024
Supply Chain Digital Twins Enable Analytics and Resiliency

Supply Chain Digital Twins Enable Analytics...

May 29, 2024
Putting the Customer First: The Power of the Empty Chair

Putting the Customer First: The Power...

May 17, 2024

Parker Erickson

TigerGraph Blog

  • Categories
    • blogs
      • Customer 360
      • Cybersecurity
      • Developers
      • Digital Twin
      • Engineers
      • Fraud / Anti-Money Laundering
      • GQL
      • GSQL
      • Supply Chain
      • TigerGraph
      • TigerGraph Cloud
    • Graph AI On Demand
      • Customer Spotlight
      • Digital Transformation, Management, & Strategy
      • Finance, Banking, Insurance
      • Graph + AI
      • Graph Algorithms
      • Retail, Manufacturing, and Supply Chain
    • RulesEngine
    • Video
  • Recent Posts

    • Graph Developer Proficiency Rating
    • Supply Chain Digital Twins Enable Analytics and Resiliency
    • Welcome to ENGAGE 2024!
    • Putting the Customer First: The Power of the Empty Chair
    • Join TigerGraph at ENGAGE 2024: Advancing Financial Crime Solutions
    TigerGraph

    Product

    SOLUTIONS

    customers

    RESOURCES

    start for free

    TIGERGRAPH DB
    • Overview
    • Features
    • GSQL Query Language
    GRAPH DATA SCIENCE
    • Graph Data Science Library
    • Machine Learning Workbench
    TIGERGRAPH CLOUD
    • Overview
    • Cloud Starter Kits
    • Login
    • FAQ
    • Pricing
    • Cloud Marketplaces
    USEr TOOLS
    • GraphStudio
    • TigerGraph Insights
    • Application Workbenches
    • Connectors and Drivers
    • Starter Kits
    • openCypher Support
    SOLUTIONS
    • Why Graph?
    industry
    • Advertising, Media & Entertainment
    • Financial Services
    • Healthcare & Life Sciences
    use cases
    • Benefits
    • Product & Service Marketing
    • Entity Resolution
    • Customer 360/MDM
    • Recommendation Engine
    • Anti-Money Laundering
    • Cybersecurity Threat Detection
    • Fraud Detection
    • Risk Assessment & Monitoring
    • Energy Management
    • Network & IT Management
    • Supply Chain Analysis
    • AI & Machine Learning
    • Geospatial Analysis
    • Time Series Analysis
    success stories
    • Customer Success Stories

    Partners

    Partner program
    • Partner Benefits
    • TigerGraph Partners
    • Sign Up
    LIBRARY
    • Resources
    • Benchmark
    • Webinars
    Events
    • Trade Shows
    • Graph + AI Summit
    • Million Dollar Challenge
    EDUCATION
    • Training & Certifications
    Blog
    • TigerGraph Blog
    DEVELOPERS
    • Developers Hub
    • Community Forum
    • Documentation
    • Ecosystem

    COMPANY

    Company
    • Overview
    • Careers
    • News
    • Press Release
    • Awards
    • Legal Terms
    • Patents
    • Security and Compliance
    • Contact
    Get Started
    • Start Free
    • Compare Editions
    • Online Demo - Test Drive
    • Request a Demo

    Product

    • Overview
    • TigerGraph 3.0
    • TIGERGRAPH DB
    • TIGERGRAPH CLOUD
    • GRAPHSTUDIO
    • TRY NOW

    customers

    • success stories

    RESOURCES

    • LIBRARY
    • Events
    • EDUCATION
    • BLOG
    • DEVELOPERS

    SOLUTIONS

    • SOLUTIONS
    • use cases
    • industry

    Partners

    • partner program

    company

    • Overview
    • news
    • Press Release
    • Awards

    start for free

    • Request Demo
    • take a test drive
    • SUPPORT
    • COMMUNITY
    • CONTACT
    • Copyright © 2024 TigerGraph
    • Privacy Policy
    • Linkedin
    • Twitter

    Copyright © 2020 TigerGraph | Privacy Policy

    Copyright © 2020 TigerGraph Privacy Policy

    • SUPPORT
    • COMMUNITY
    • COMPANY
    • CONTACT
    • Linkedin
    • Facebook
    • Twitter

    Copyright © 2020 TigerGraph

    Privacy Policy

    • Products
    • Solutions
    • Customers
    • Partners
    • Resources
    • Company
    • START FREE
    START FOR FREE
    START FOR FREE
    TigerGraph
    PRODUCT
    PRODUCT
    • Overview
    • GraphStudio UI
    • Graph Data Science Library
    TIGERGRAPH DB
    • Overview
    • Features
    • GSQL Query Language
    TIGERGRAPH CLOUD
    • Overview
    • Cloud Starter Kits
    TRY TIGERGRAPH
    • Get Started for Free
    • Compare Editions
    SOLUTIONS
    SOLUTIONS
    • Why Graph?
    use cases
    • Benefits
    • Product & Service Marketing
    • Entity Resolution
    • Customer Journey/360
    • Recommendation Engine
    • Anti-Money Laundering (AML)
    • Cybersecurity Threat Detection
    • Fraud Detection
    • Risk Assessment & Monitoring
    • Energy Management
    • Network Resources Optimization
    • Supply Chain Analysis
    • AI & Machine Learning
    • Geospatial Analysis
    • Time Series Analysis
    industry
    • Advertising, Media & Entertainment
    • Financial Services
    • Healthcare & Life Sciences
    CUSTOMERS
    read all success stories


    PARTNERS
    Partner program
    • Partner Benefits
    • TigerGraph Partners
    • Sign Up
    RESOURCES
    LIBRARY
    • Resource Library
    • Benchmark
    • Webinars
    Events
    • Trade Shows
    • Graph + AI Summit
    • Graph for All - Million Dollar Challenge
    EDUCATION
    • TigerGraph Academy
    • Certification
    Blog
    • TigerGraph Blog
    DEVELOPERS
    • Developers Hub
    • Community Forum
    • Documentation
    • Ecosystem
    COMPANY
    COMPANY
    • Overview
    • Leadership
    • Careers  
    NEWS
    PRESS RELEASE
    AWARDS
    START FREE
    Start Free
    • Request a Demo
    • SUPPORT
    • COMMUNITY
    • CONTACT
    Dr. Jay Yu

    Dr. Jay Yu | VP of Product and Innovation

    Dr. Jay Yu is the VP of Product and Innovation at TigerGraph, responsible for driving product strategy and roadmap, as well as fostering innovation in graph database engine and graph solutions. He is a proven hands-on full-stack innovator, strategic thinker, leader, and evangelist for new technology and product, with 25+ years of industry experience ranging from highly scalable distributed database engine company (Teradata), B2B e-commerce services startup, to consumer-facing financial applications company (Intuit). He received his PhD from the University of Wisconsin - Madison, where he specialized in large scale parallel database systems

    Todd Blaschka | COO

    Todd Blaschka is a veteran in the enterprise software industry. He is passionate about creating entirely new segments in data, analytics and AI, with the distinction of establishing graph analytics as a Gartner Top 10 Data & Analytics trend two years in a row. By fervently focusing on critical industry and customer challenges, the companies under Todd's leadership have delivered significant quantifiable results to the largest brands in the world through channel and solution sales approach. Prior to TigerGraph, Todd led go to market and customer experience functions at Clustrix (acquired by MariaDB), Dataguise and IBM.