


Everything you need to know to create your first graph database using TigerGraph’s GraphStudio
What is GraphStudio?
GraphStudio is a streamlined graphical user interface built on top of TigerGraph’s database engine. It offers an easy-to-use, no-code platform that allows anyone, regardless of their experience in database technologies, to learn about graphs.
You can read more about GraphStudio on the TigerGraph site here.
Here we’ll look at the start-to-finish process of creating a graph using GraphStudio.
Creating your first graph
Create an Account
The first step is to create a TigerGraph Cloud account. You can do this by heading to tgcloud.io and clicking Login. You should see something like this.

Now all you have to do to create your account is enter a username and password. You can also sign up using a third party like Google or LinkedIn.
Create a Solution
Once you have logged in, you’ll arrive at a homepage that looks like this
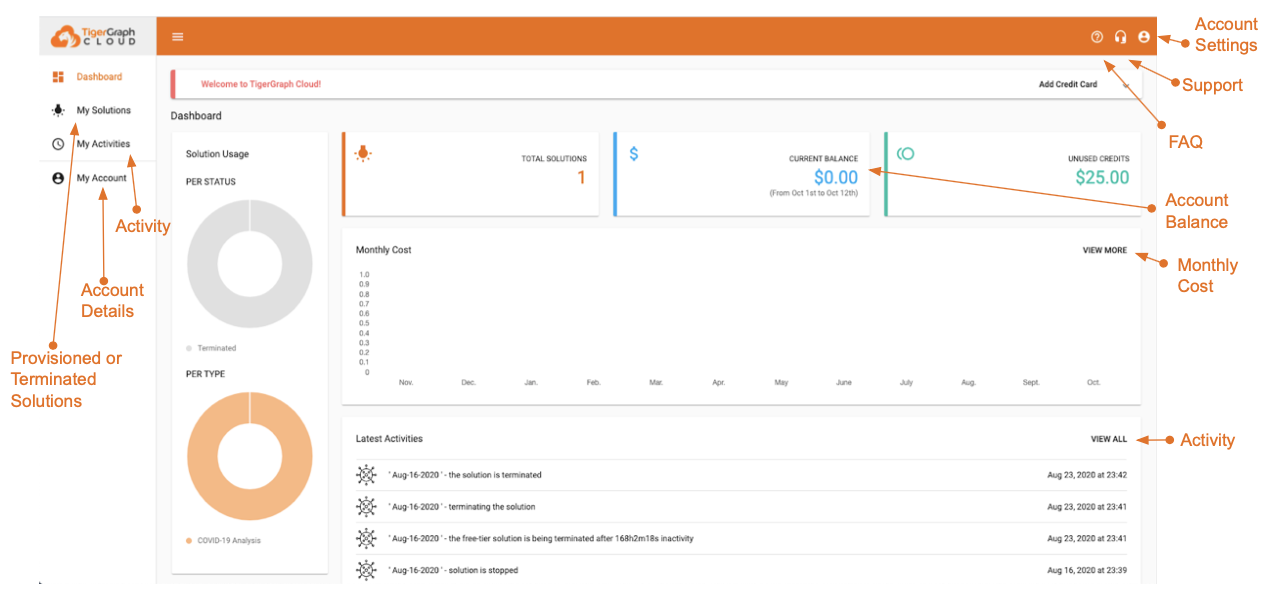
There’s a lot going on, but all we care about right now is the My Solutions tab.
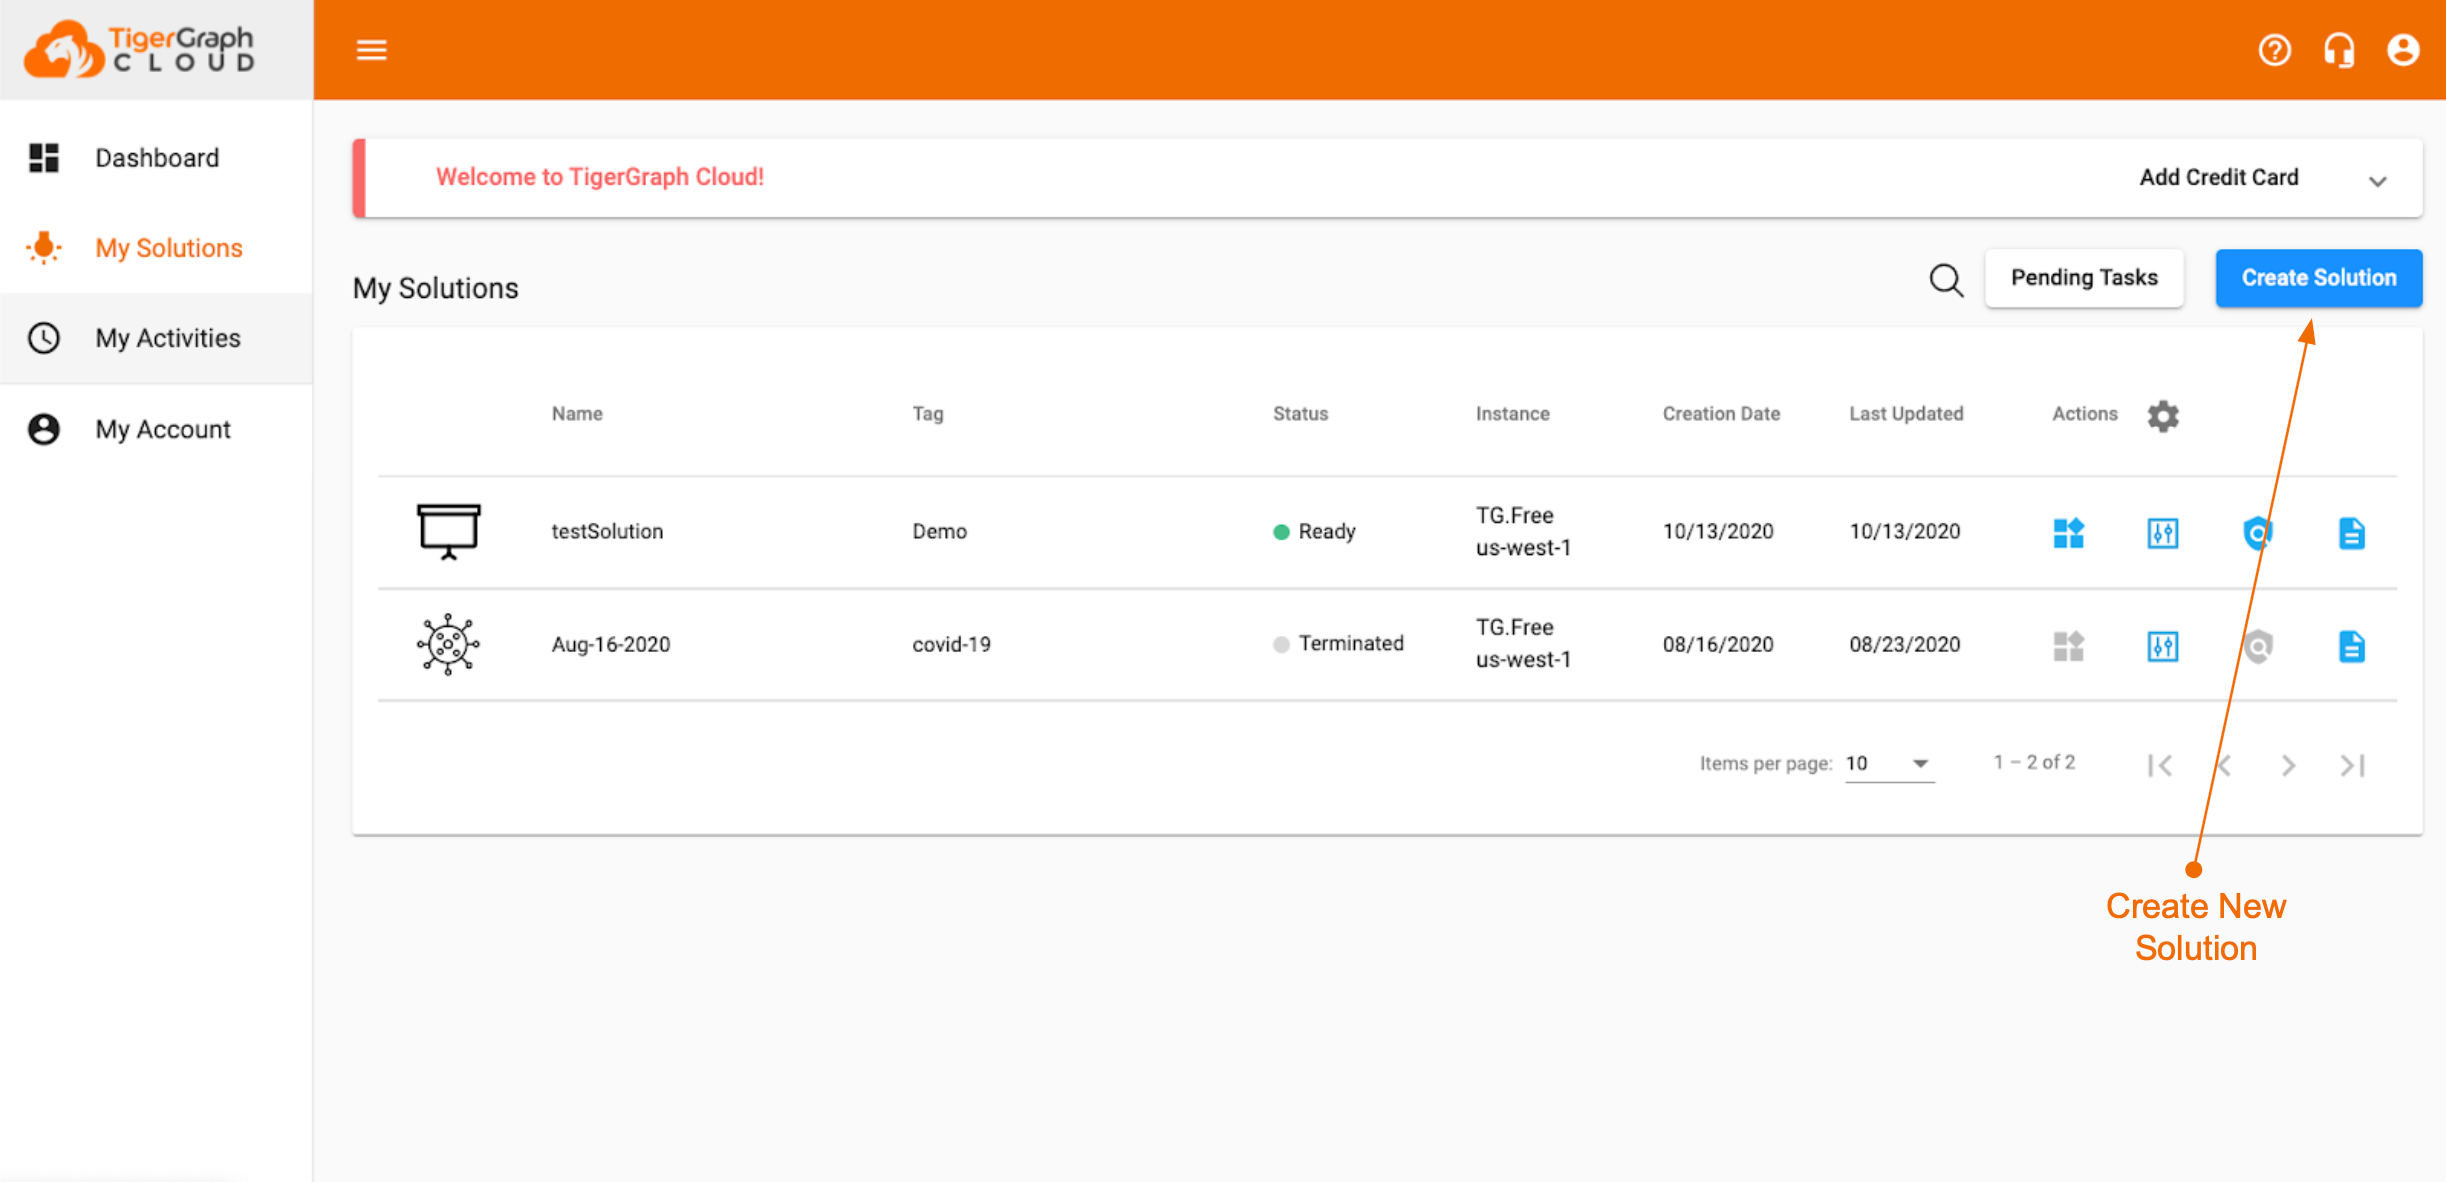
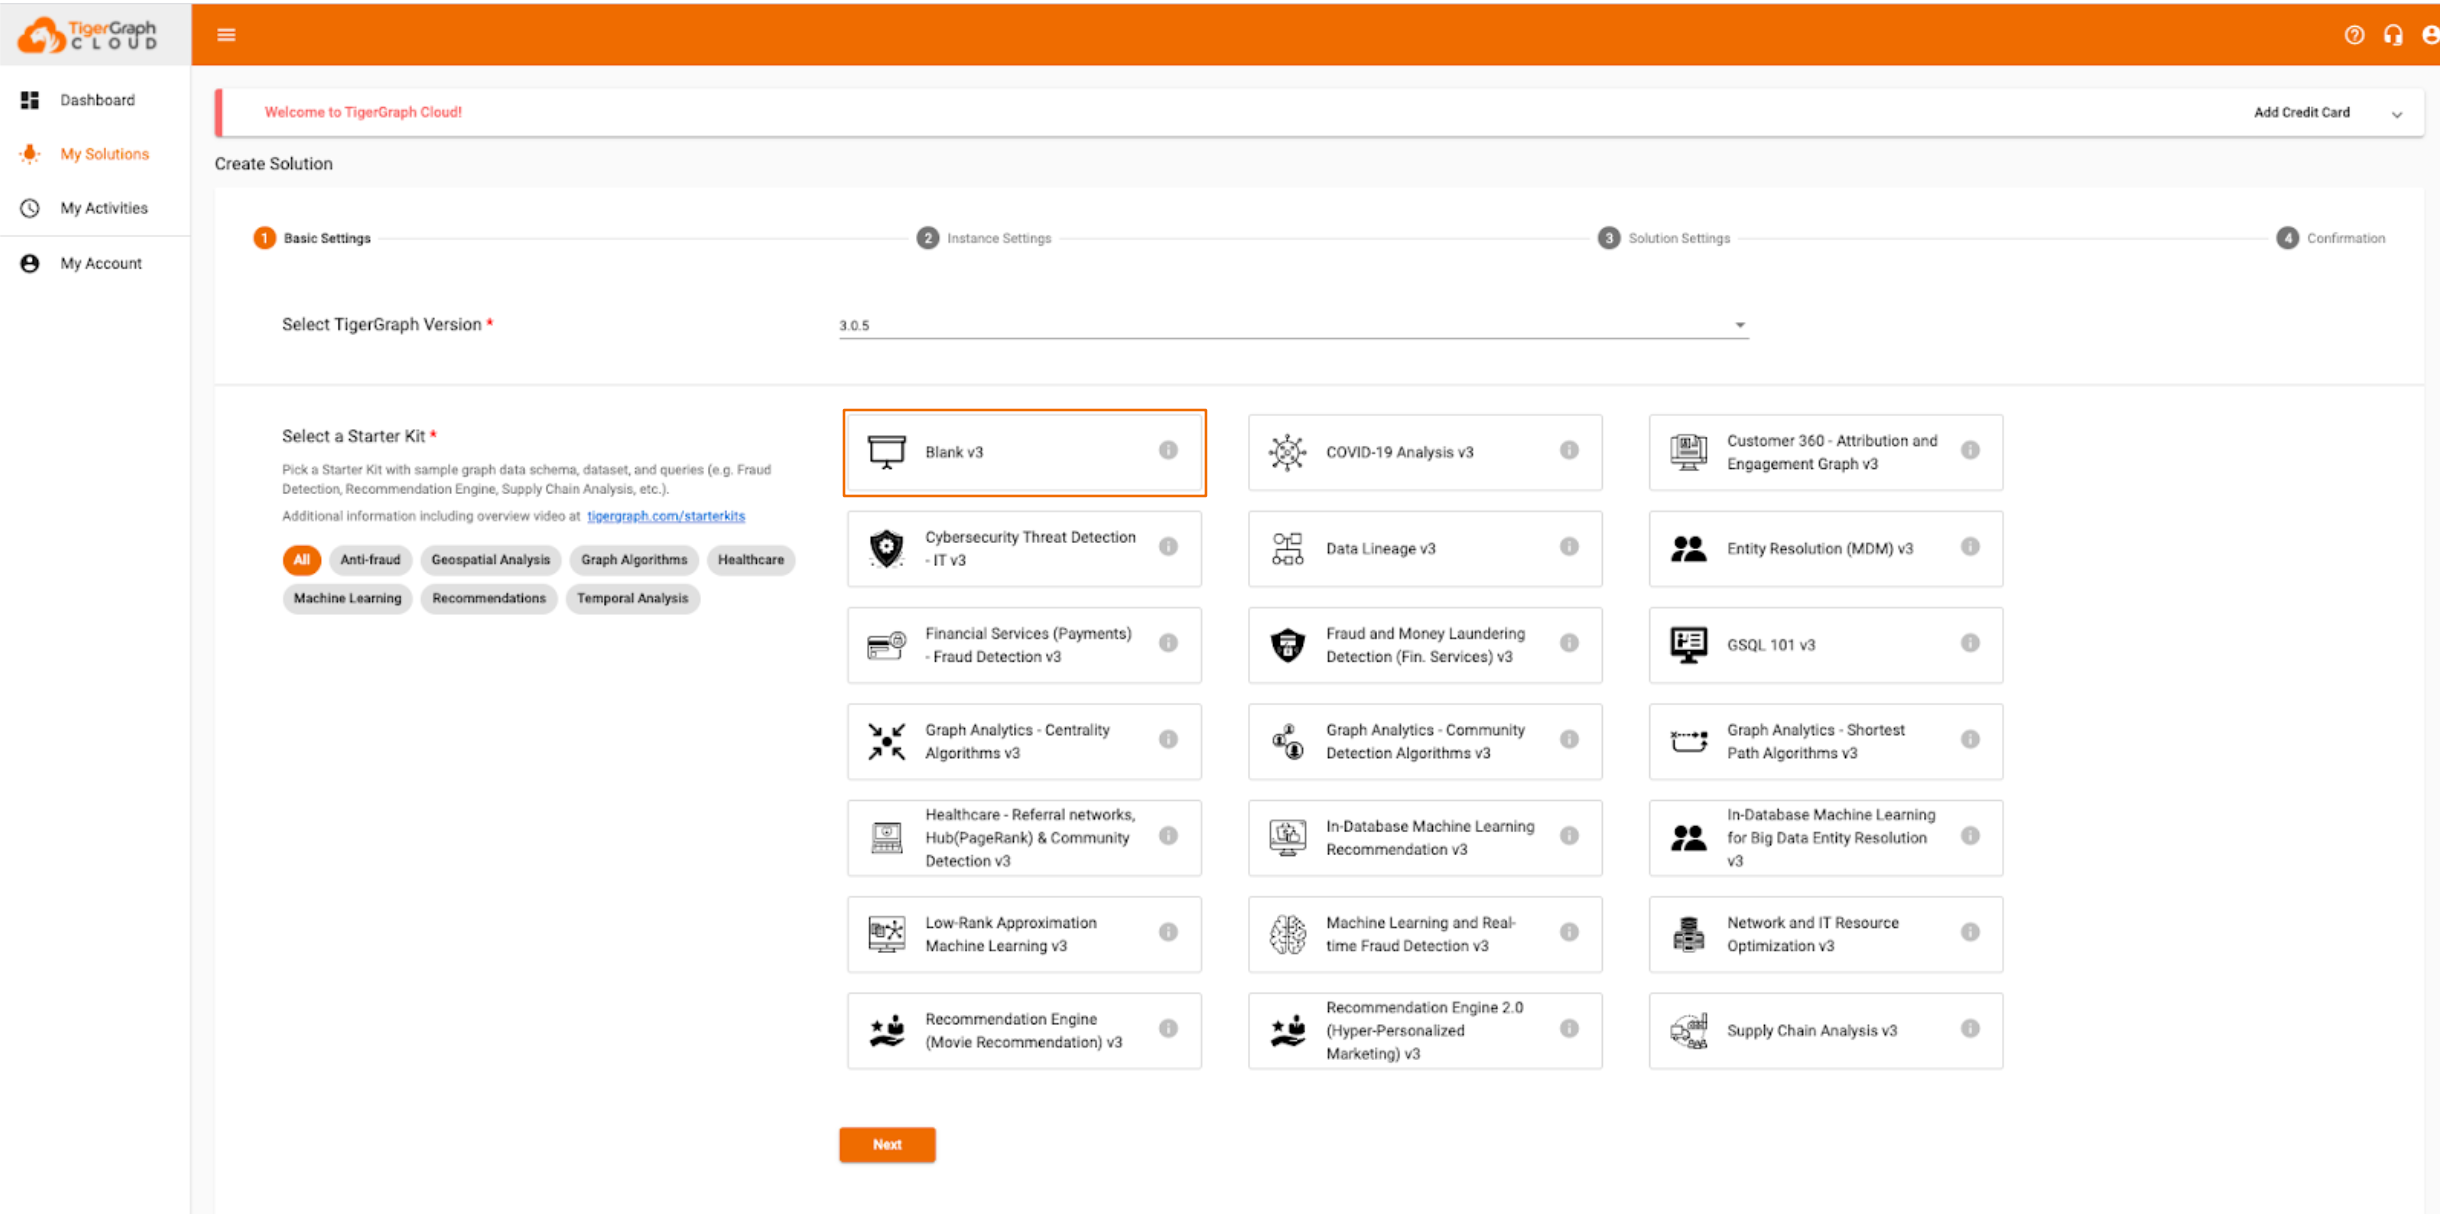
On this page, you can select from a wide variety of Starter Kits, which are complete Graph solutions containing a full graph schema, data, and custom queries.
We’ll talk about Starter Kits at the end of this chapter. For now, just choose a blank graph and hit Next.
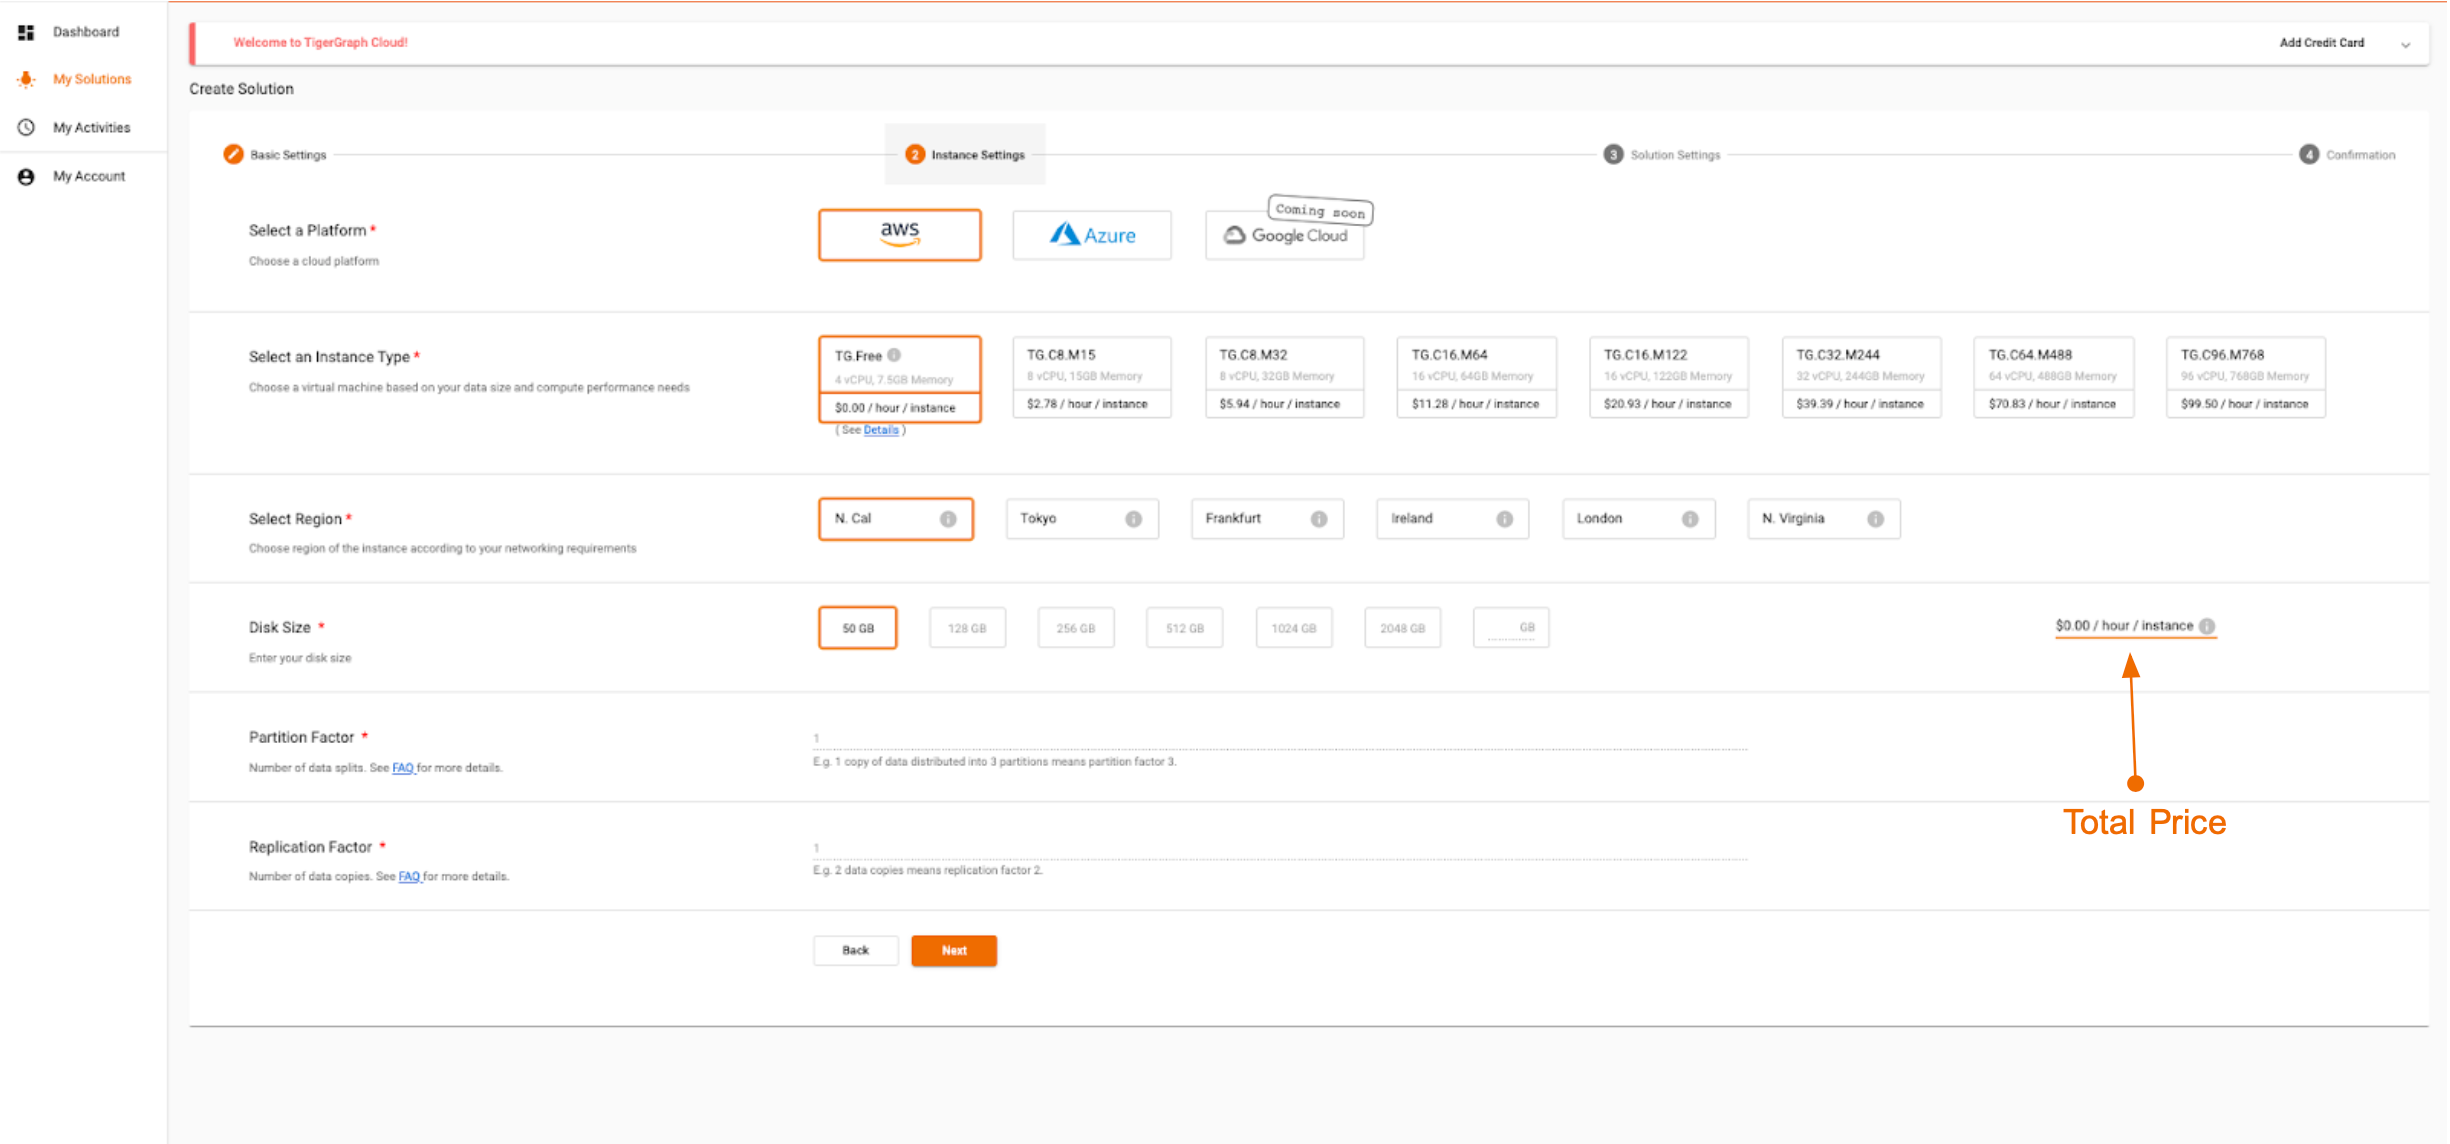
On this page you can select how much data and RAM you want for your solution. If you’re dealing with millions or billions of vertices and edges, you’ll probably need to choose a more powerful instance type. But, we’ll just stick with the basic version, which is FREE.
On the next page you can choose a name for your solution and a domain name for the GraphStudio GUI. You can also set any tags or descriptions.
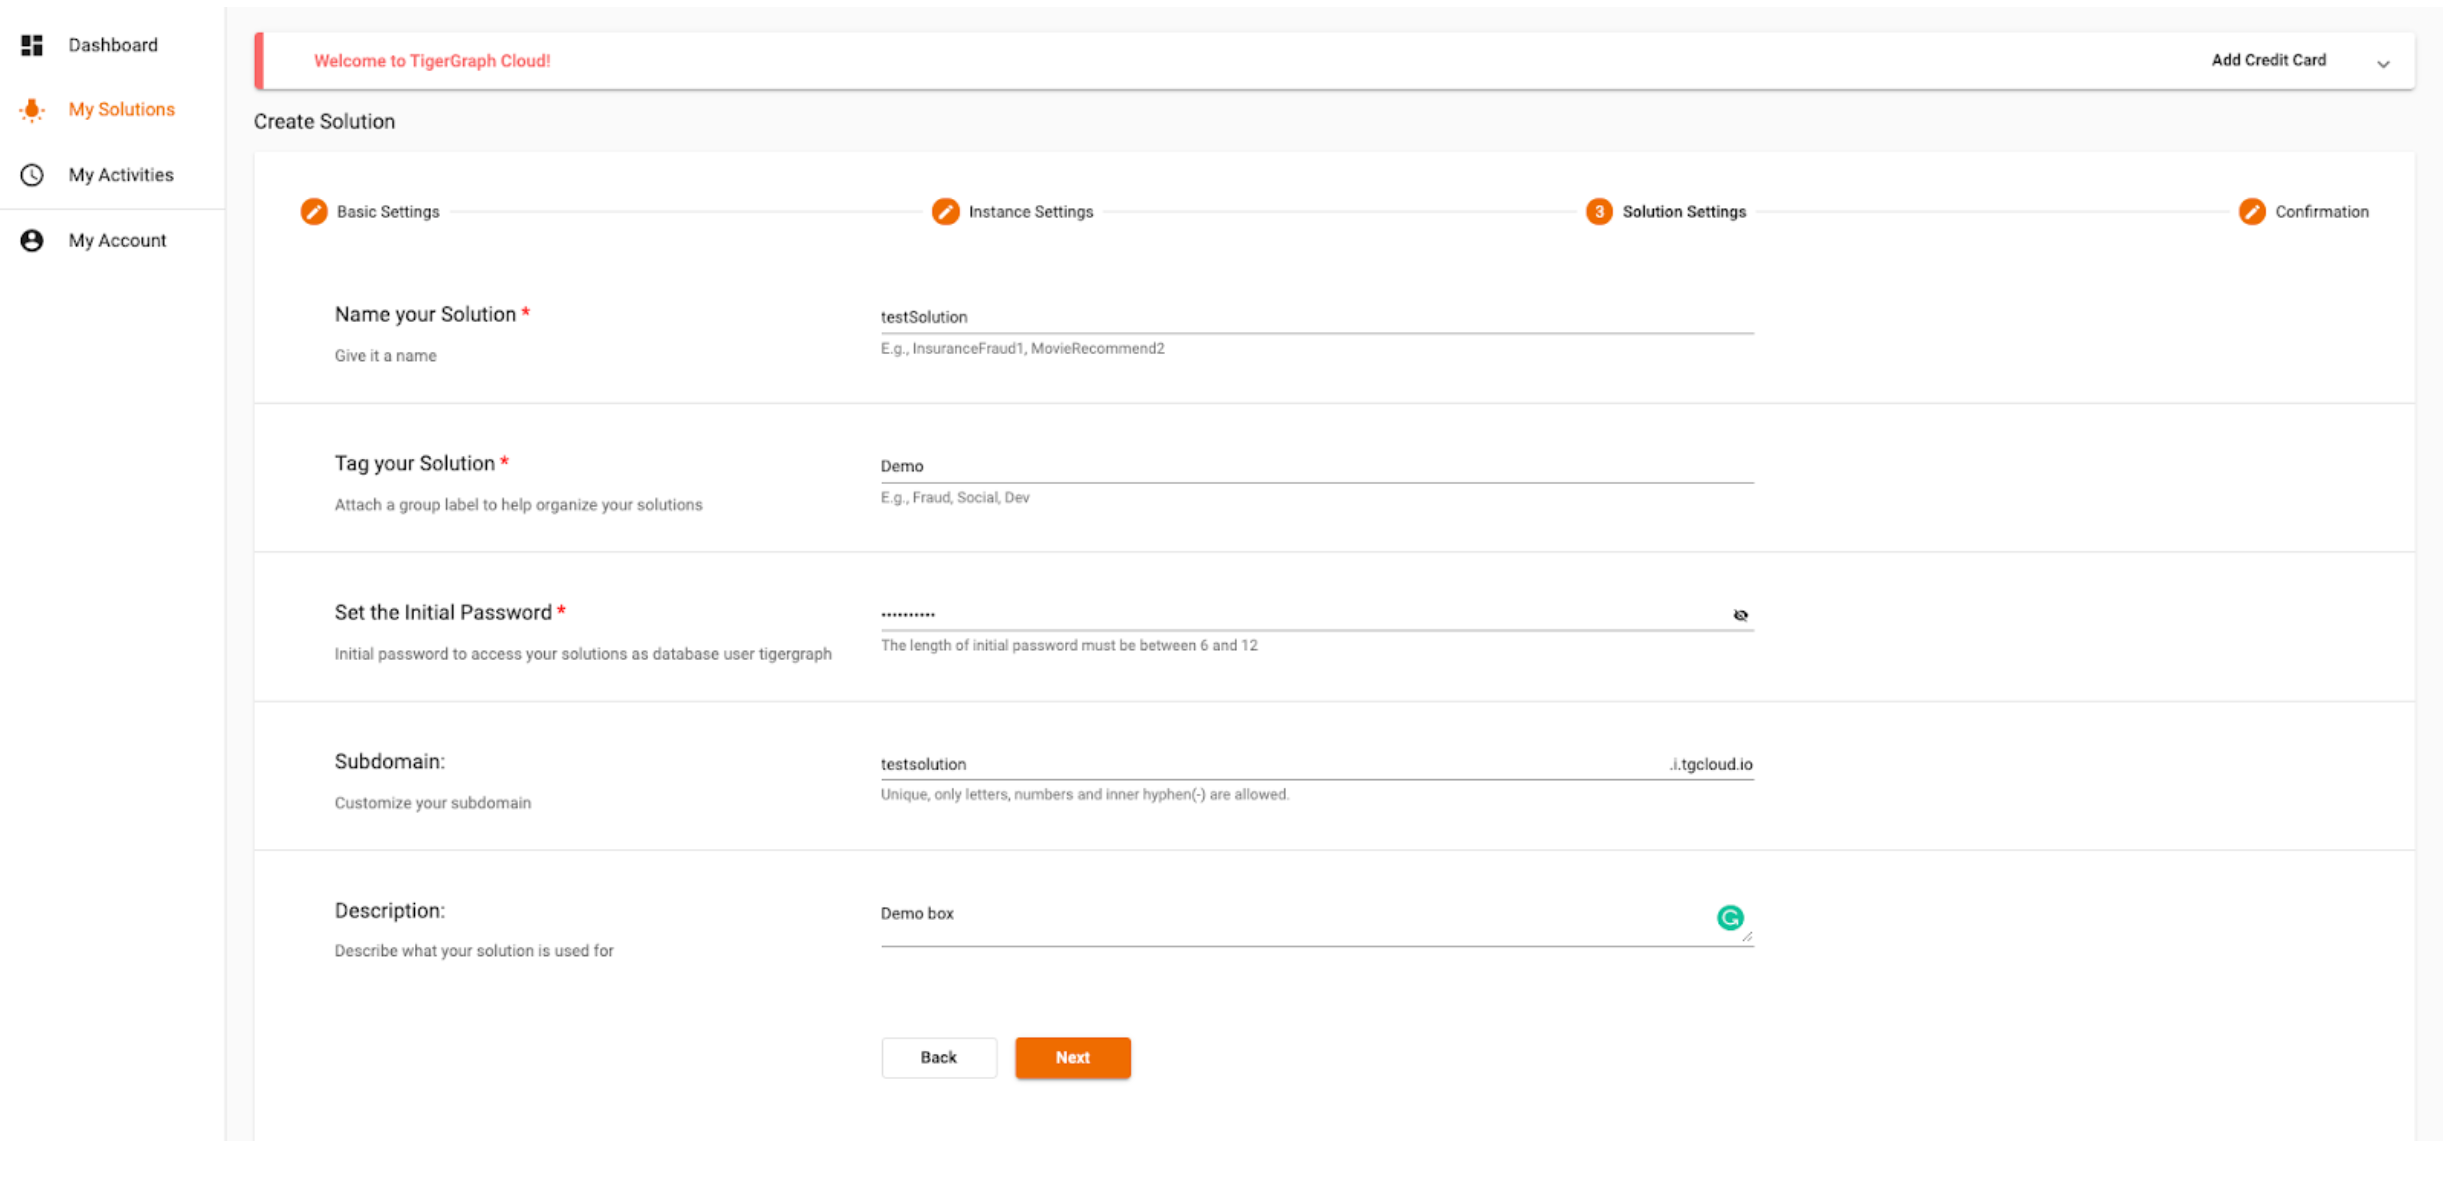
With that, the setup process is complete. Hit Next to view a summary of the solution.

Double-check to make sure everything looks good and then hit Submit.
The solution will now be created. This takes ~5 minutes, so feel free to grab a cup of coffee in the meantime.
You’ll notice that the solution now appears under the My Solutions tab. On this page you can view the information about any active solutions. Any solutions that you terminate will also appear here.
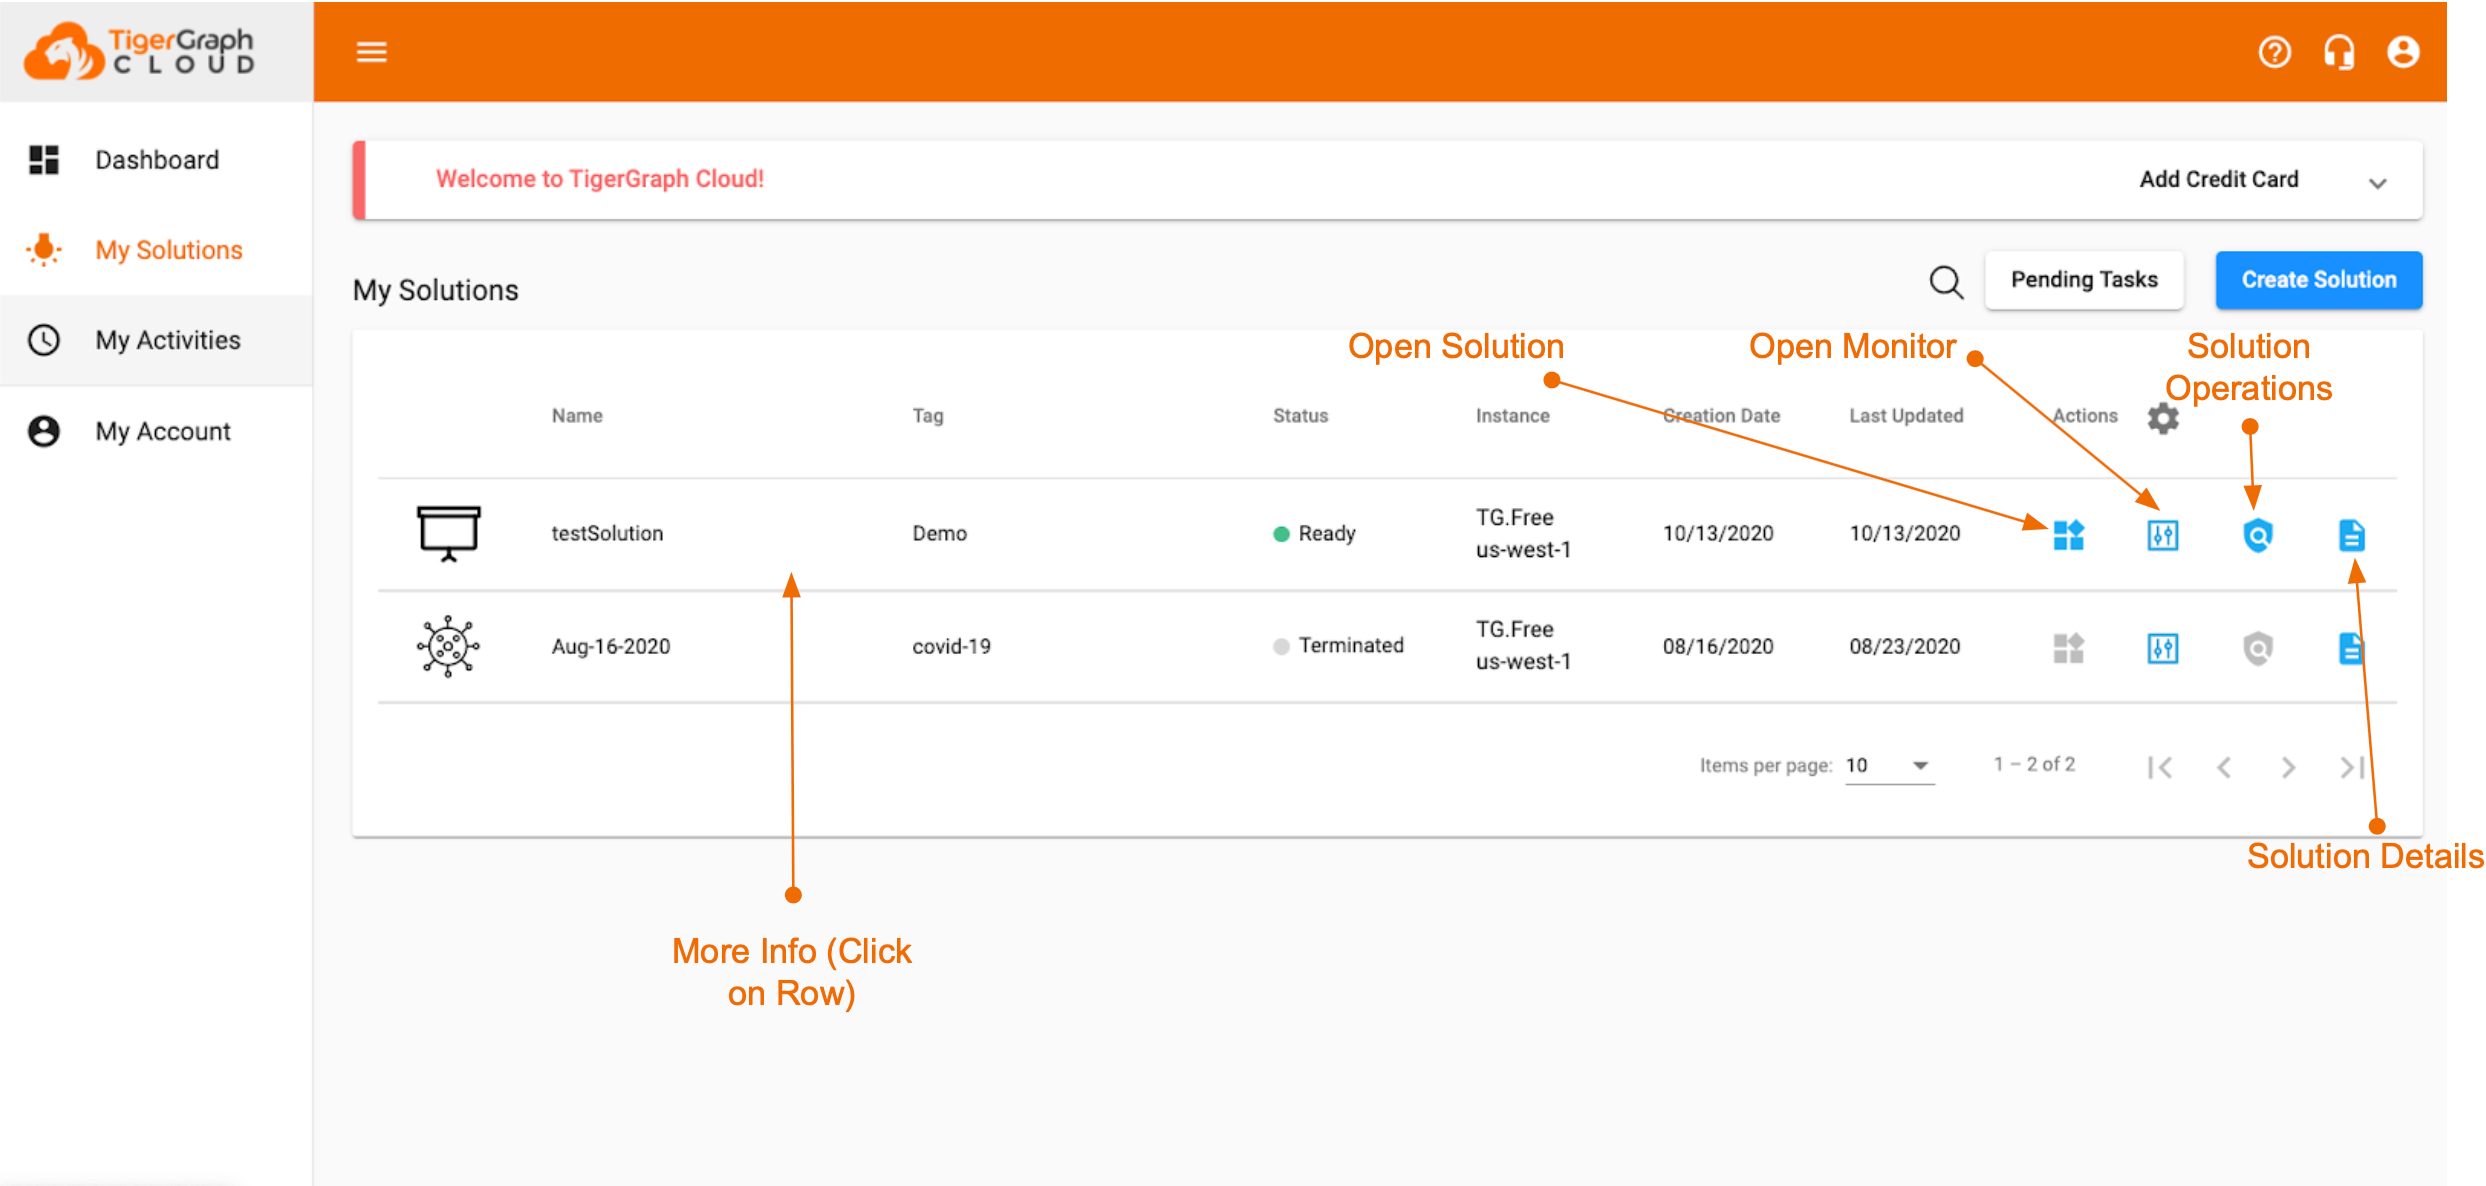
There is lots of information on this page, which mainly deals with solution performance and other data. For example, you can click on the row to see all of the solution details.
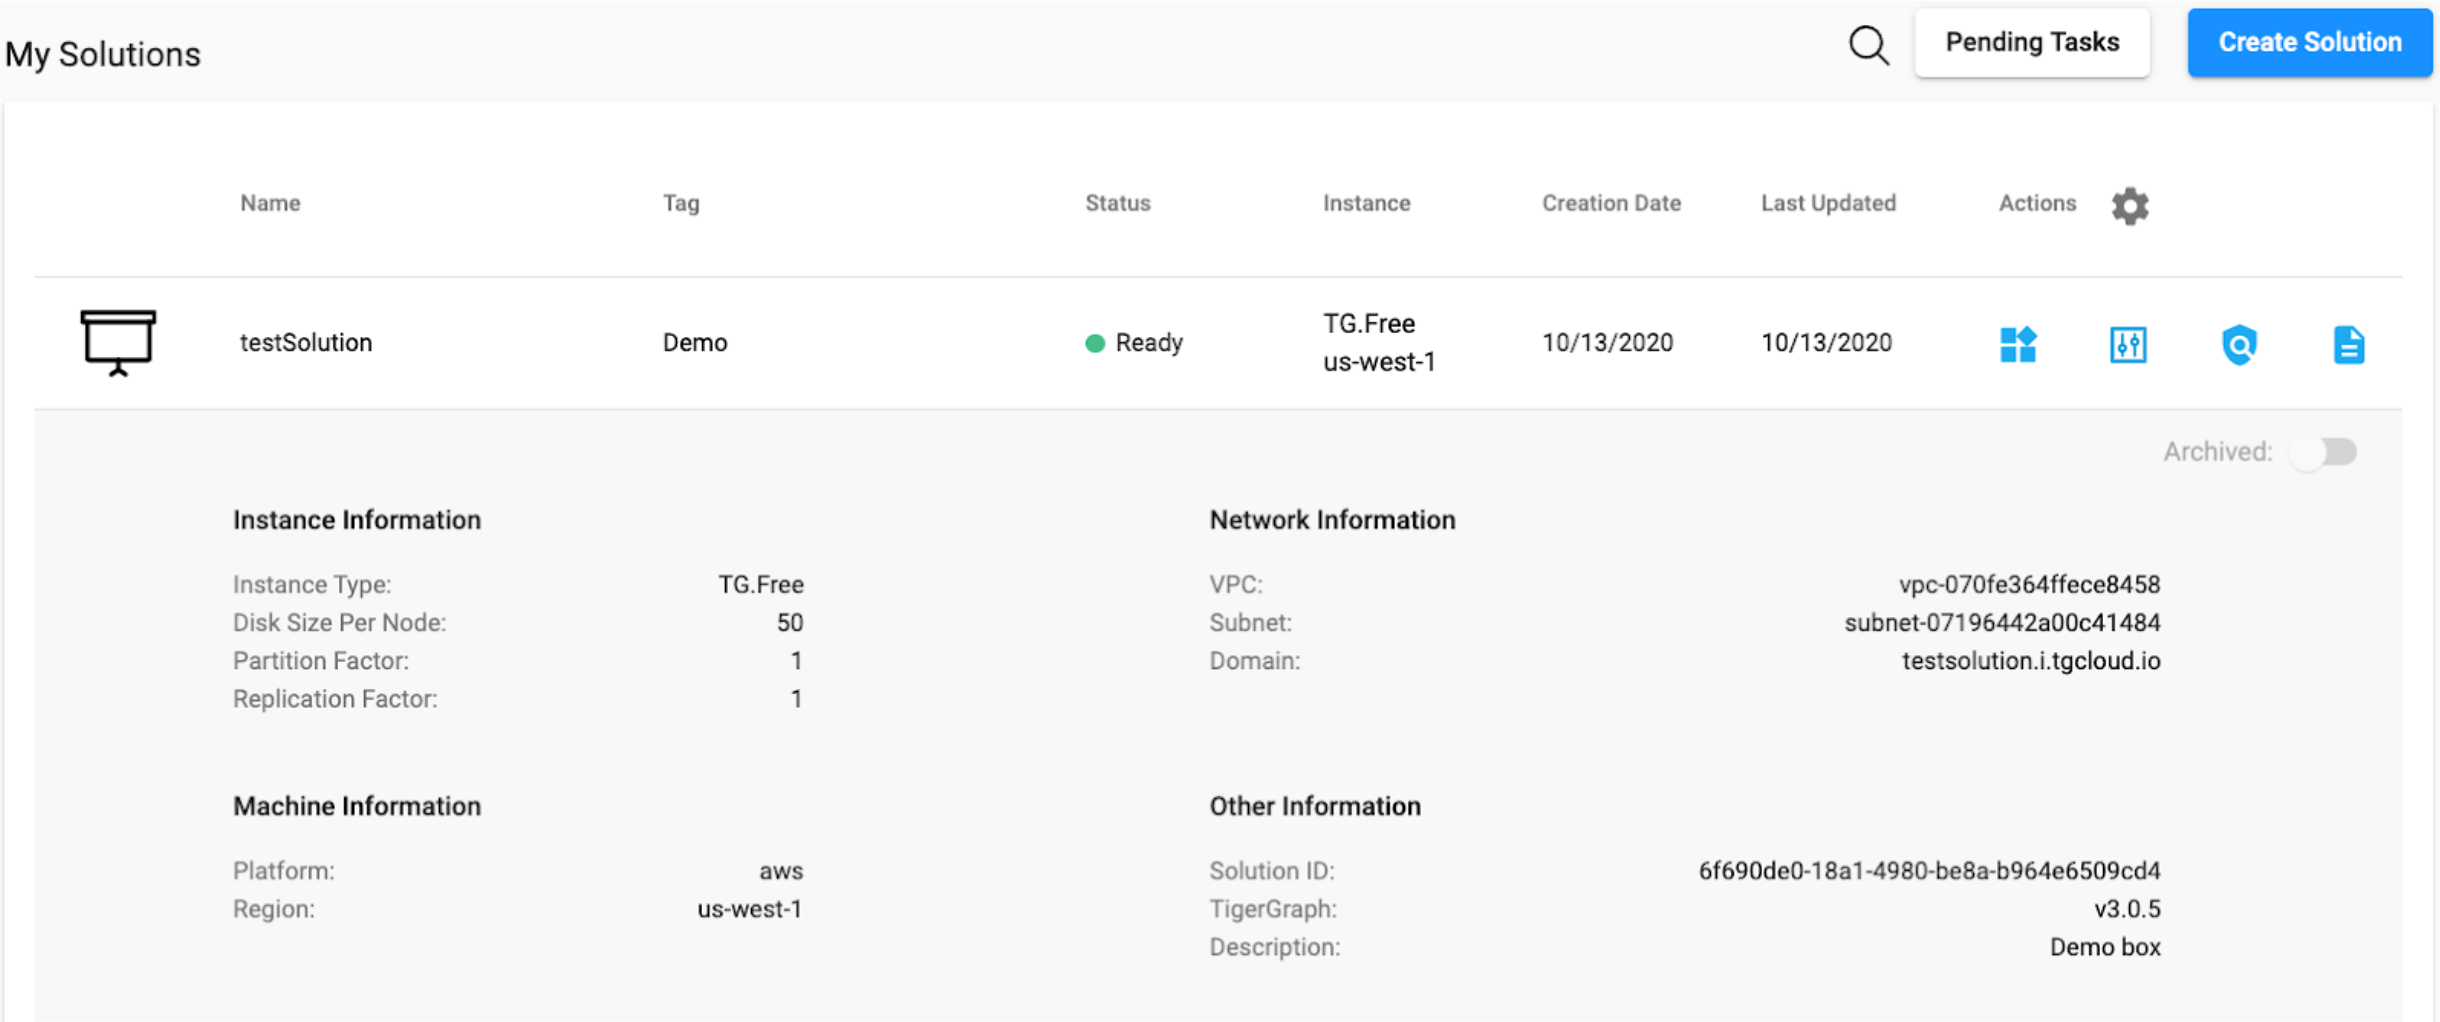
This isn’t too useful at the moment, but we’ll need some of the information listed in the later sections of the course.
Note: The second button allows you to start and stop your solution. You will always have to start your solution after it has been inactive for a certain period of time. It’s also best practice to stop your solution when you are done, especially if you are using a paid instance.
Once your solution is loaded, you’ll see the Ready status.
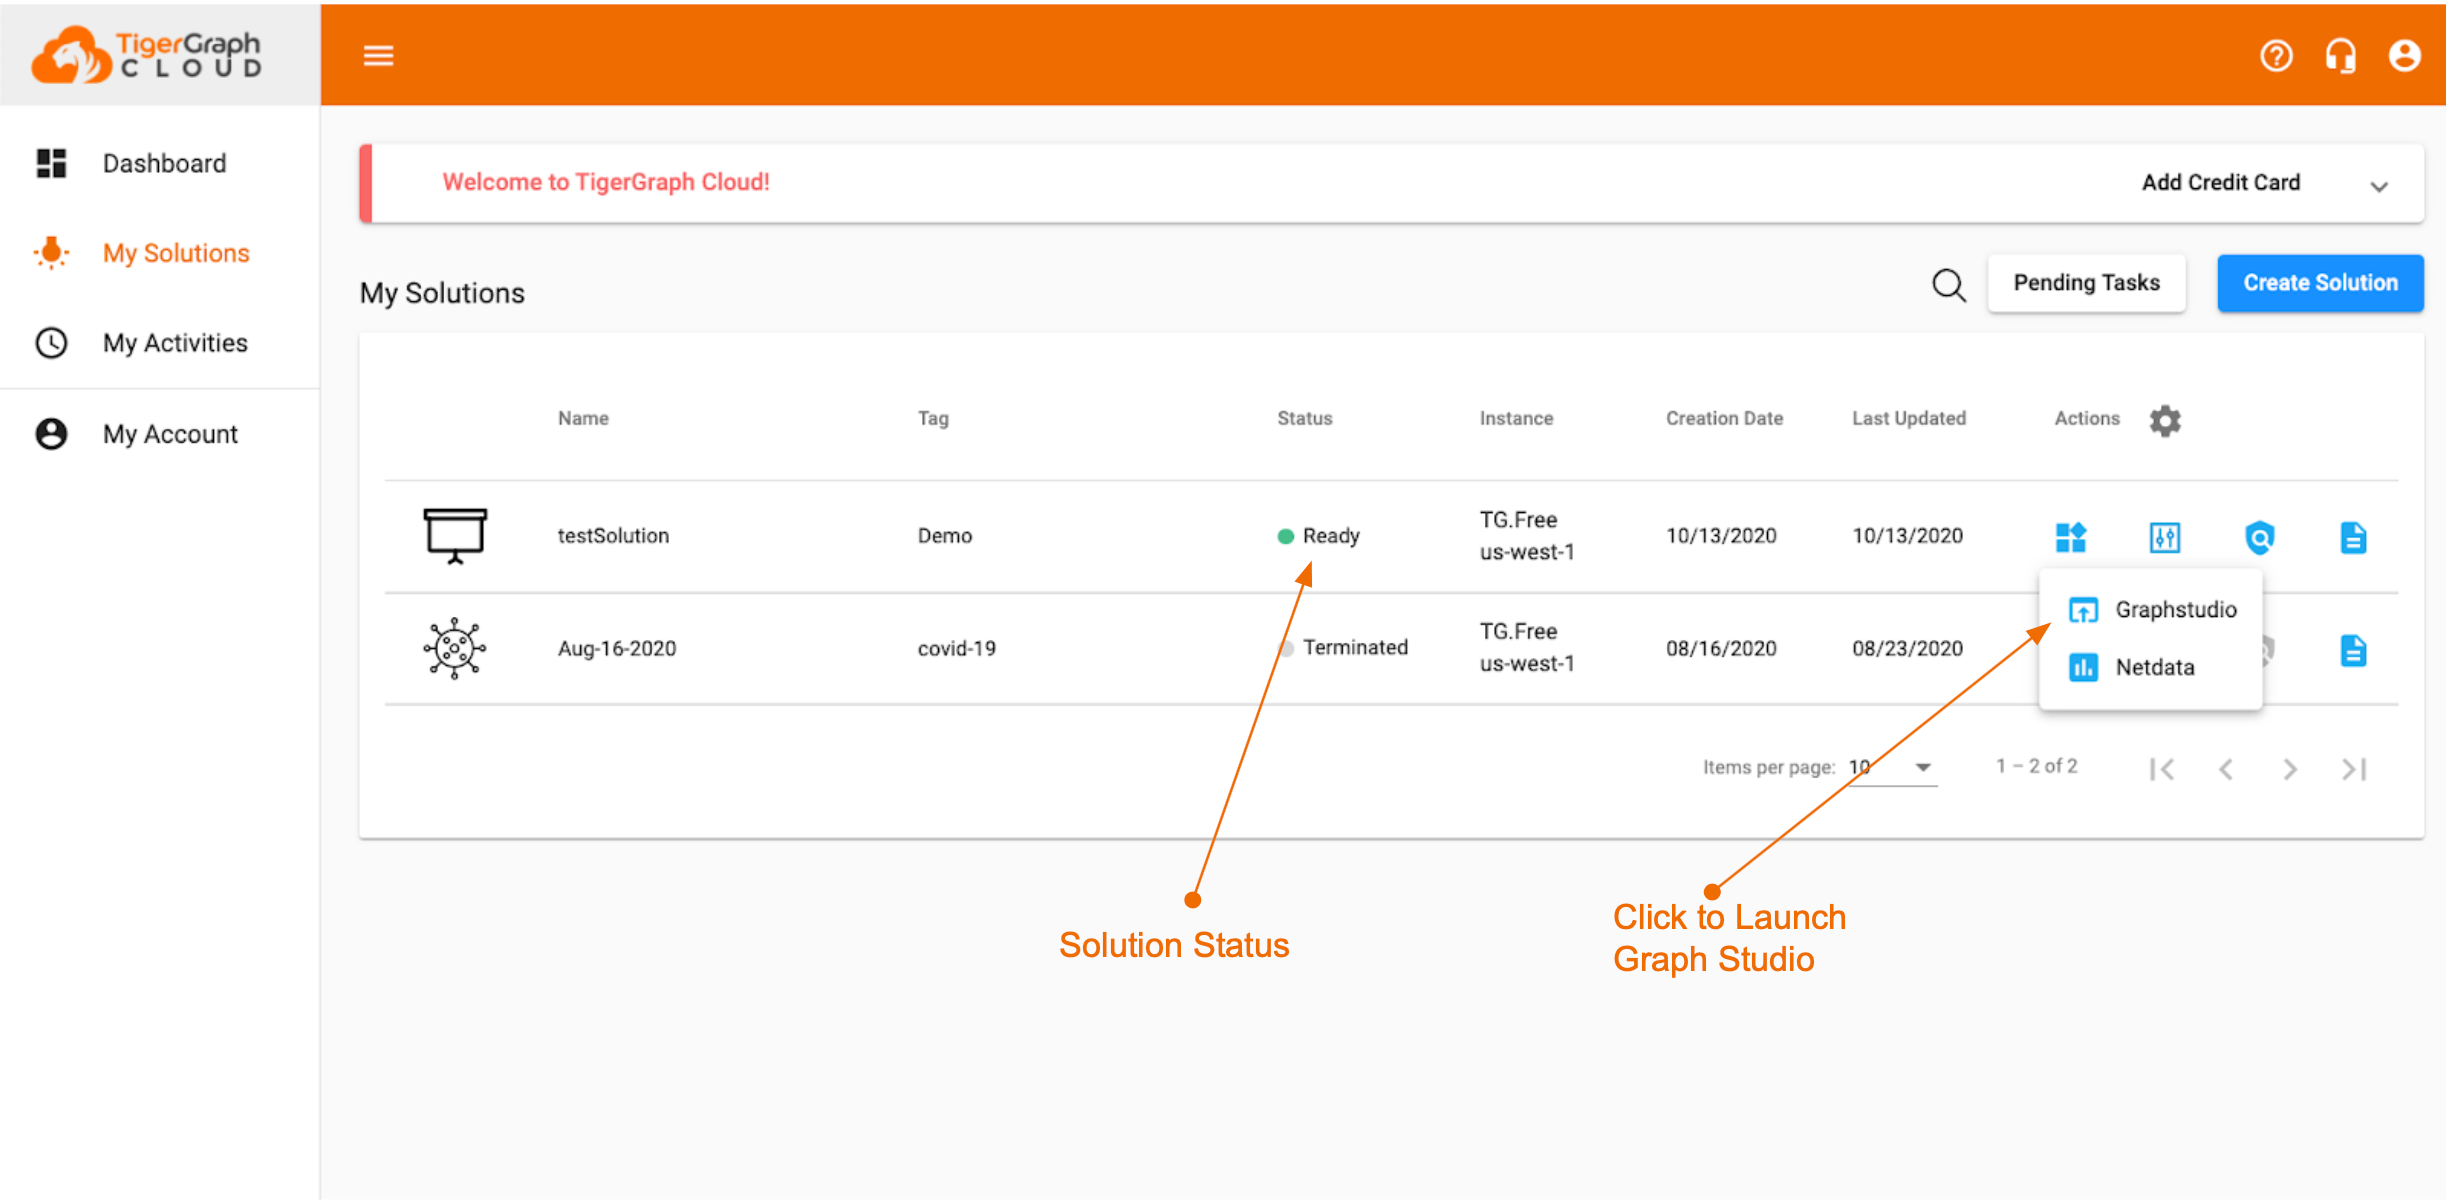
Now, we can get started with GraphStudio. To do so, hit the first icon, and in the dropdown menu select GraphStudio.
Once you’ve clicked the button, you will be redirected to a page that looks like this.
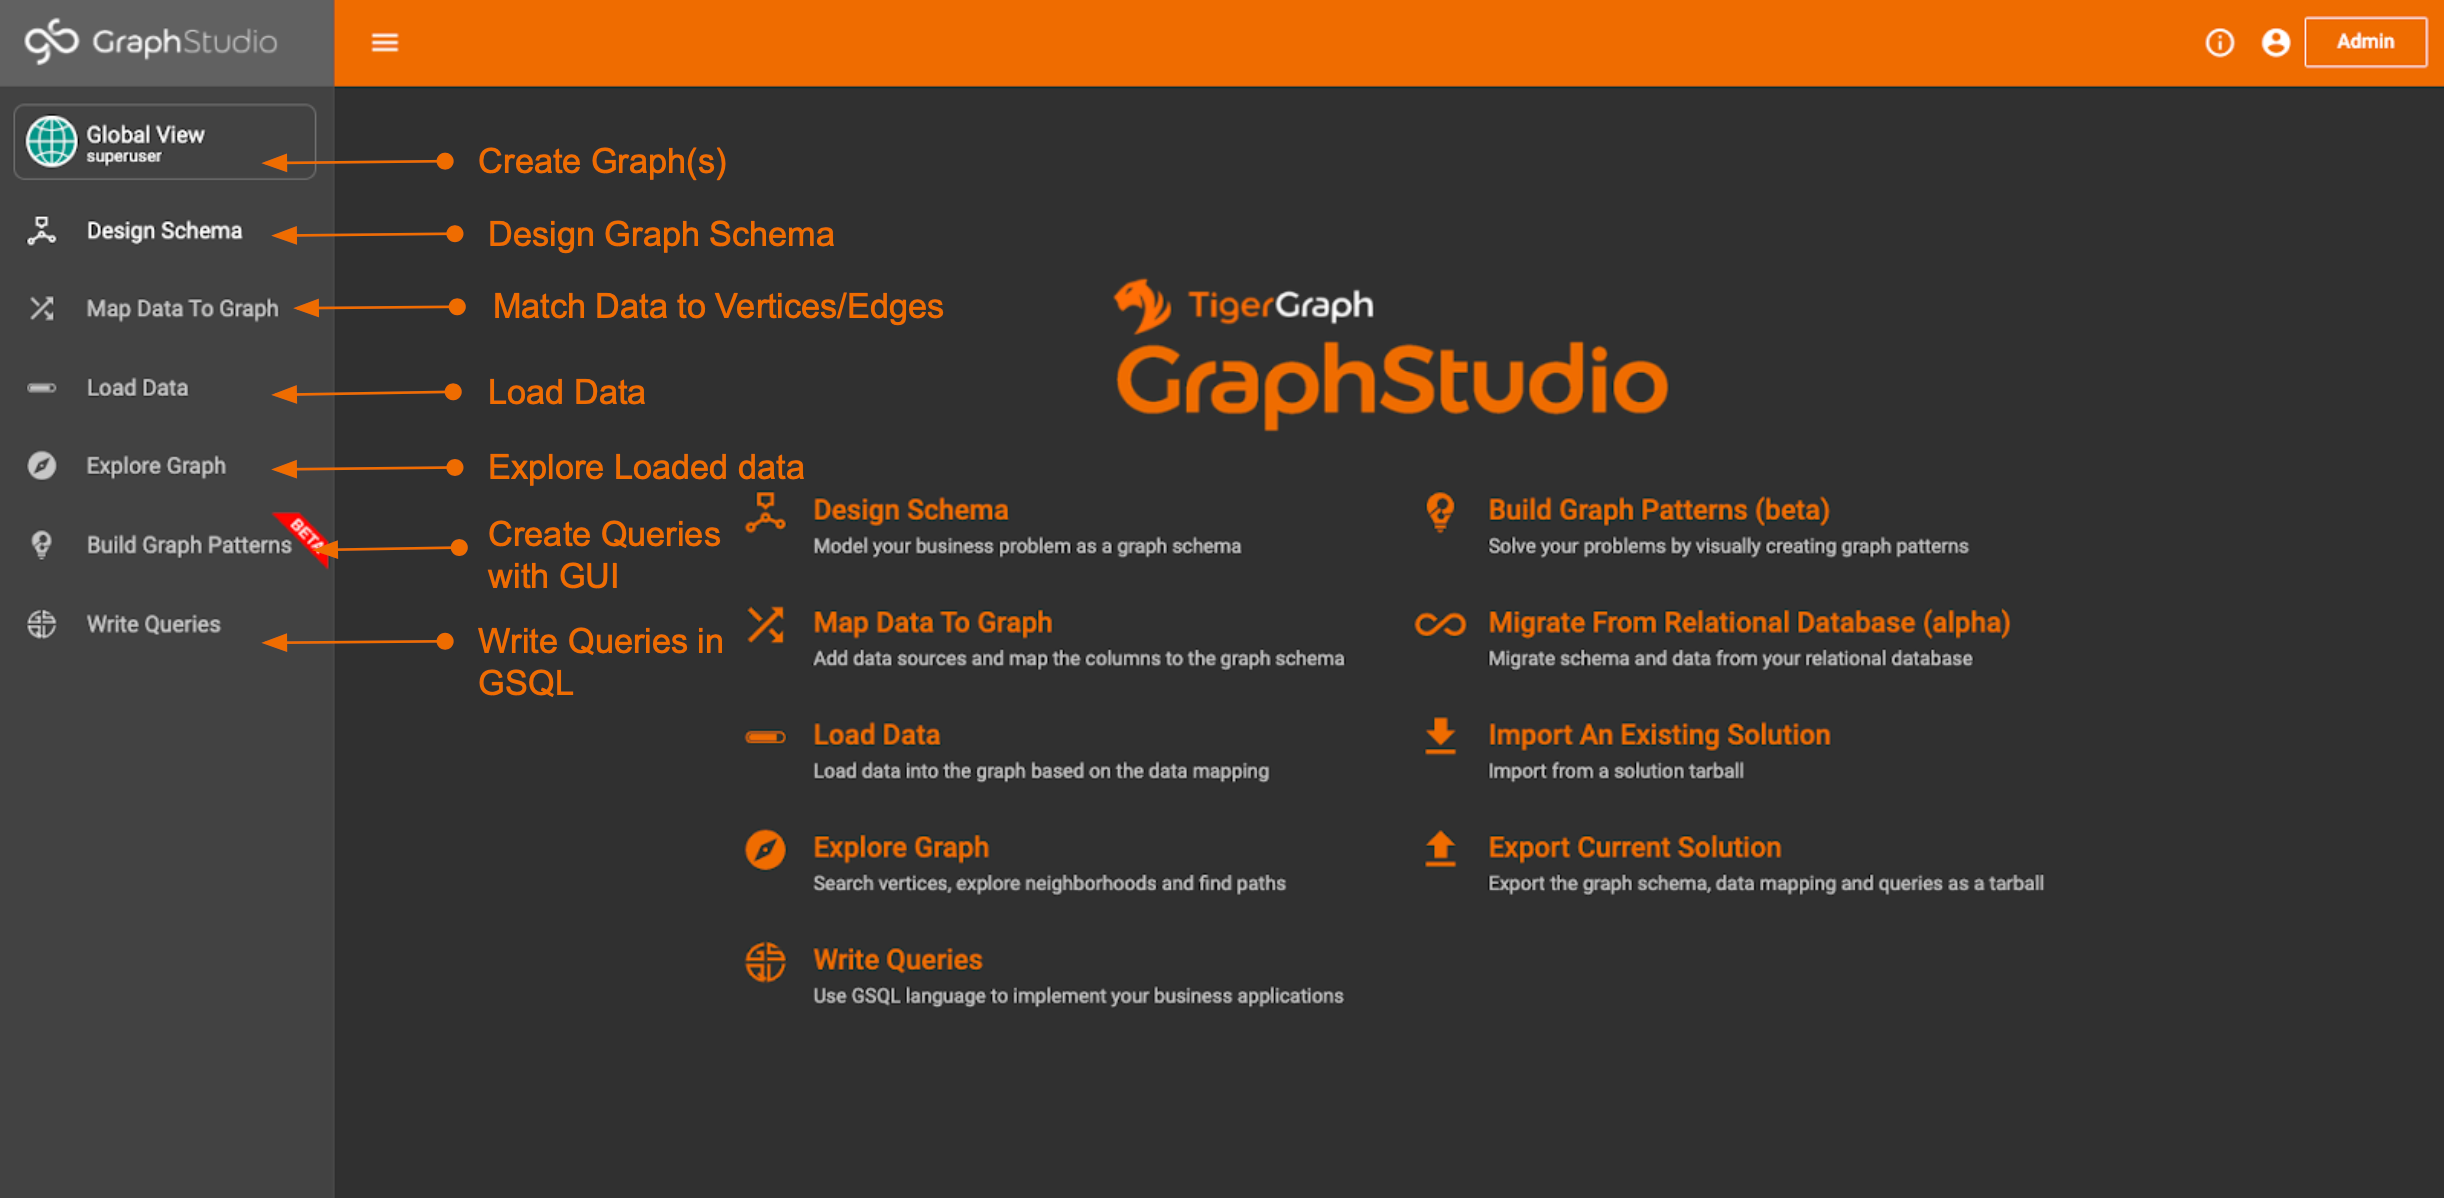
Yours will probably look white, as that is the default color setting. You can change it using the person icon in the top right corner if you’d like.
There are lots of different options on the screen. We’ll now walk through each one of them as we create our very own graph.
Create a Graph
The first step is to actually create you graph. This can be by clicking the Global View dropdown at the top left. You can name the graph anything you want.
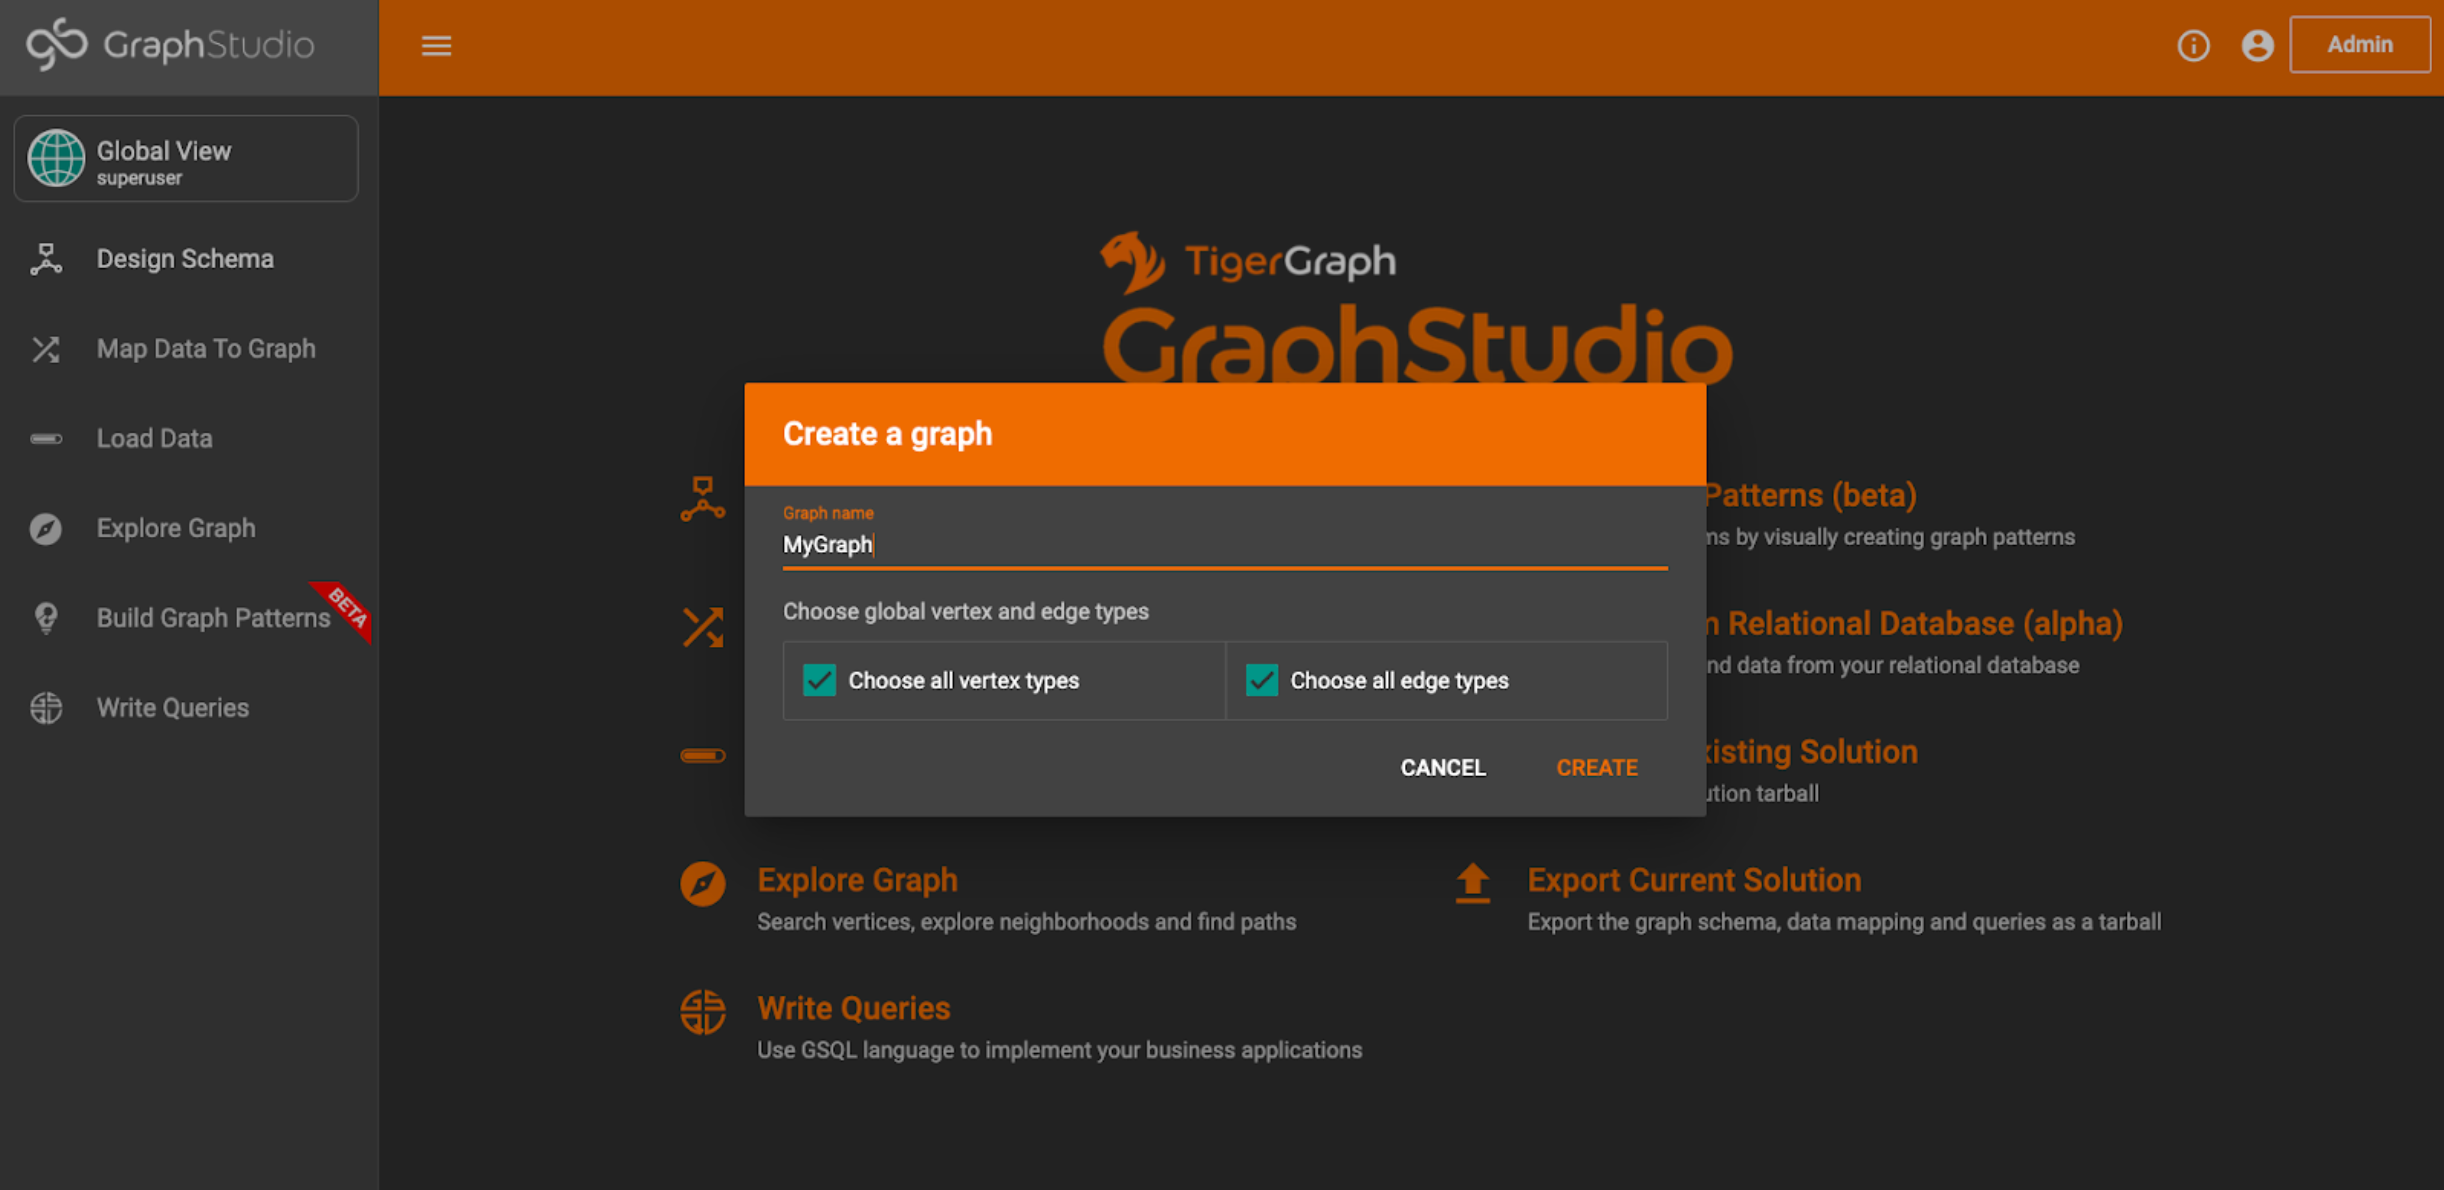
That’s all there is to it. You should now have an empty graph.
Design Graph
Make sure the graph you just created is selected in the top dropdown, and click Design Schema.
You will see a blank page like this.
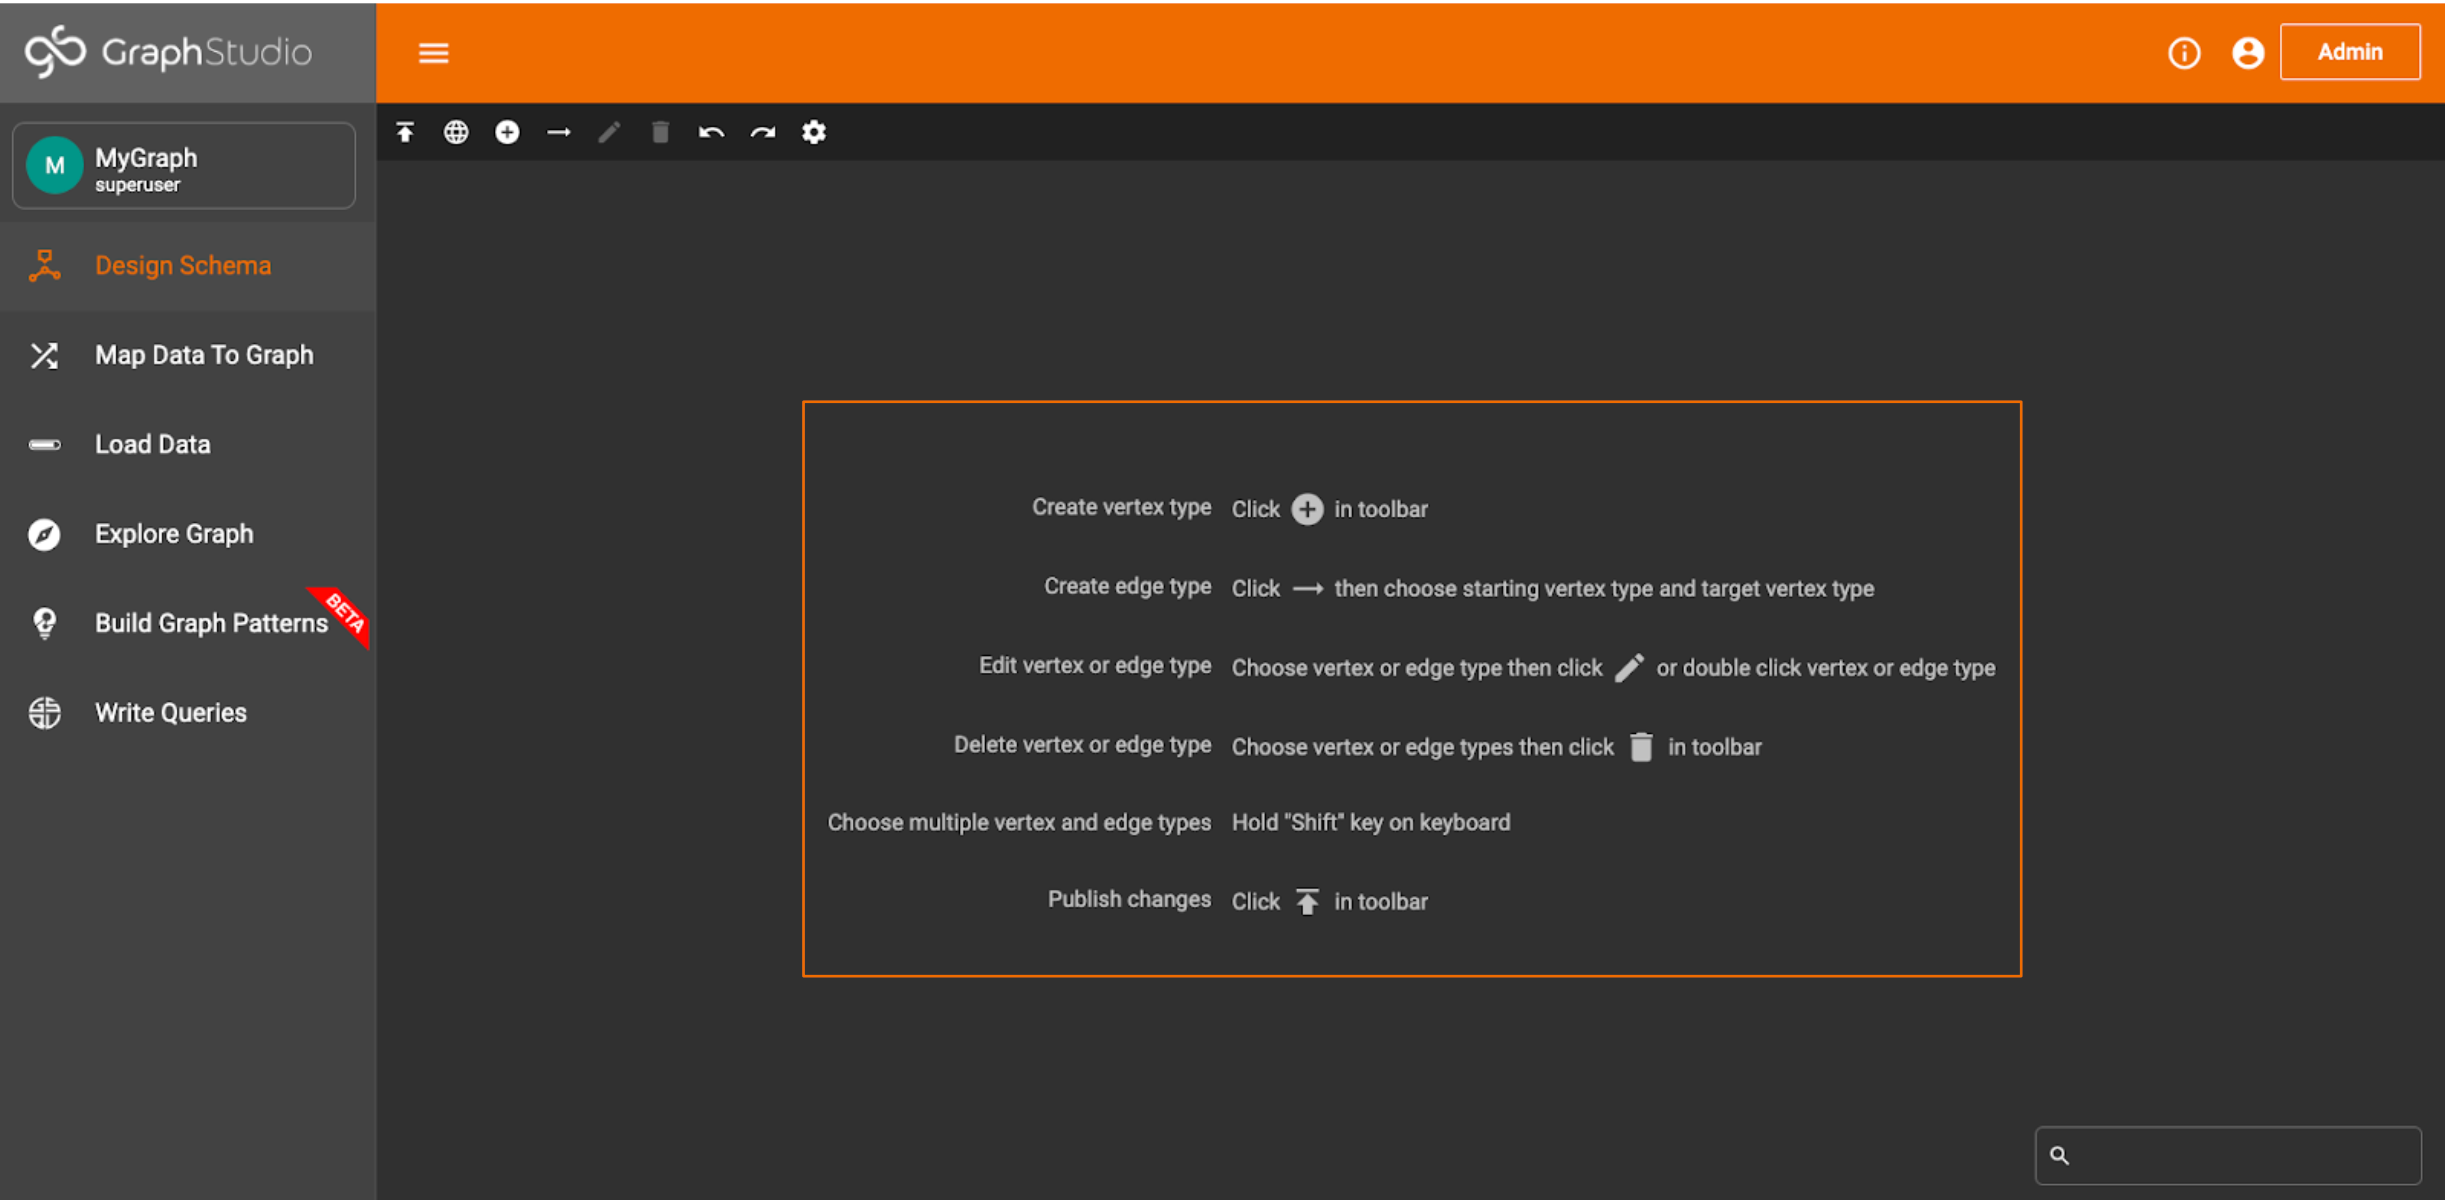
Instructions for creating vertices and edges are listed on the page, but we’ll go through them here just to be thorough.
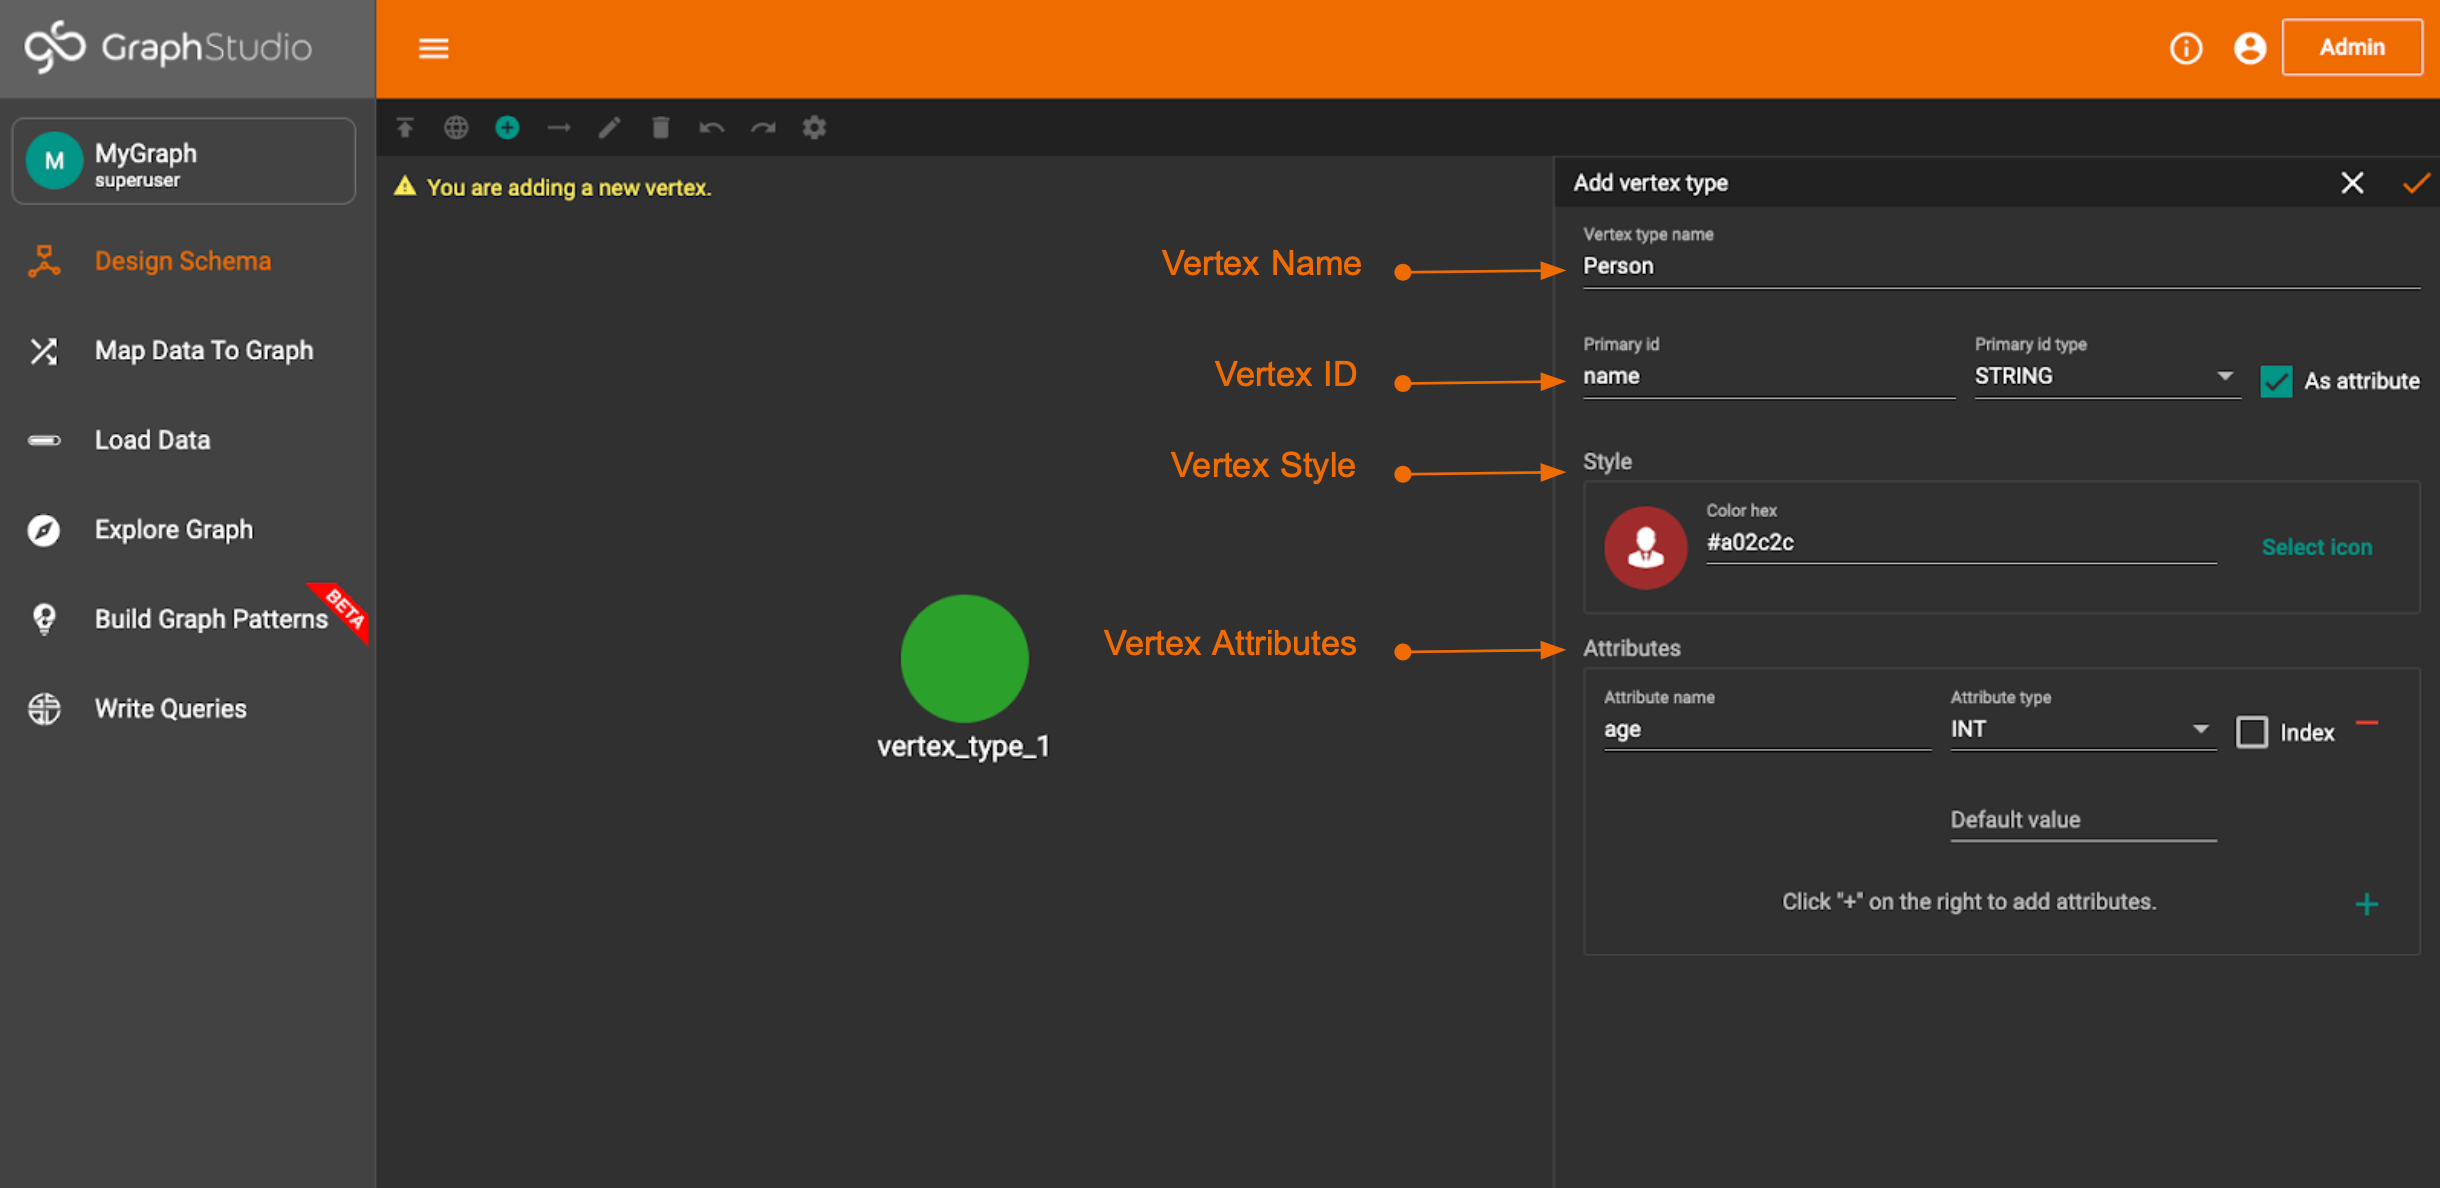
Let’s start by creating a vertex (hit the plus icon in the toolbar at the top). You’ll see a pop-up screen where you can input all of the information for your vertex.
For our demo, we’re creating a Person vertex with a name and an age. We will use the name as the primary ID for the person. Refer to the image below for guidance.
We can create an edge in a similar manner, using the arrow icon in the toolbar and then selecting the 2 vertex types the edge will connect. In our case, we’re creating a Friendship edge that connects a Person vertex to another Person vertex.
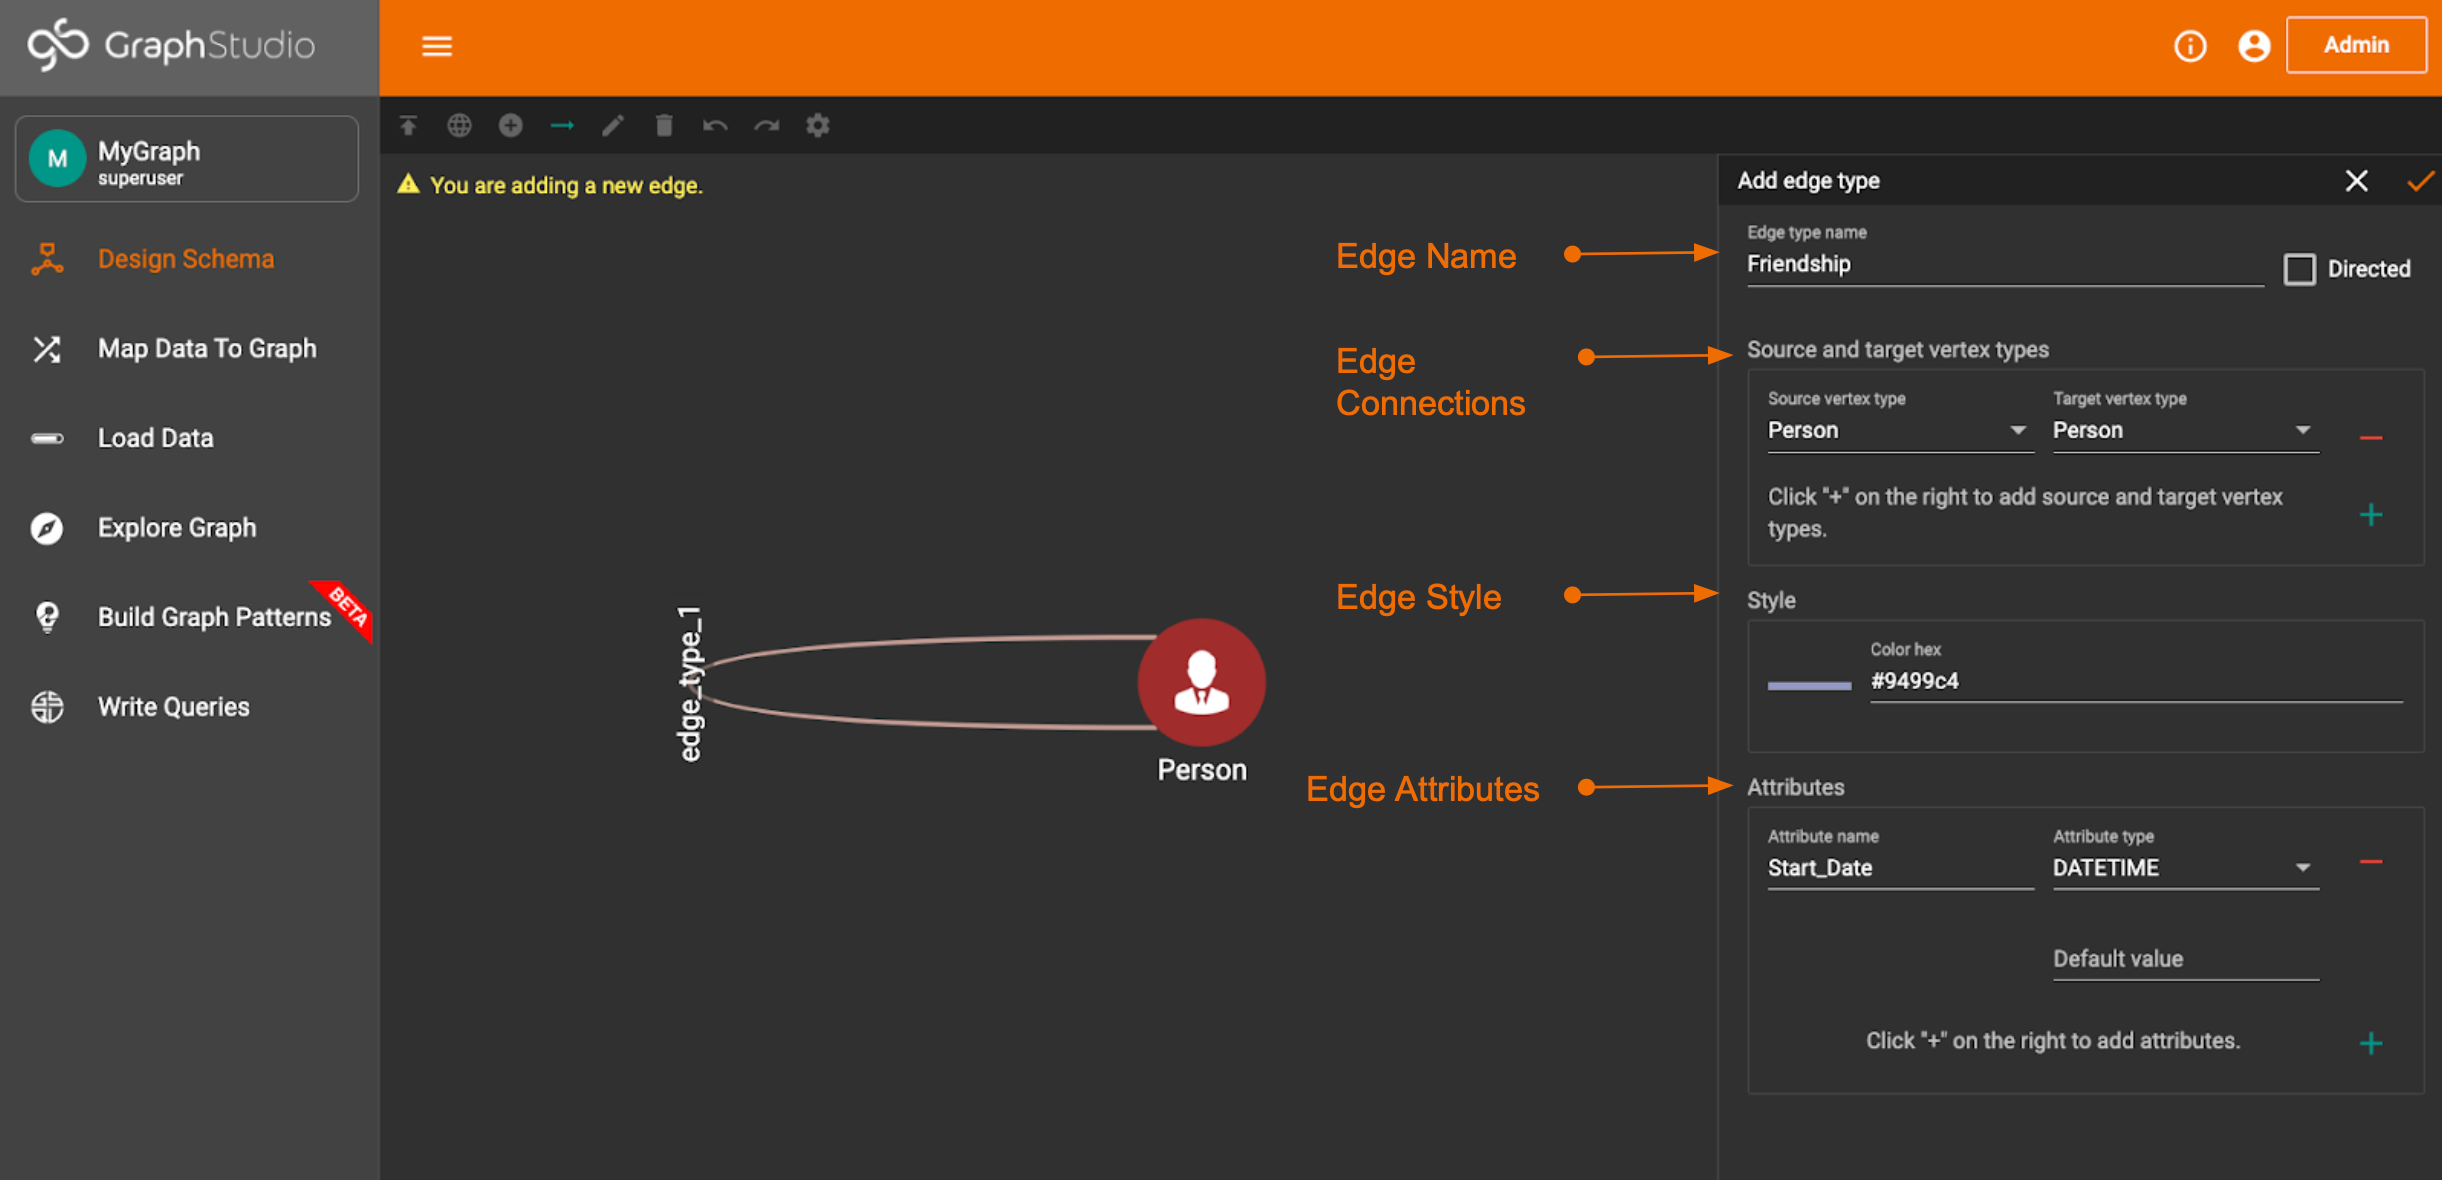
Note: TigerGraph is a property graph, meaning vertices AND edges can store data. So, on our edge we put the date that the friendship started.
We now have a complete graph with a vertex and edge. That’s all there is to creating a schema! Of course, most graph schemas will be larger than a single vertex and edge type.
But, to add more to a schema just repeat the steps we’ve already done. You can also edit or delete any vertices and edges you make.
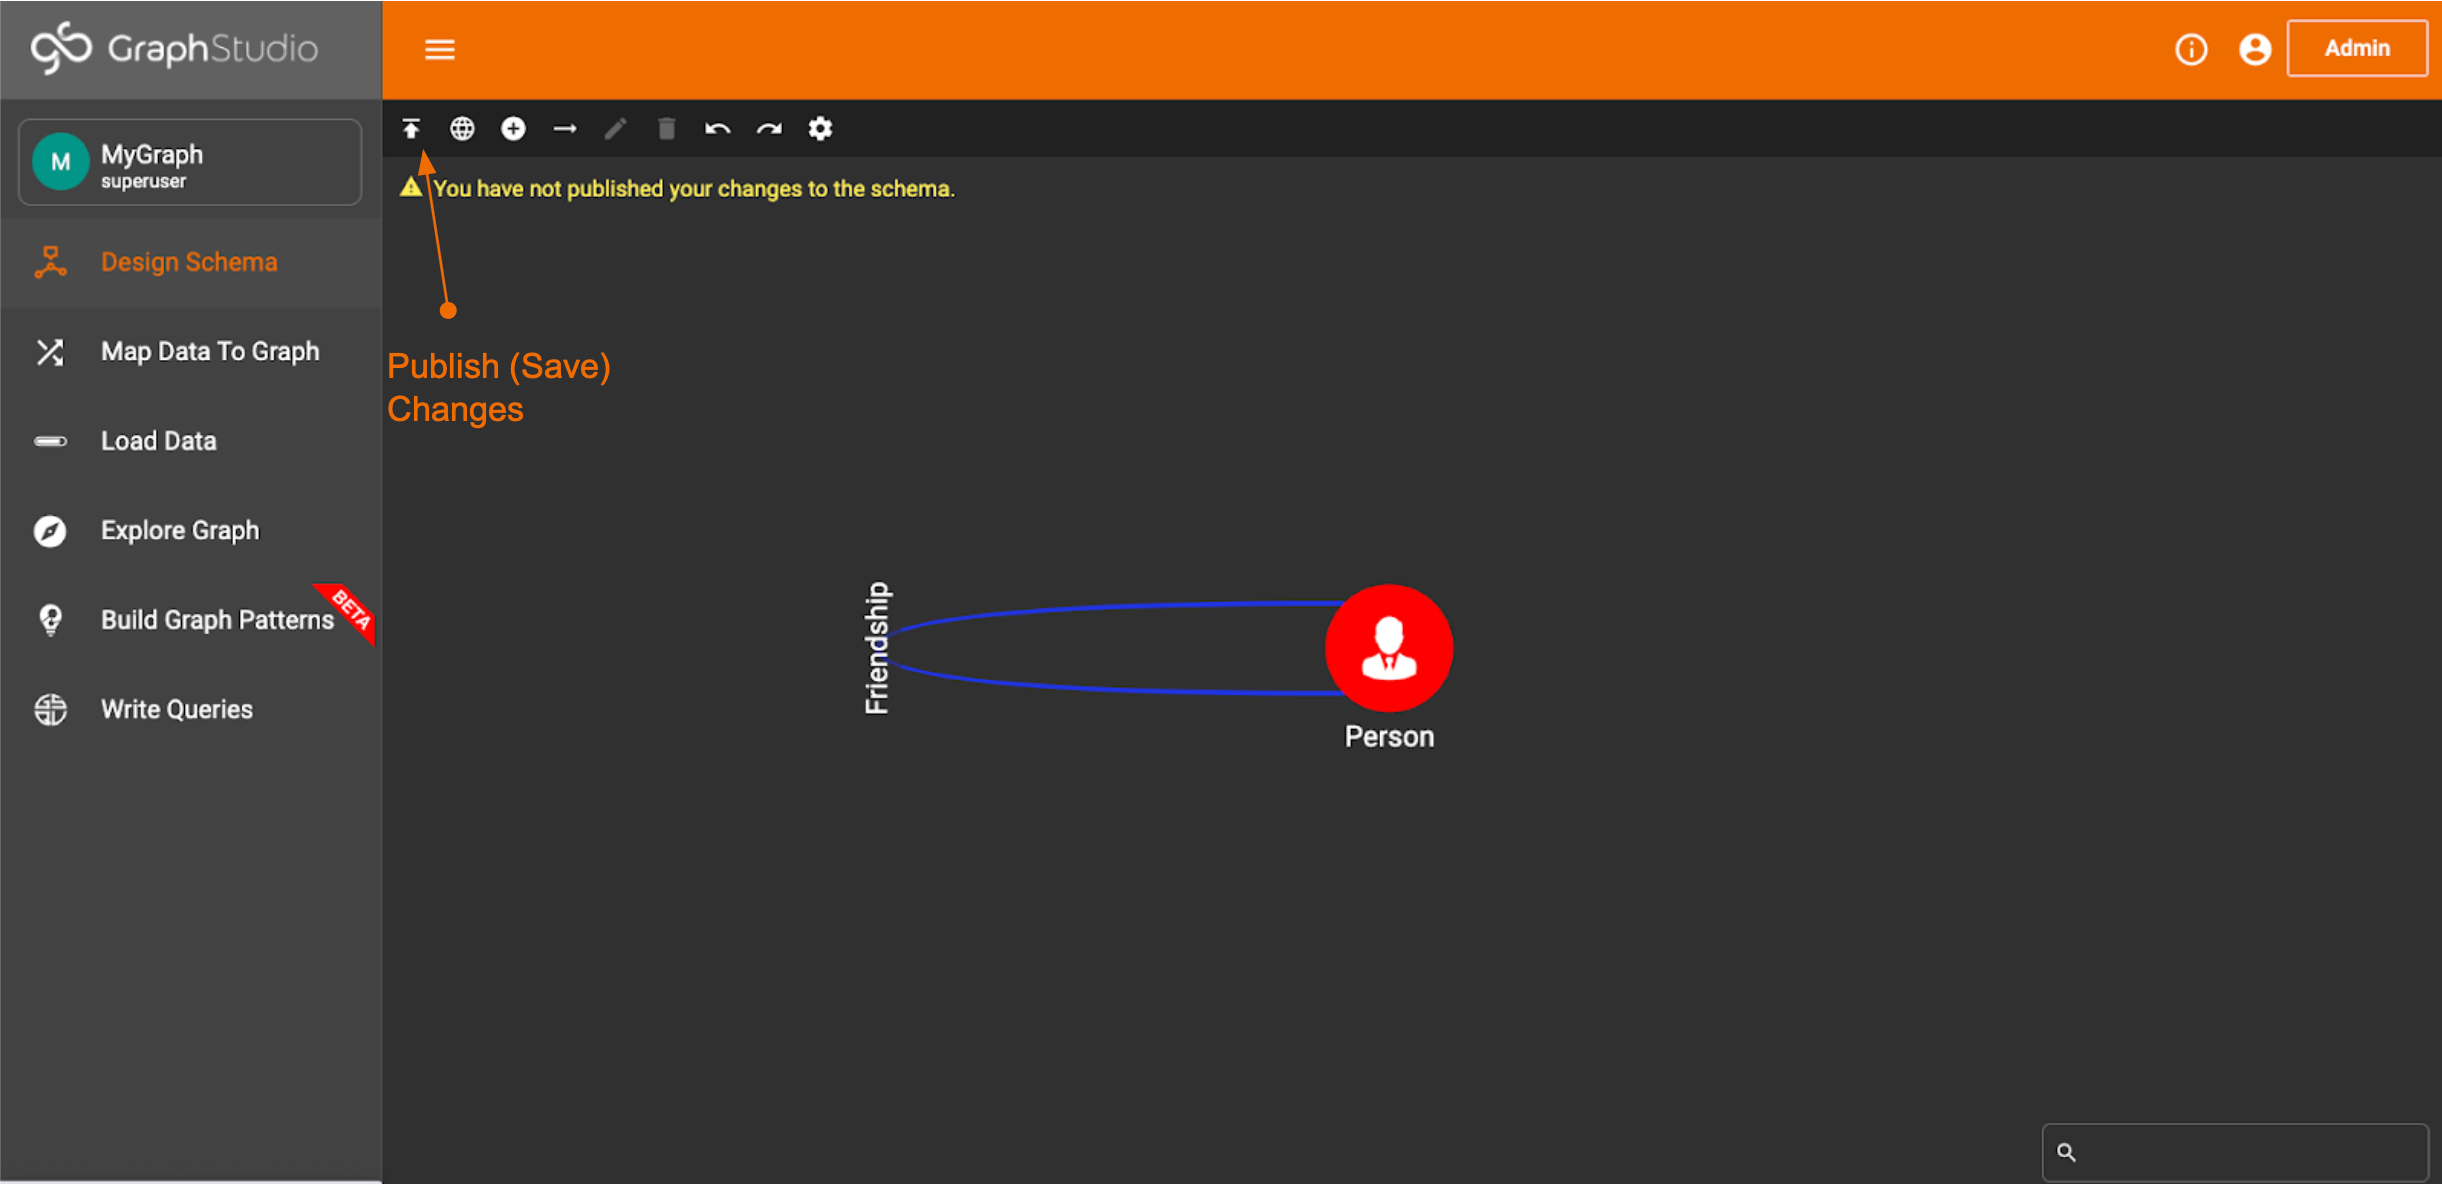
Now we can save the schema using the Publish button.
Map Data
Mapping Data is one of the trickiest steps in using GraphStudio. But, it is crucial to having the data stored correctly in the graph.
The first step is to import any data files, which can be done by clicking the file icon on the toolbar.
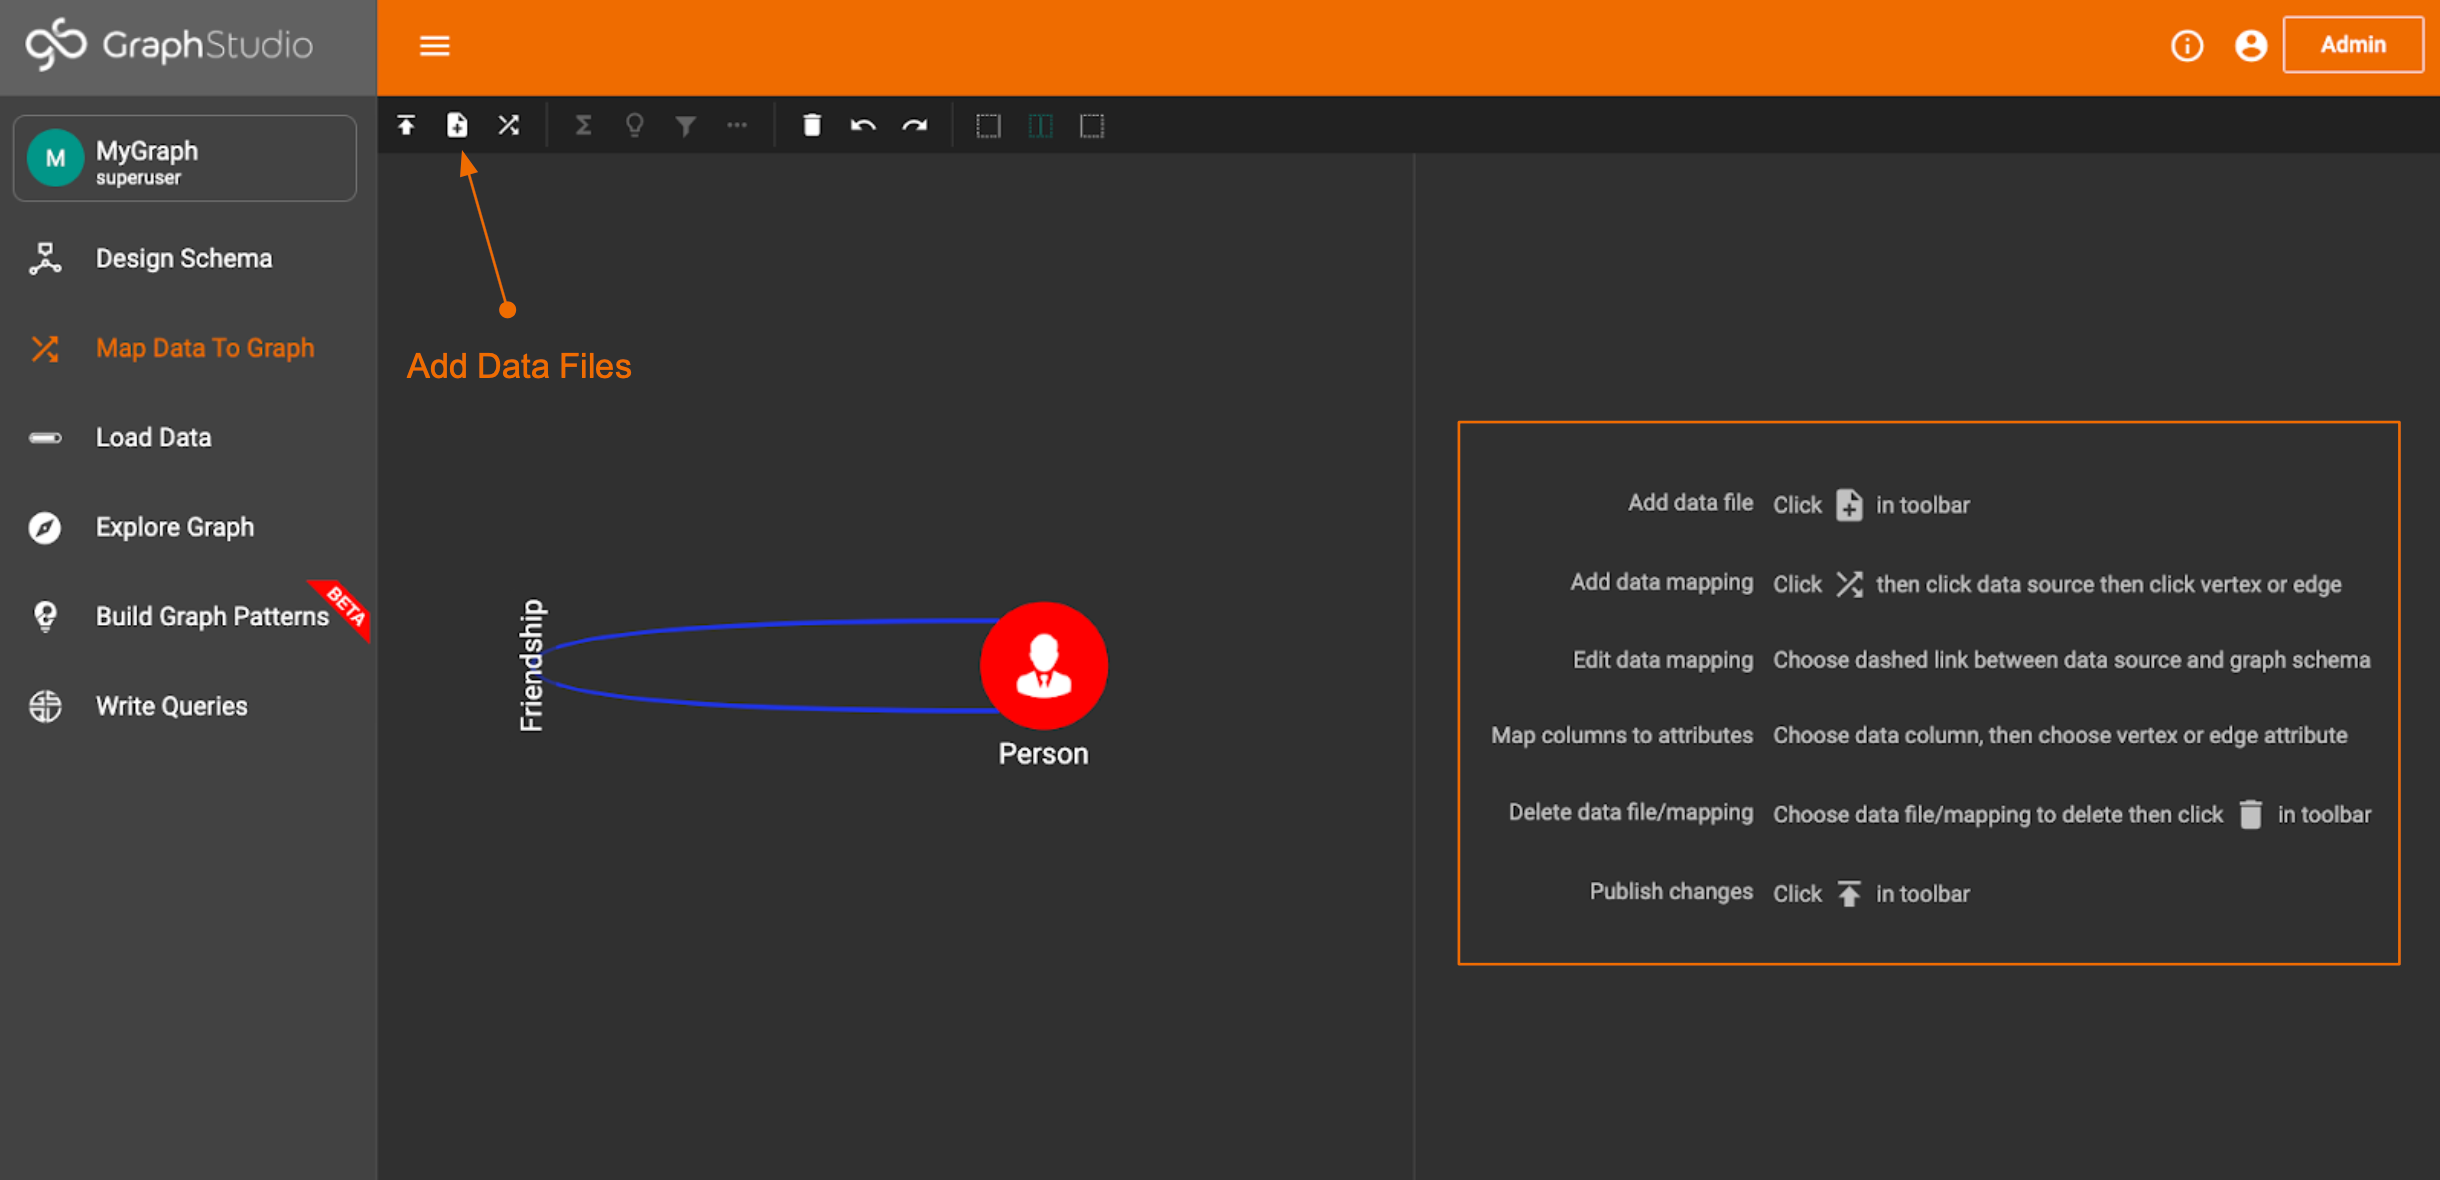
You can then hit the green plus sign to add files from your local computer. The recommended format is a text file (i.e. a CSV or TSV file), but you can also use a zip or tar file. You can also import files from remote storage like an Amazon S3 Bucket.
The files we are using can be found here: https://gofile.io/d/CFuyqu
There are 2 files. One for the Person vertex, and one for the Friendship edge.
Once the data is added you can click on any file to see a preview.
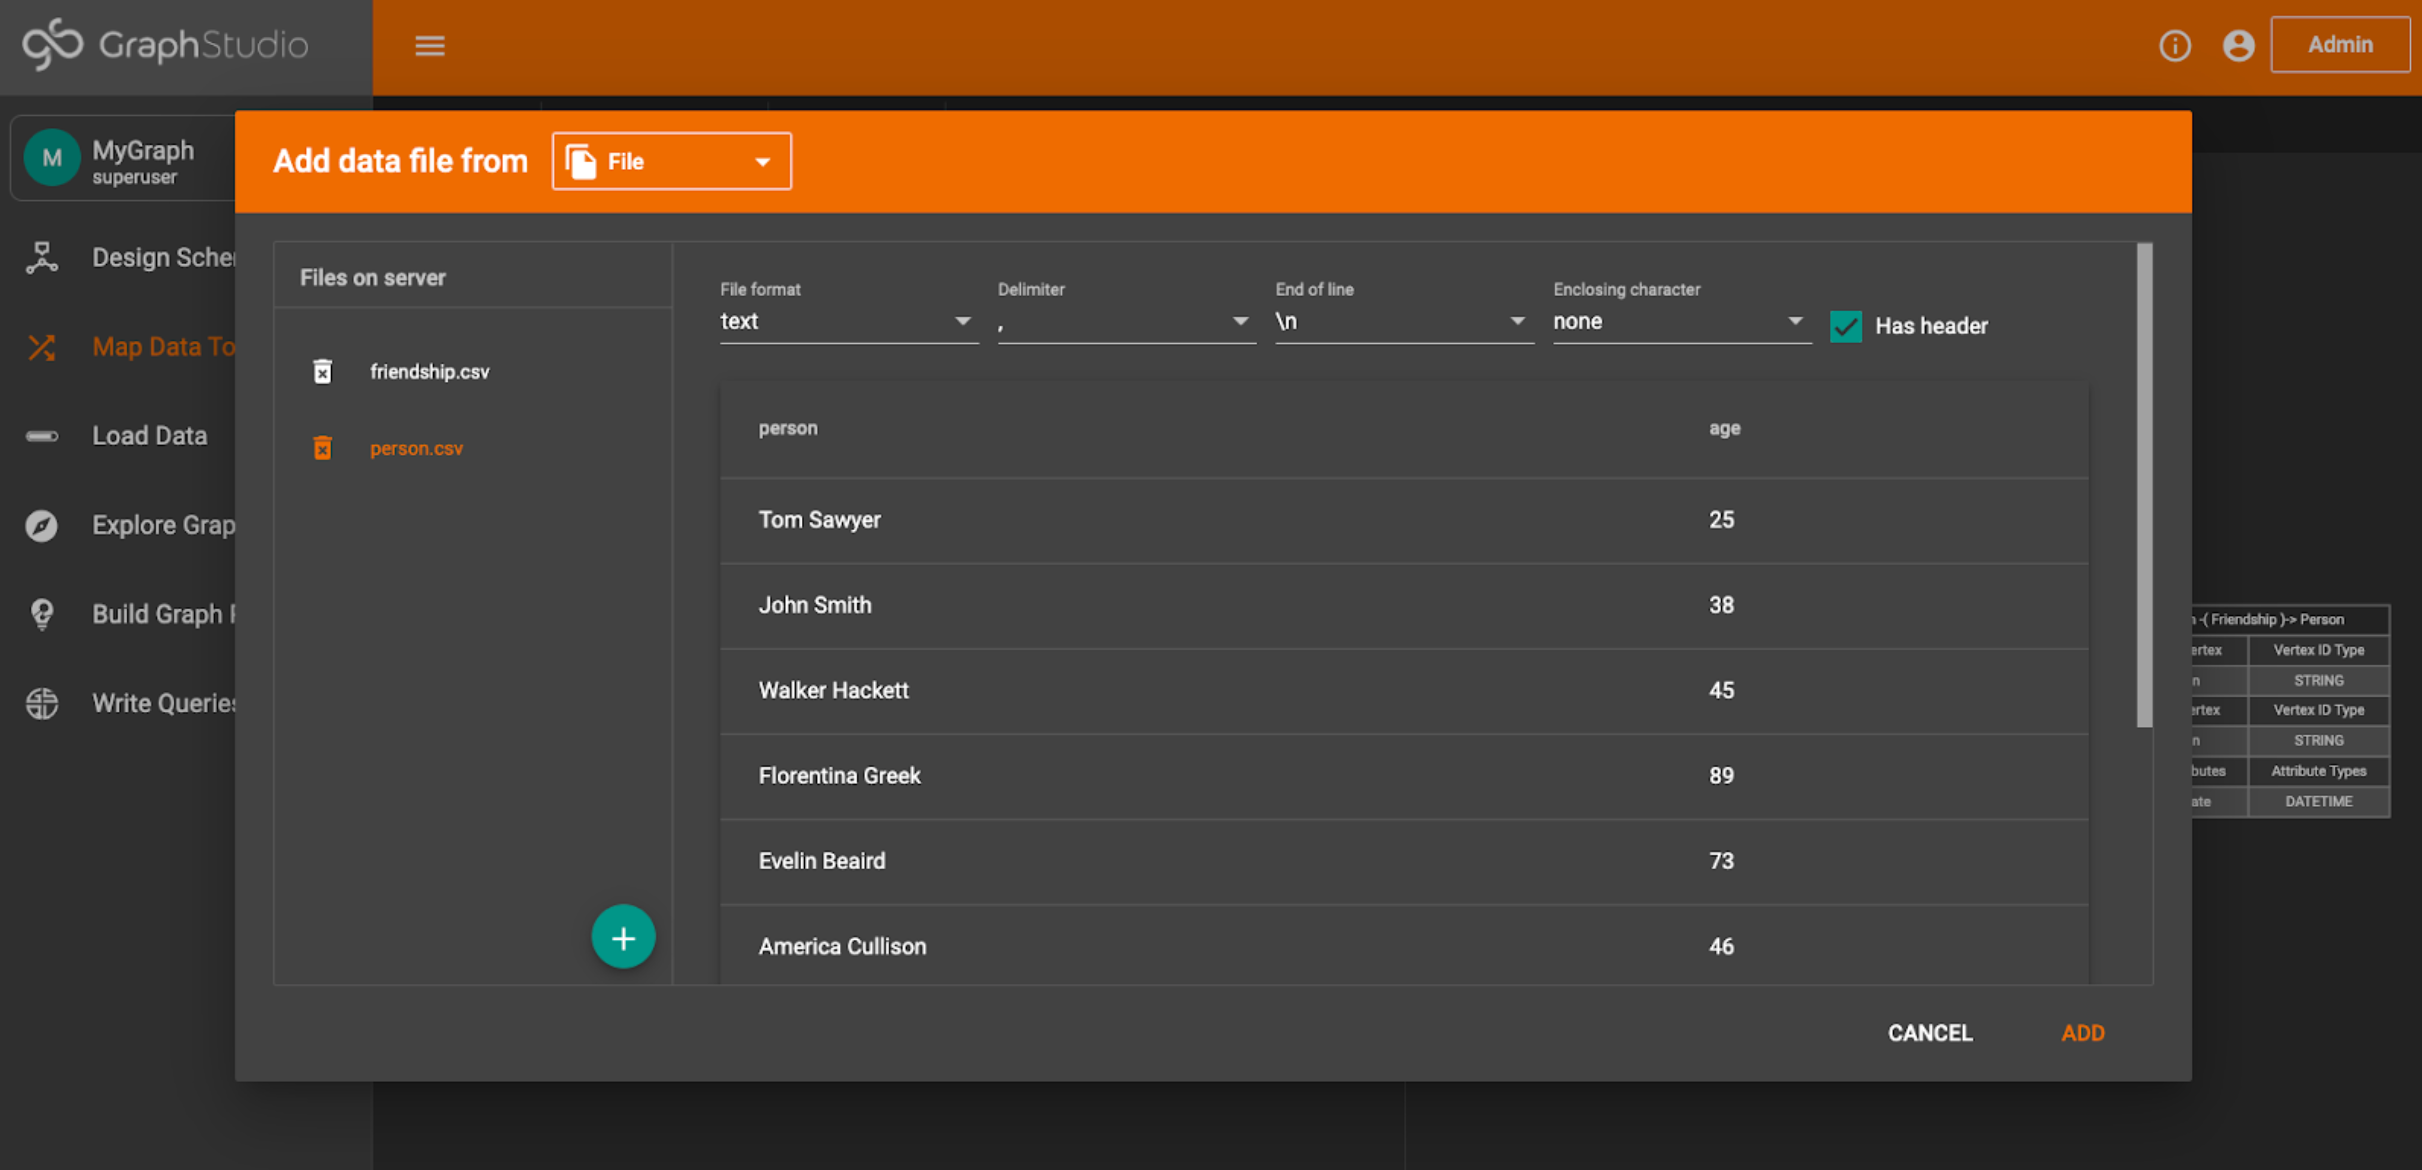
Here you can add constraints to help better format the data. If your data has a header, make sure to hit the Has Header checkbox so that the header isn’t counted as actual data.
If everything looks good, hit Add. The file will now appear on the screen next to the graph schema.
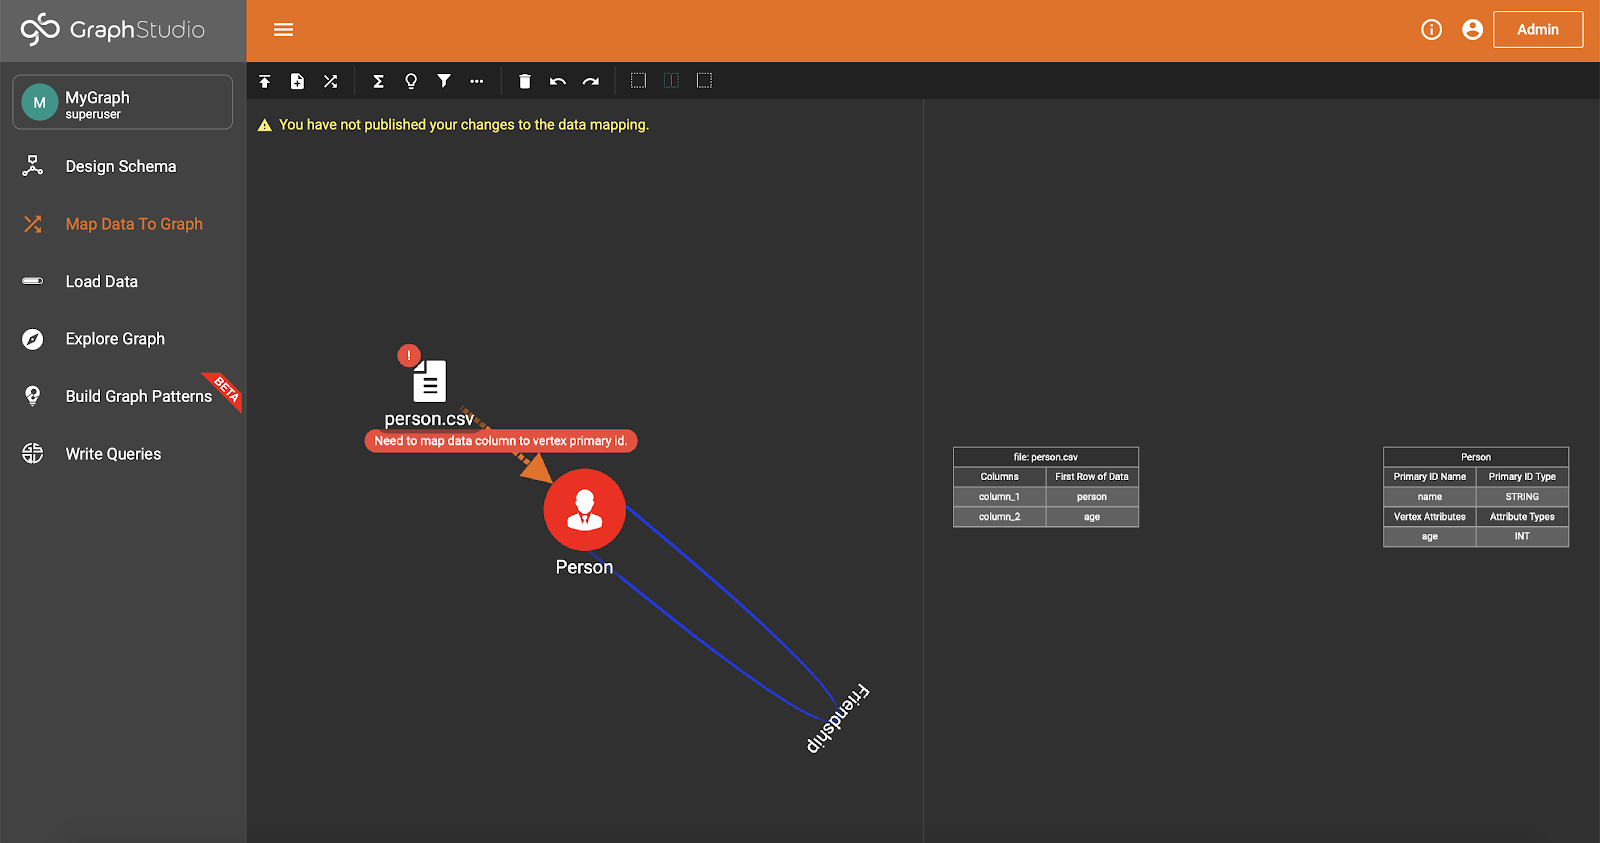
Now, hit the crossed arrows icon in the toolbar, and then select the file and the vertex or edge you want to map it to. For example, select the person.csv and then select the Person vertex.
The resulting screen should look something like this:
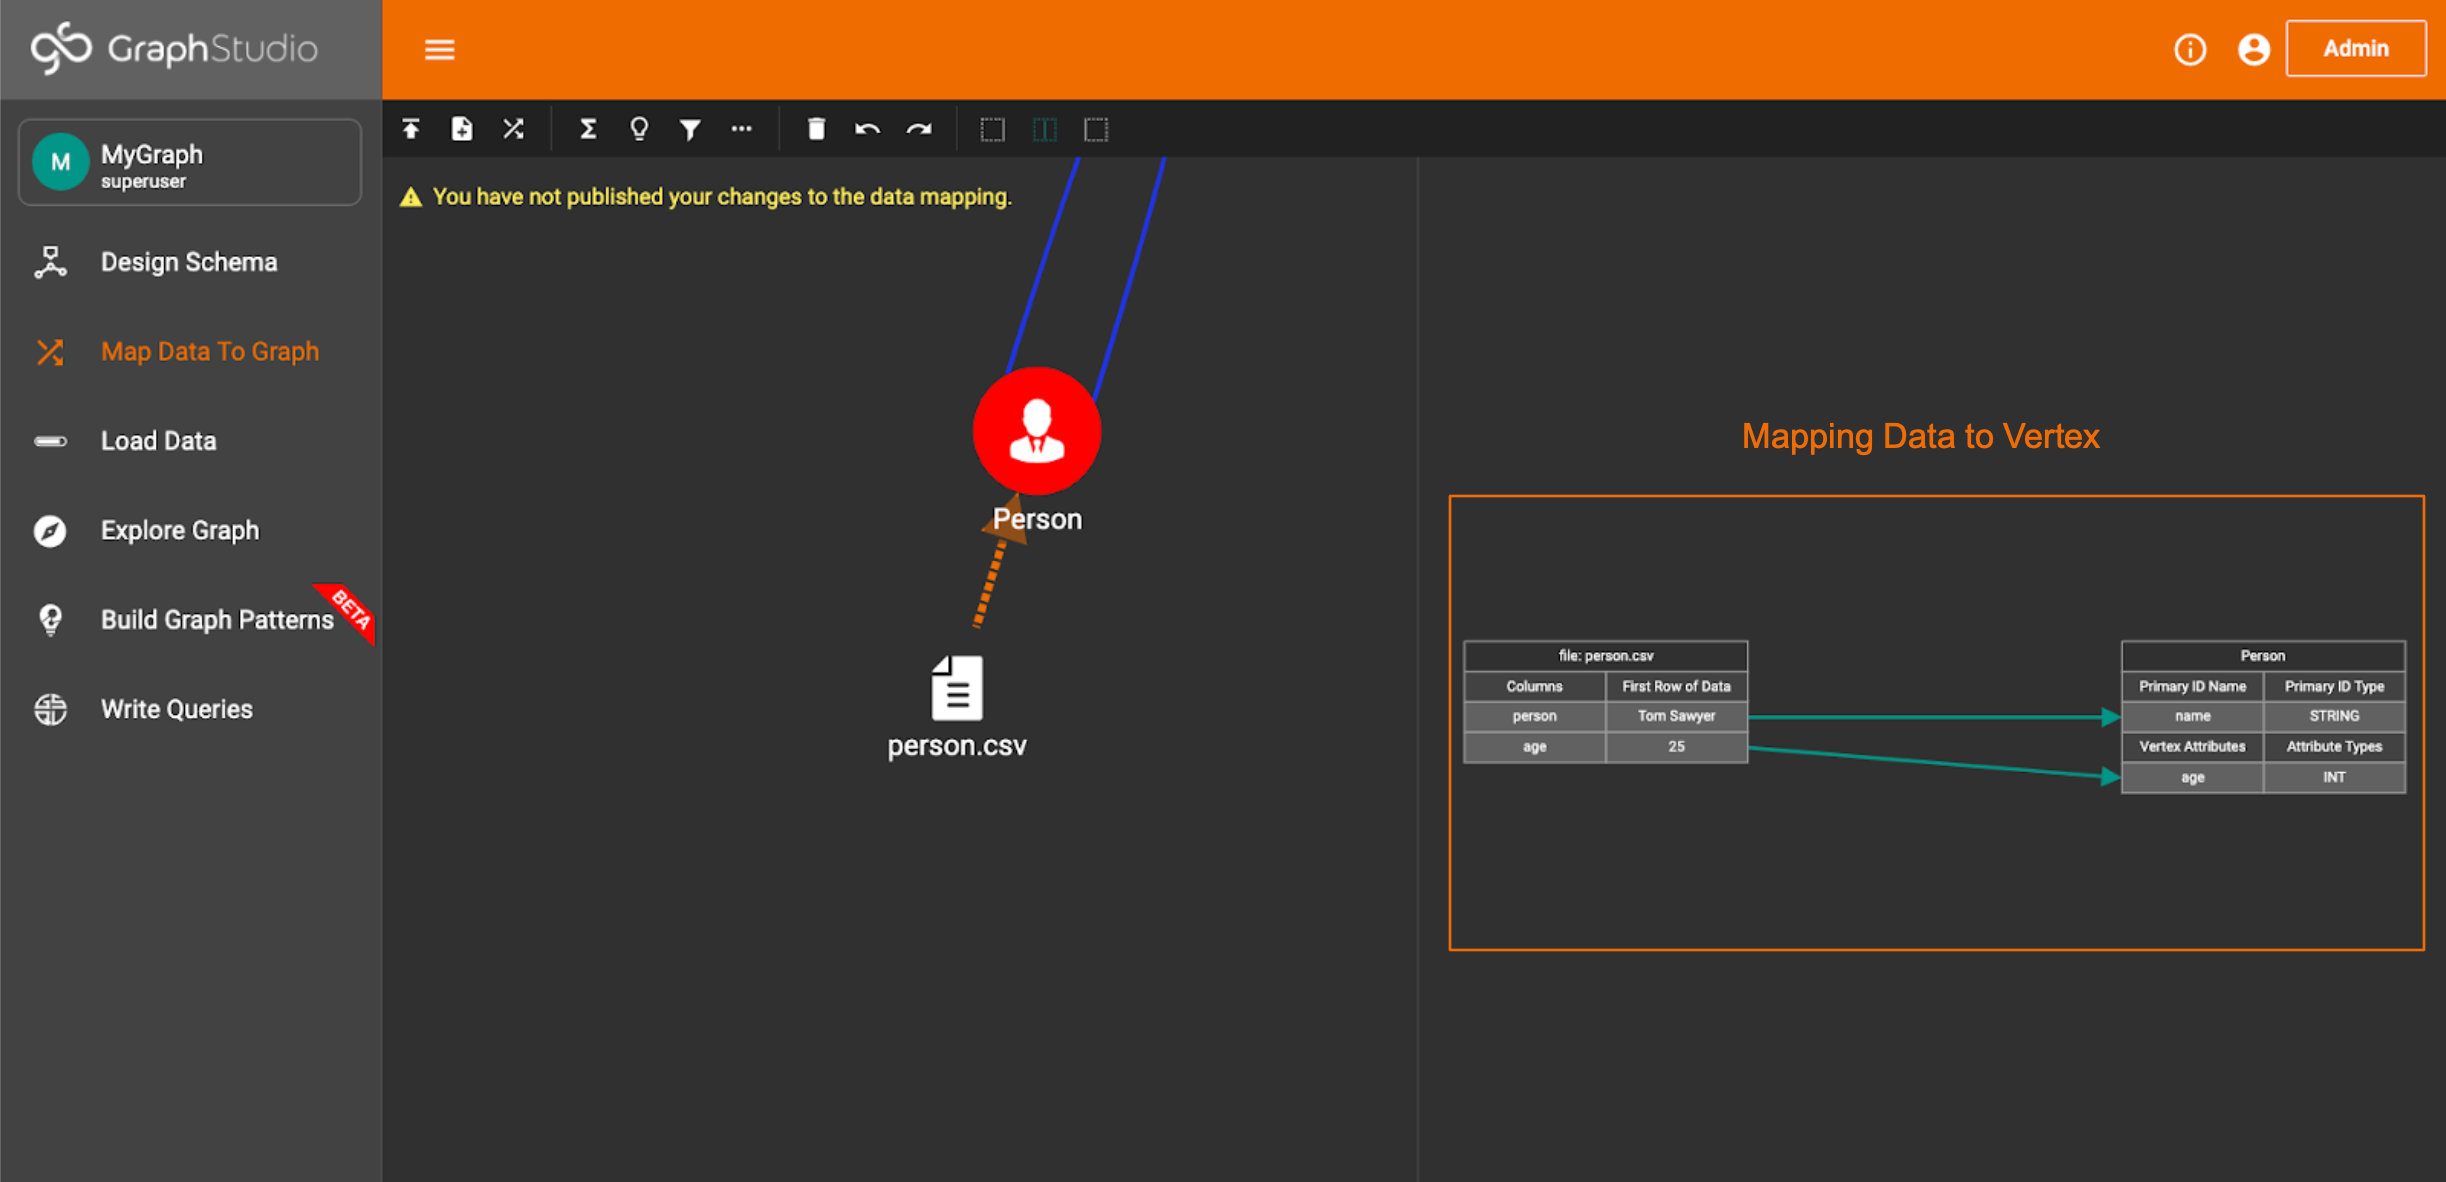
Now comes the tricky part. You need to connect the corresponding columns from the Person.csv file to the values on the Person vertex. You don’t need to map all values, but at the very least the primary ID must be filled. In our case, the vertex matches perfectly with the file. Once the mapping is done, the screen should look something like this.
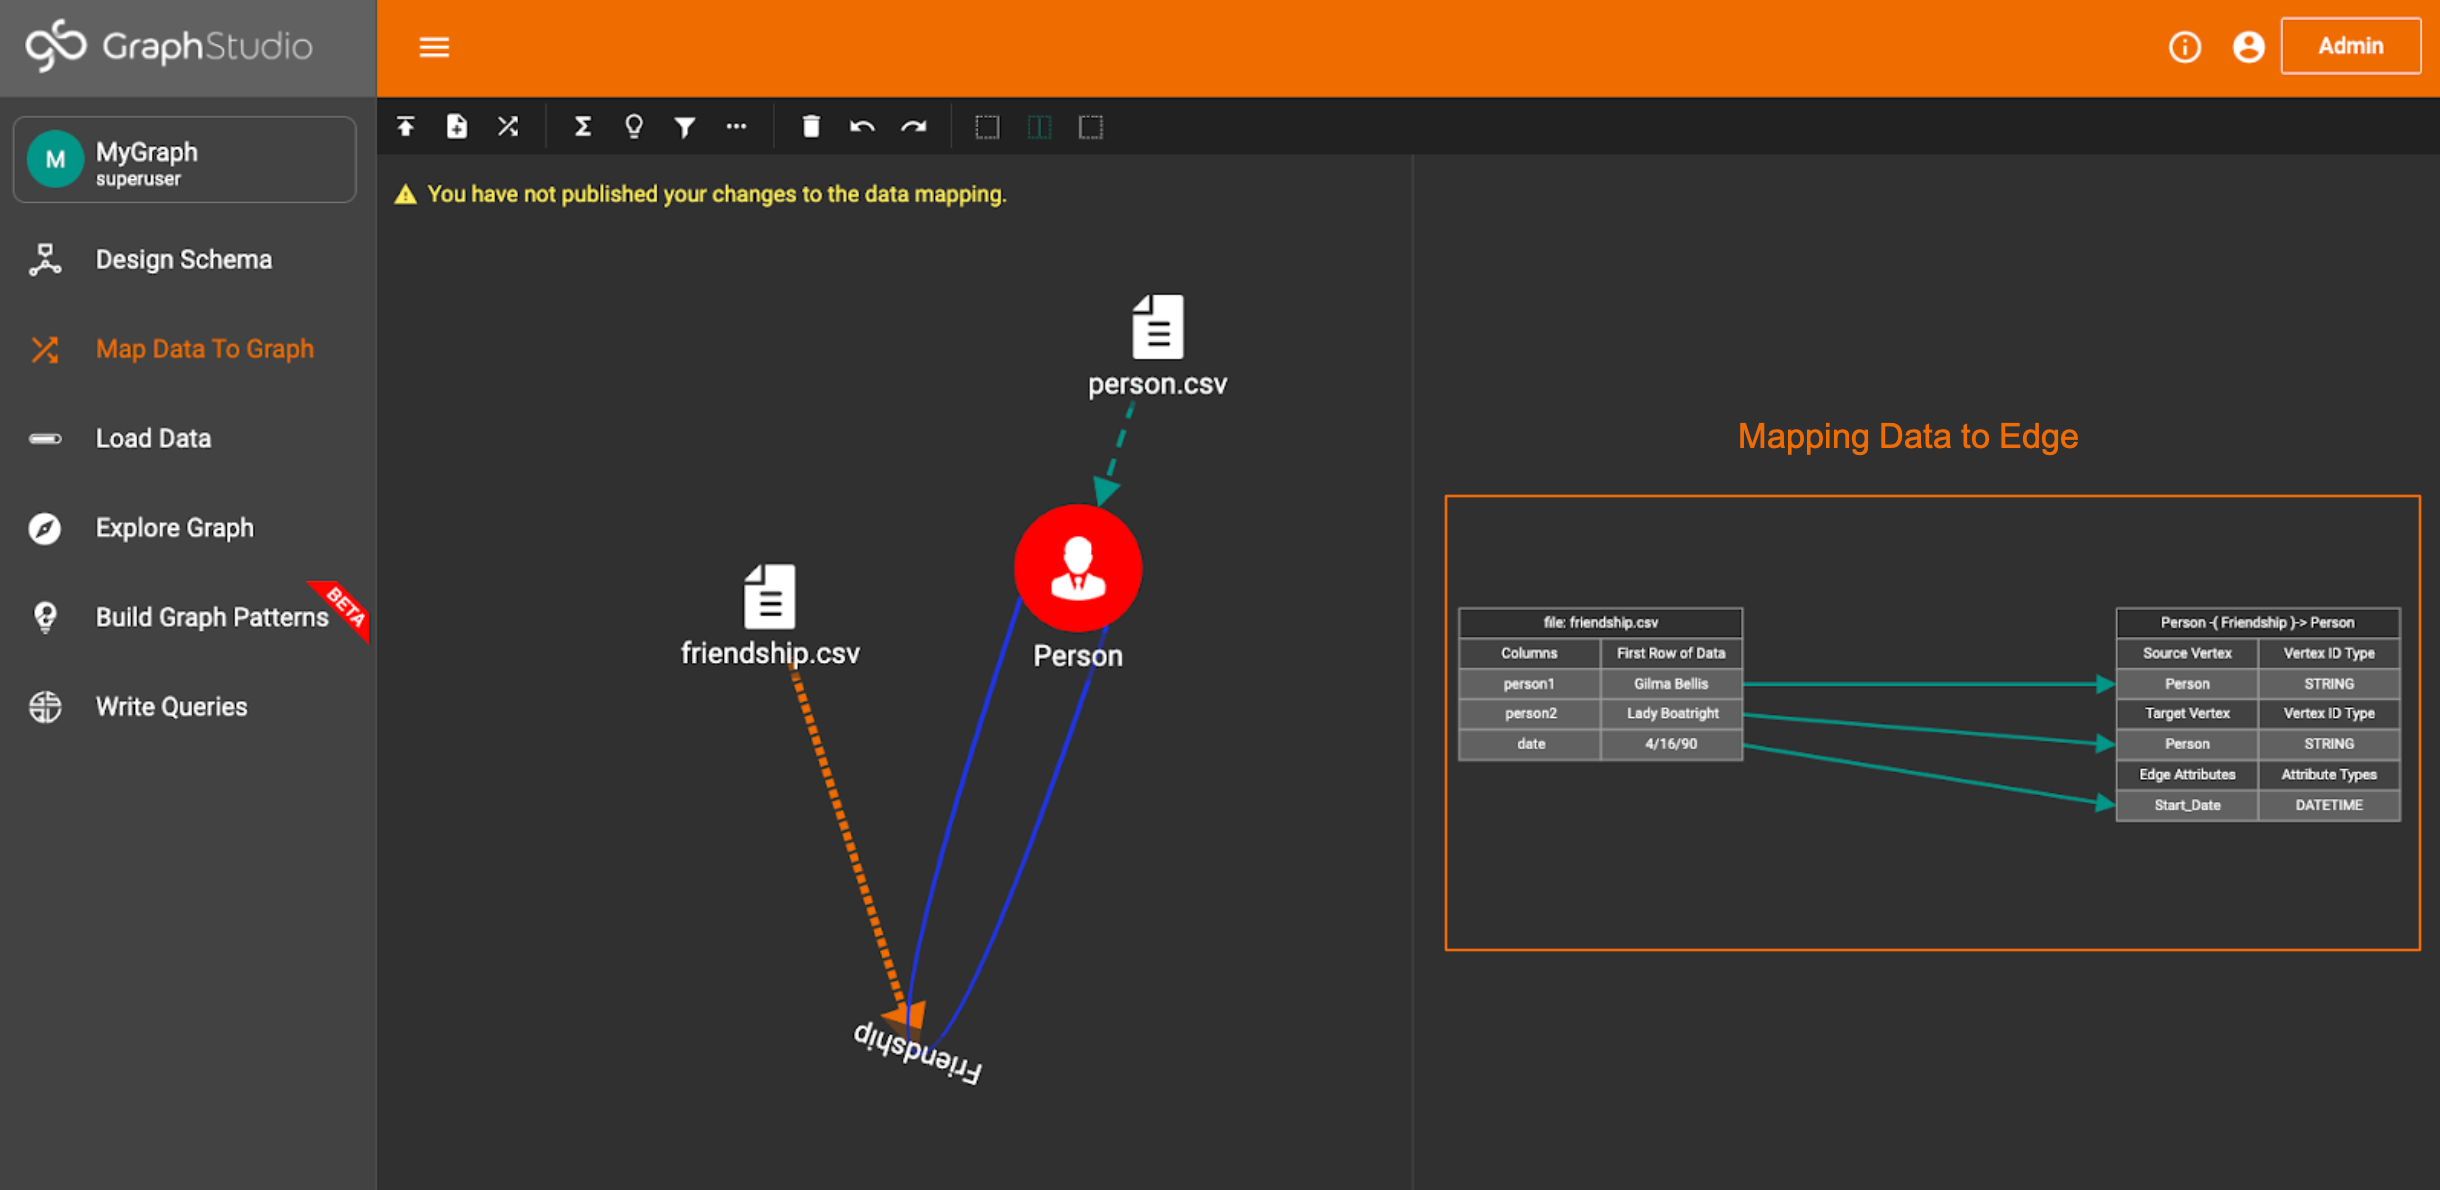
Now, repeat for the Friendship.csv file. See if you can figure this one out on your own. If not, don’t worry. It’s a tough process, and it might take multiple attempts to get it right.
It should look like this.
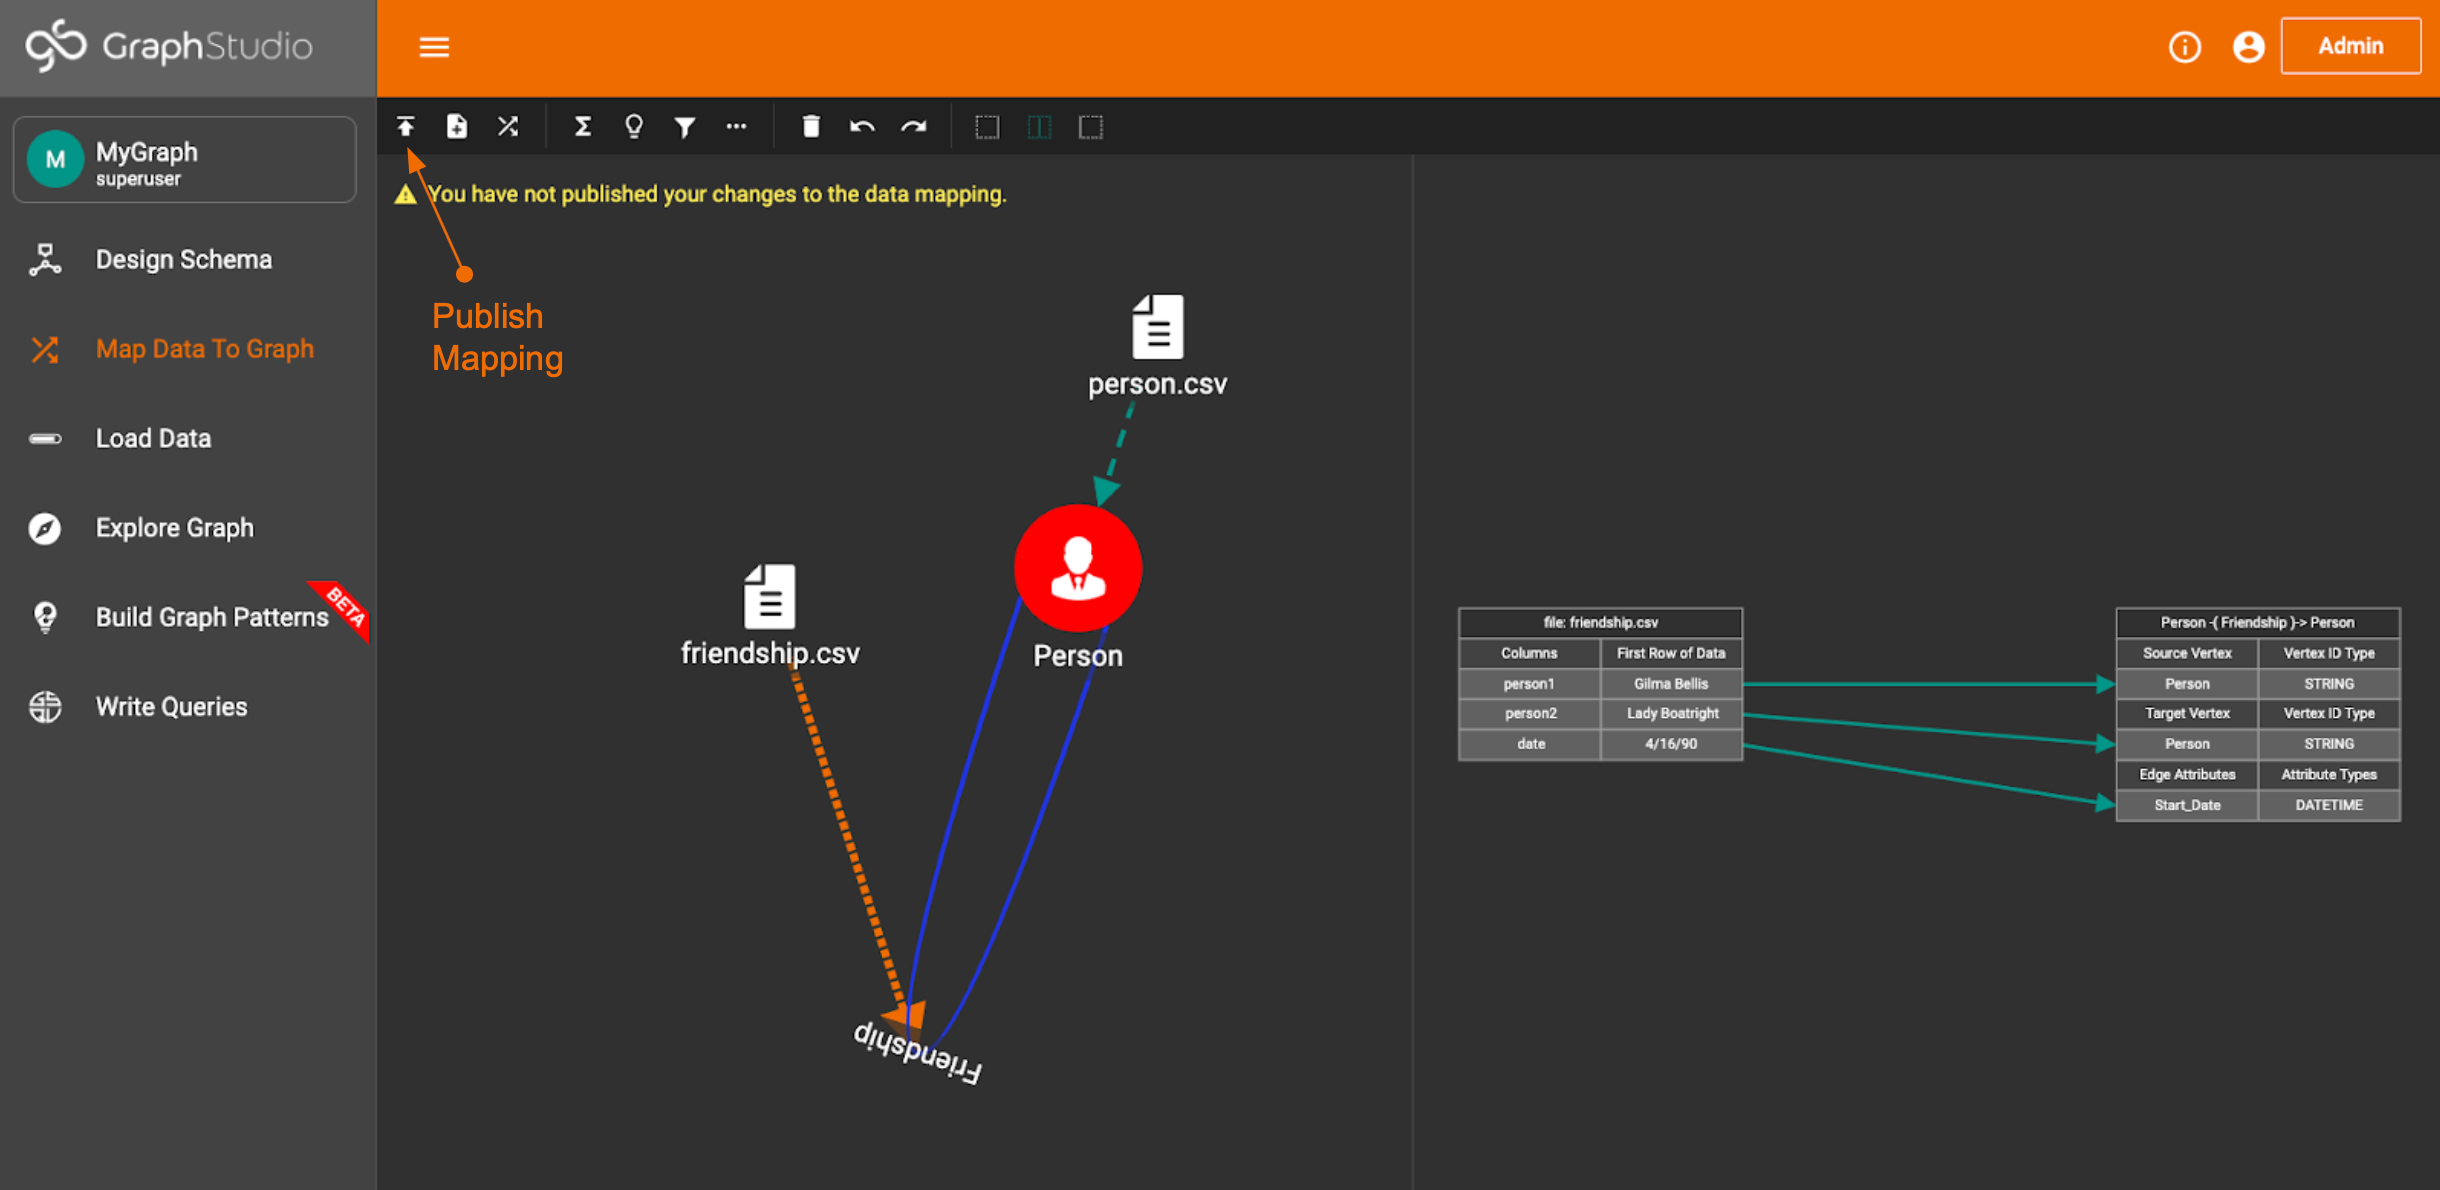
Finally, make sure to Publish your mapping and save your hard work.
Note: If you’re thinking “wow this is tedious”, don’t worry! GraphStudio is just a GUI on top of functionality that can be executed with pure code. We’ll cover this idea in great detail in the GSQL scripting section of this guide.
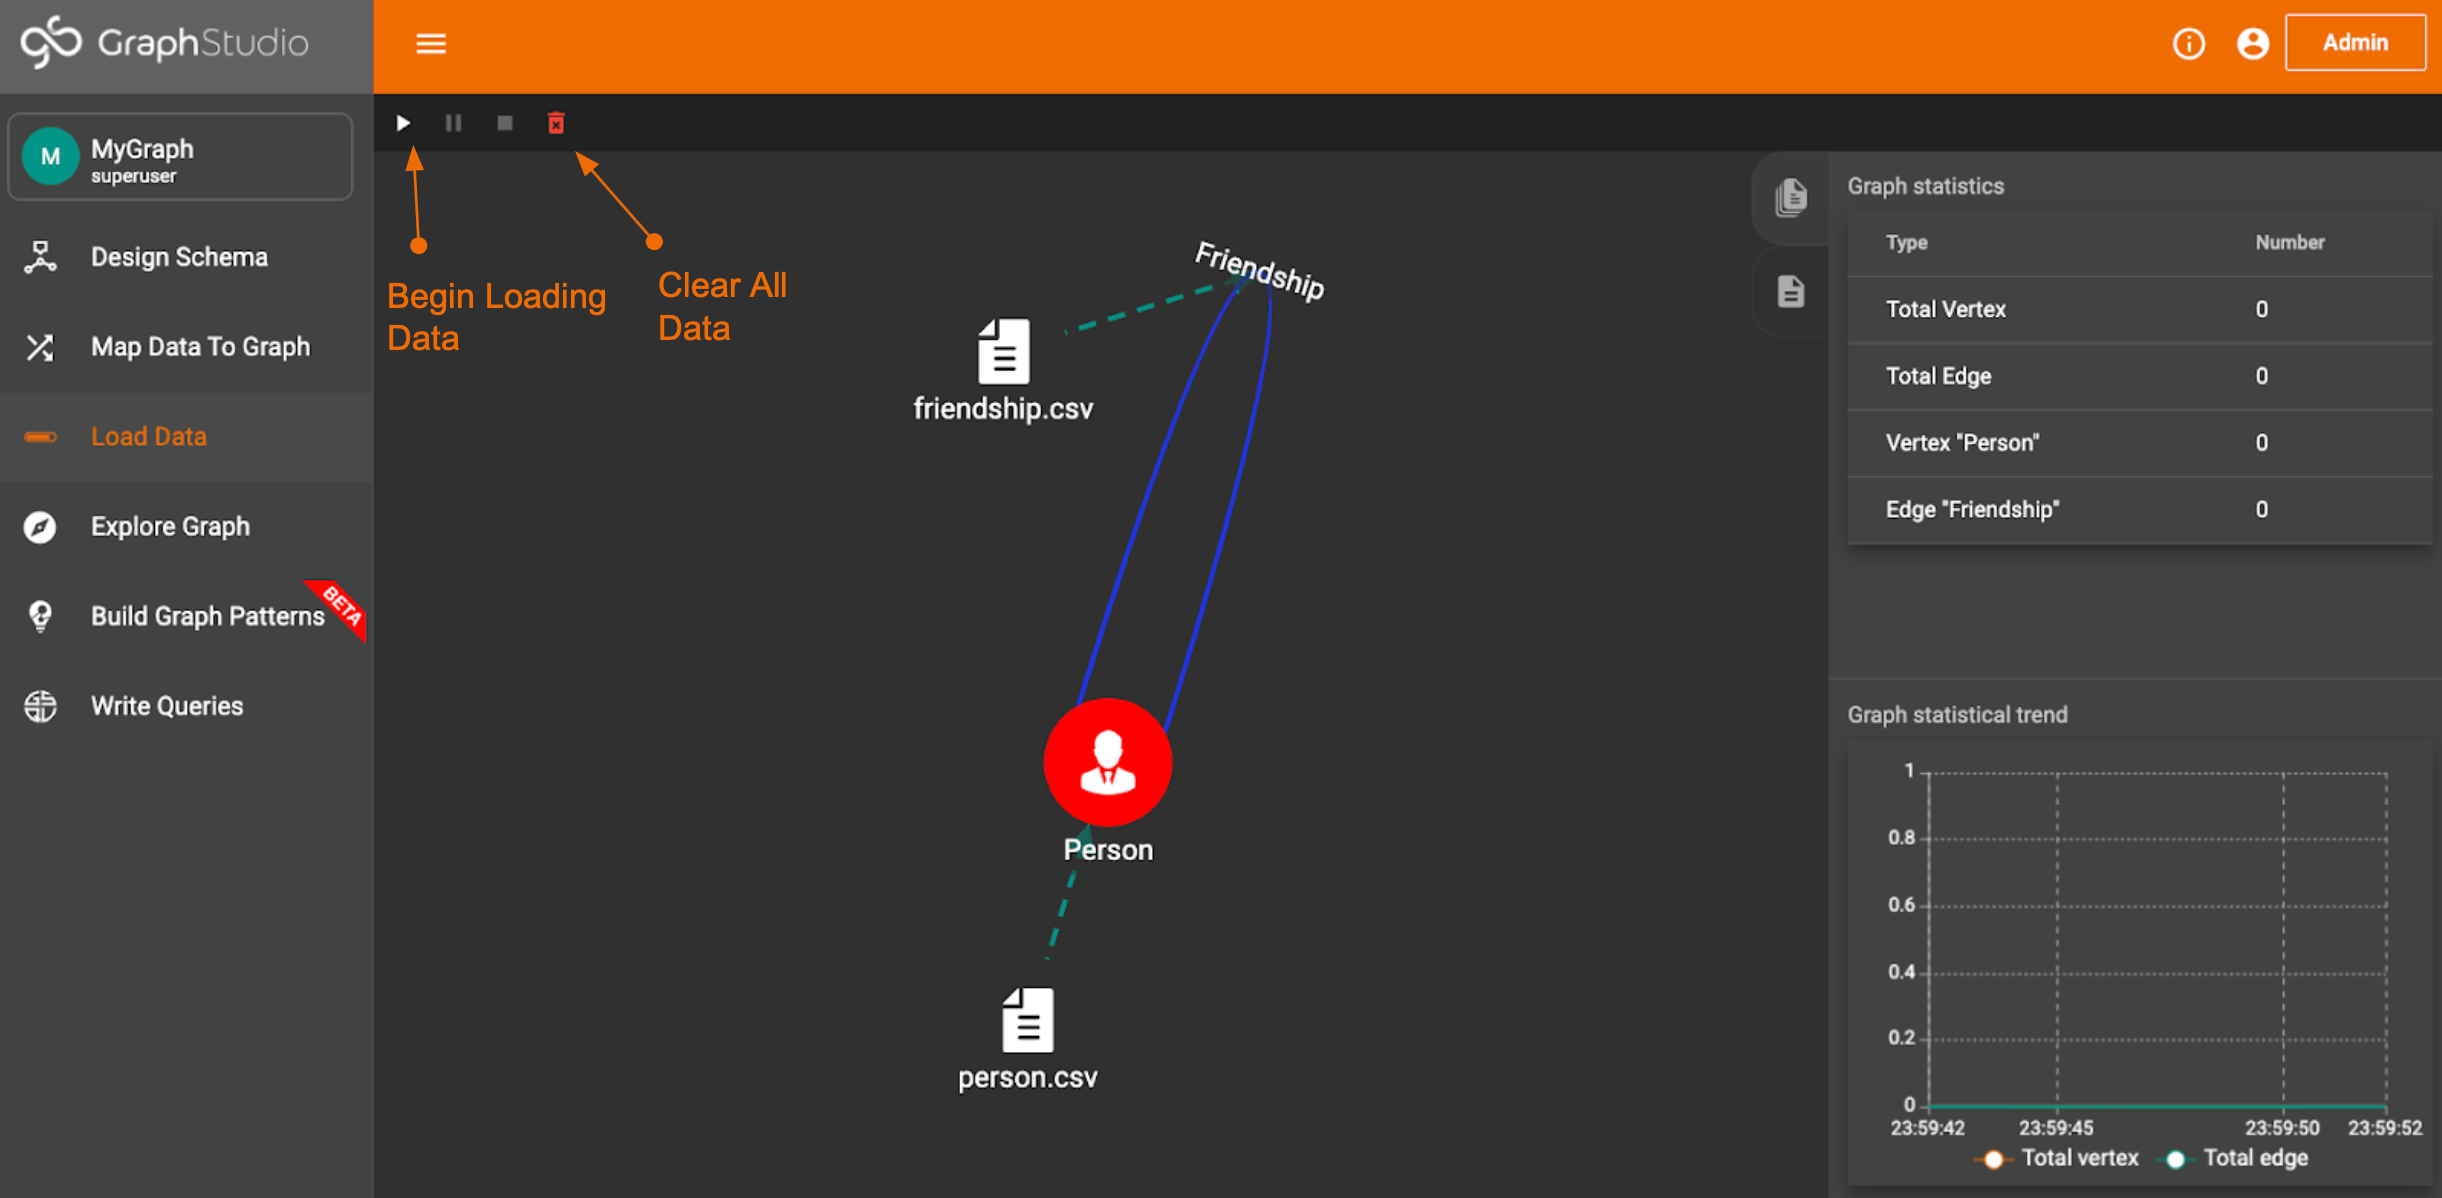
Load Data
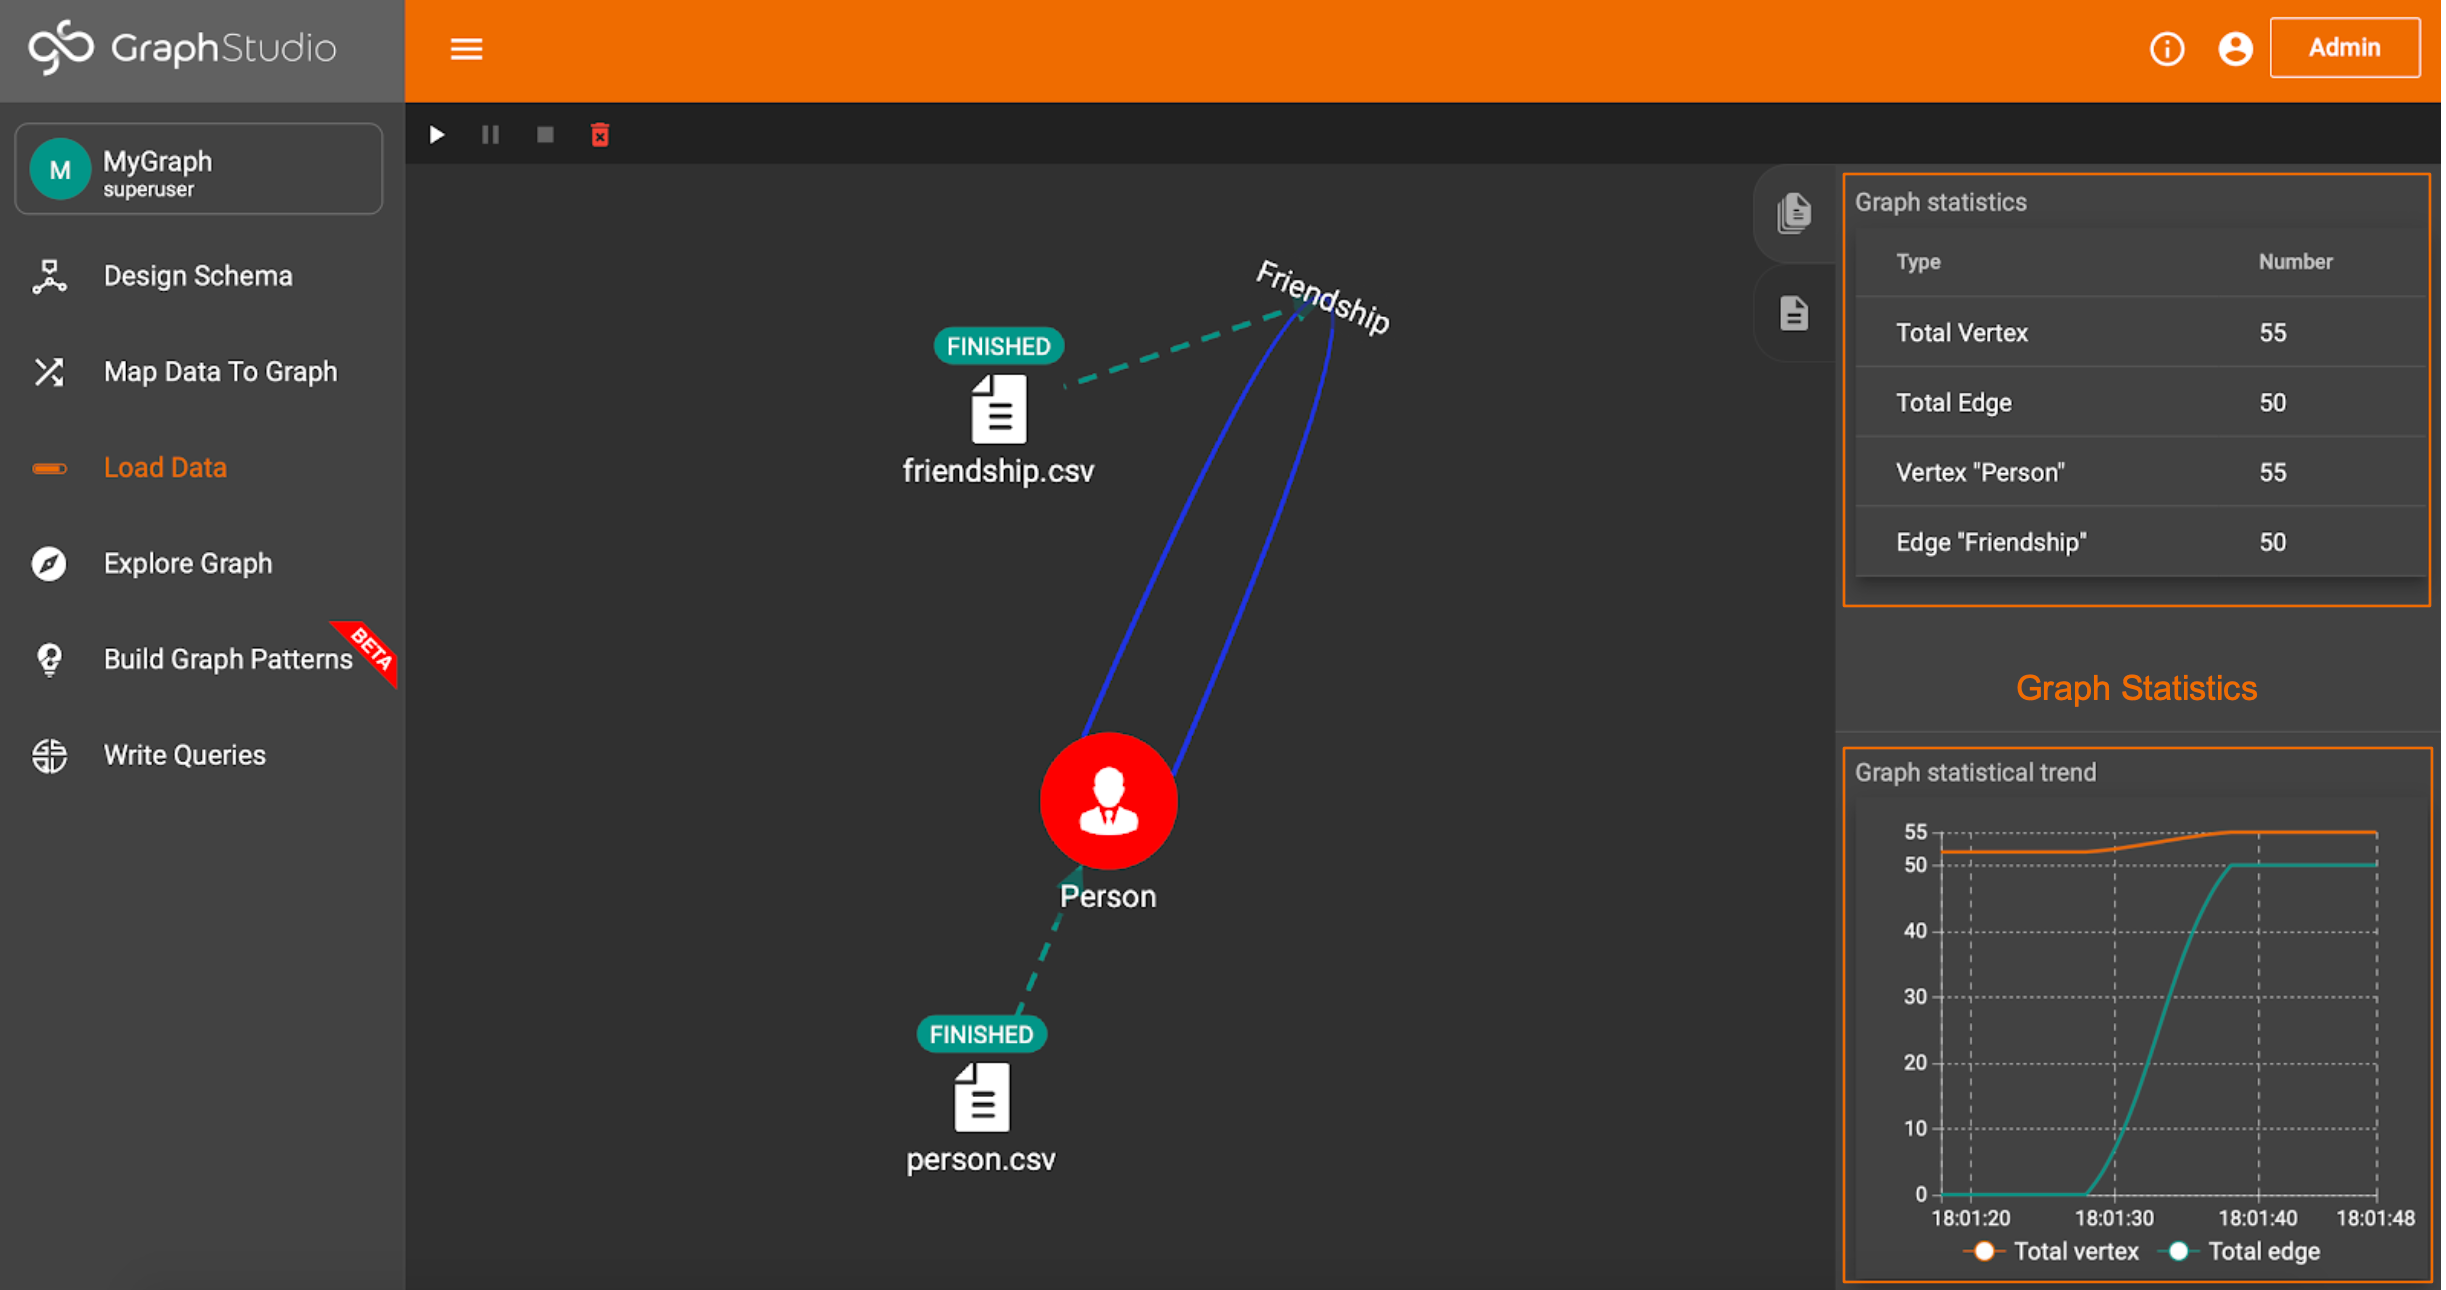
Once your data is mapped, loading it is very straightforward. In the Load Data tab, click the play button to start loading the data into the graph.
Once the loading job is complete, you will see the updated graph statistics on the right-hand side.
Explore Graph
Explore Graph is one of the coolest features of GraphStudio. In this window, you can visually explore any data in the graph. You can search for specific vertices, find vertex connections, and find paths between vertices, and run custom queries.
Before that, we should get familiar with the layout. The top toolbar has lots of helpful configuration options (refer to the image below).
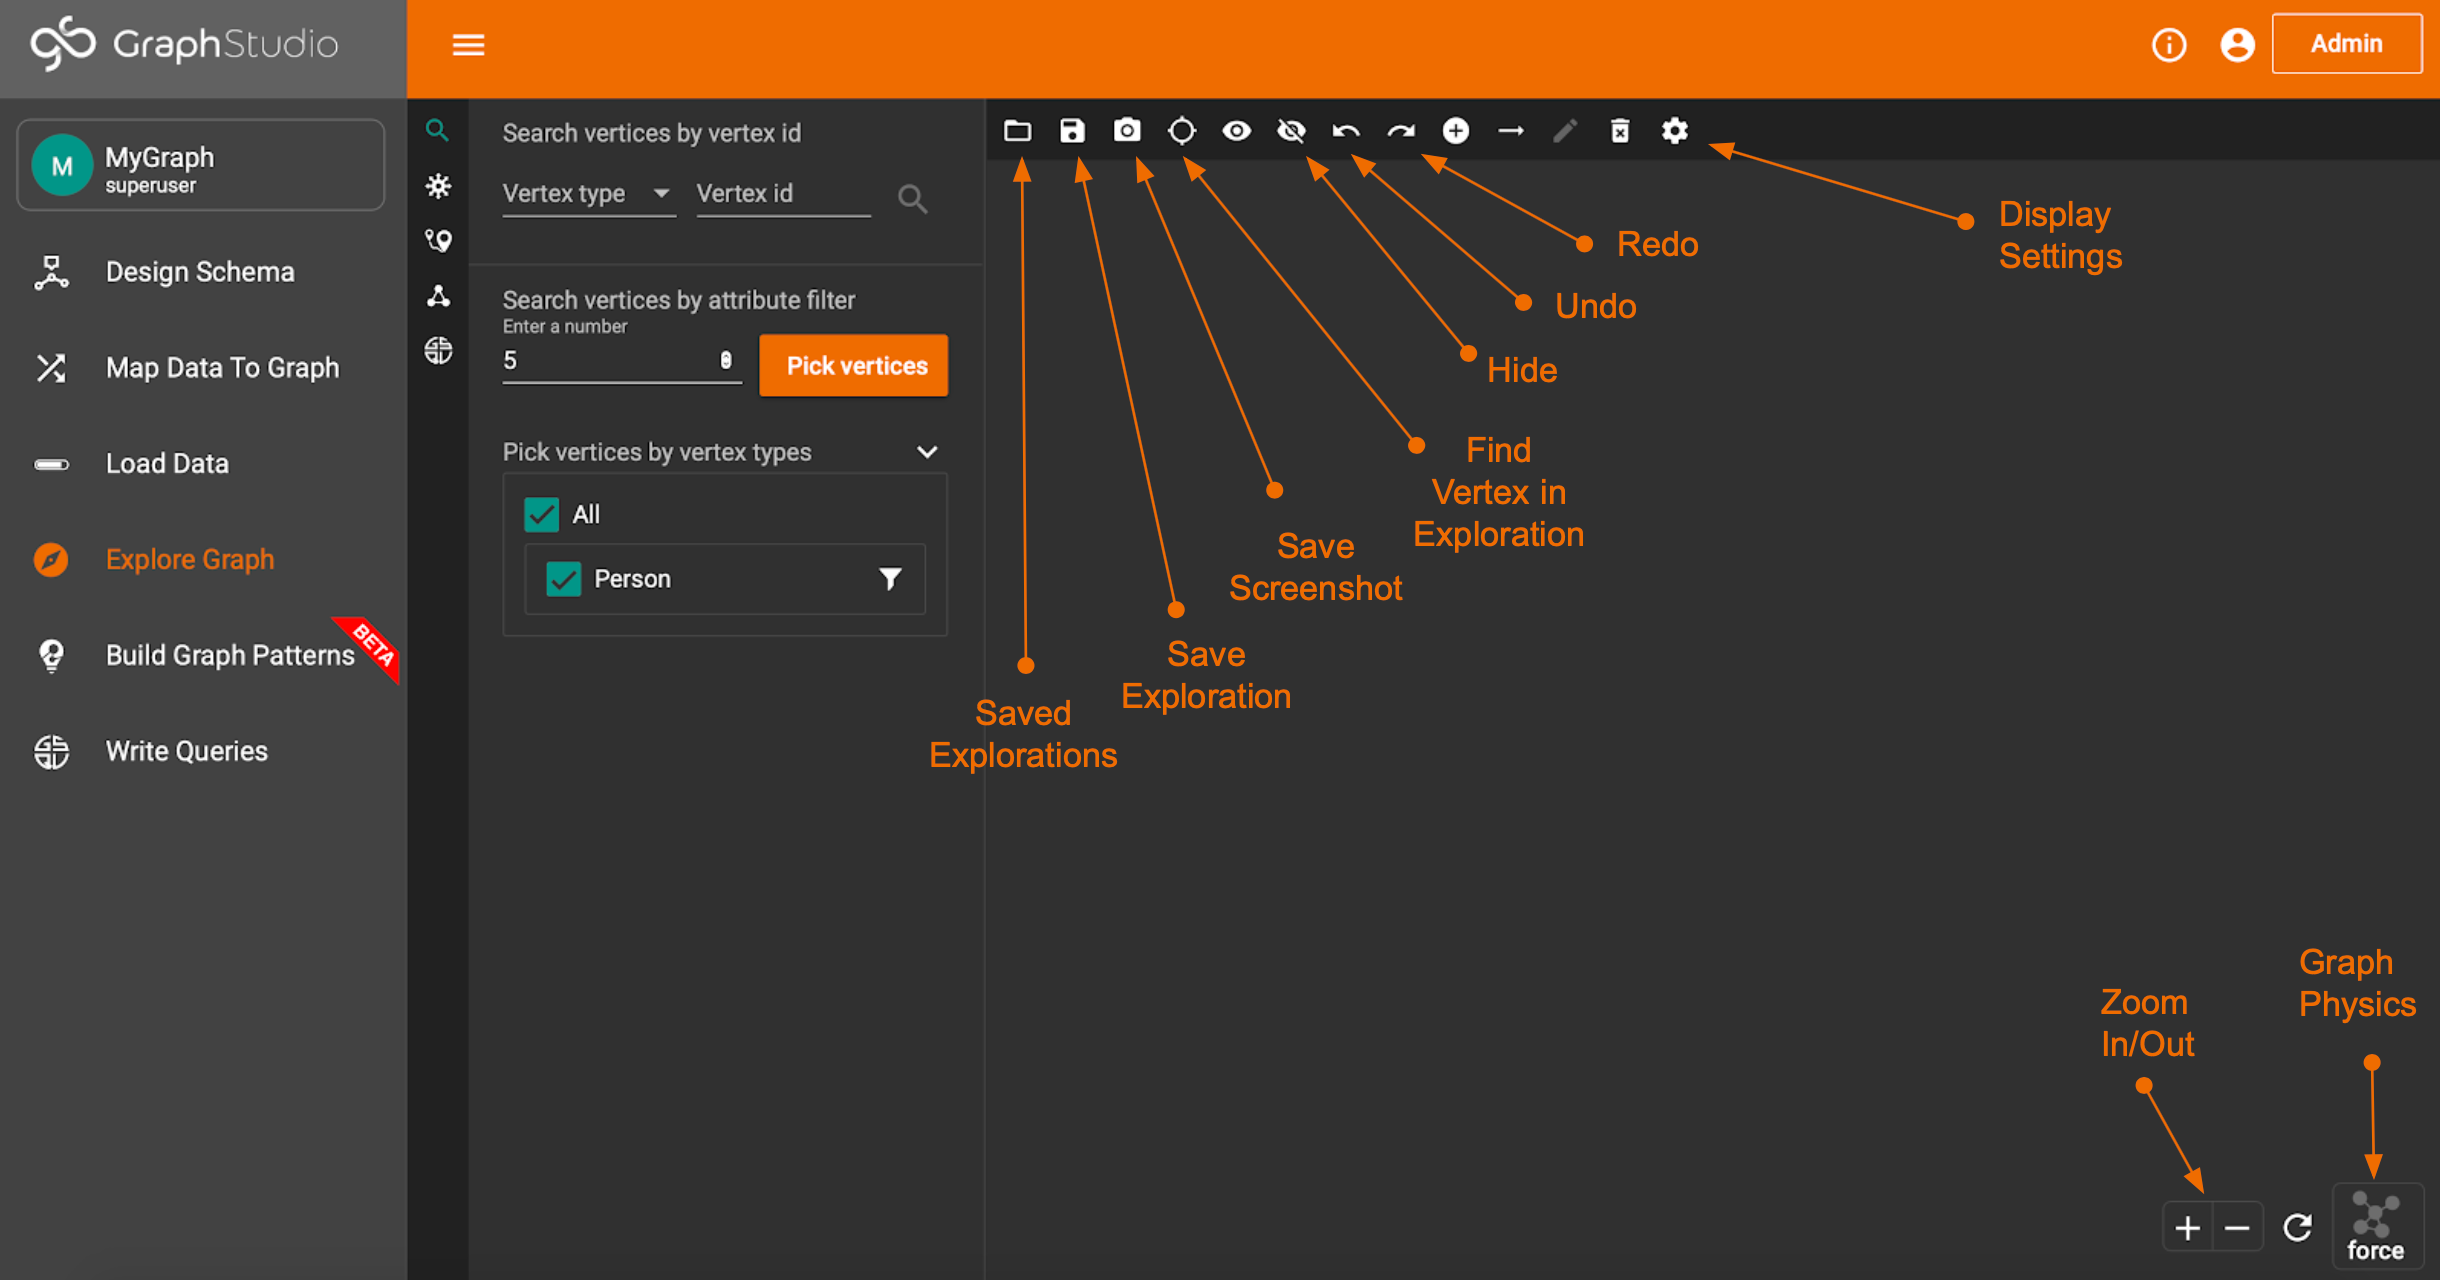
The sidebar is where you can find the different exploration options.
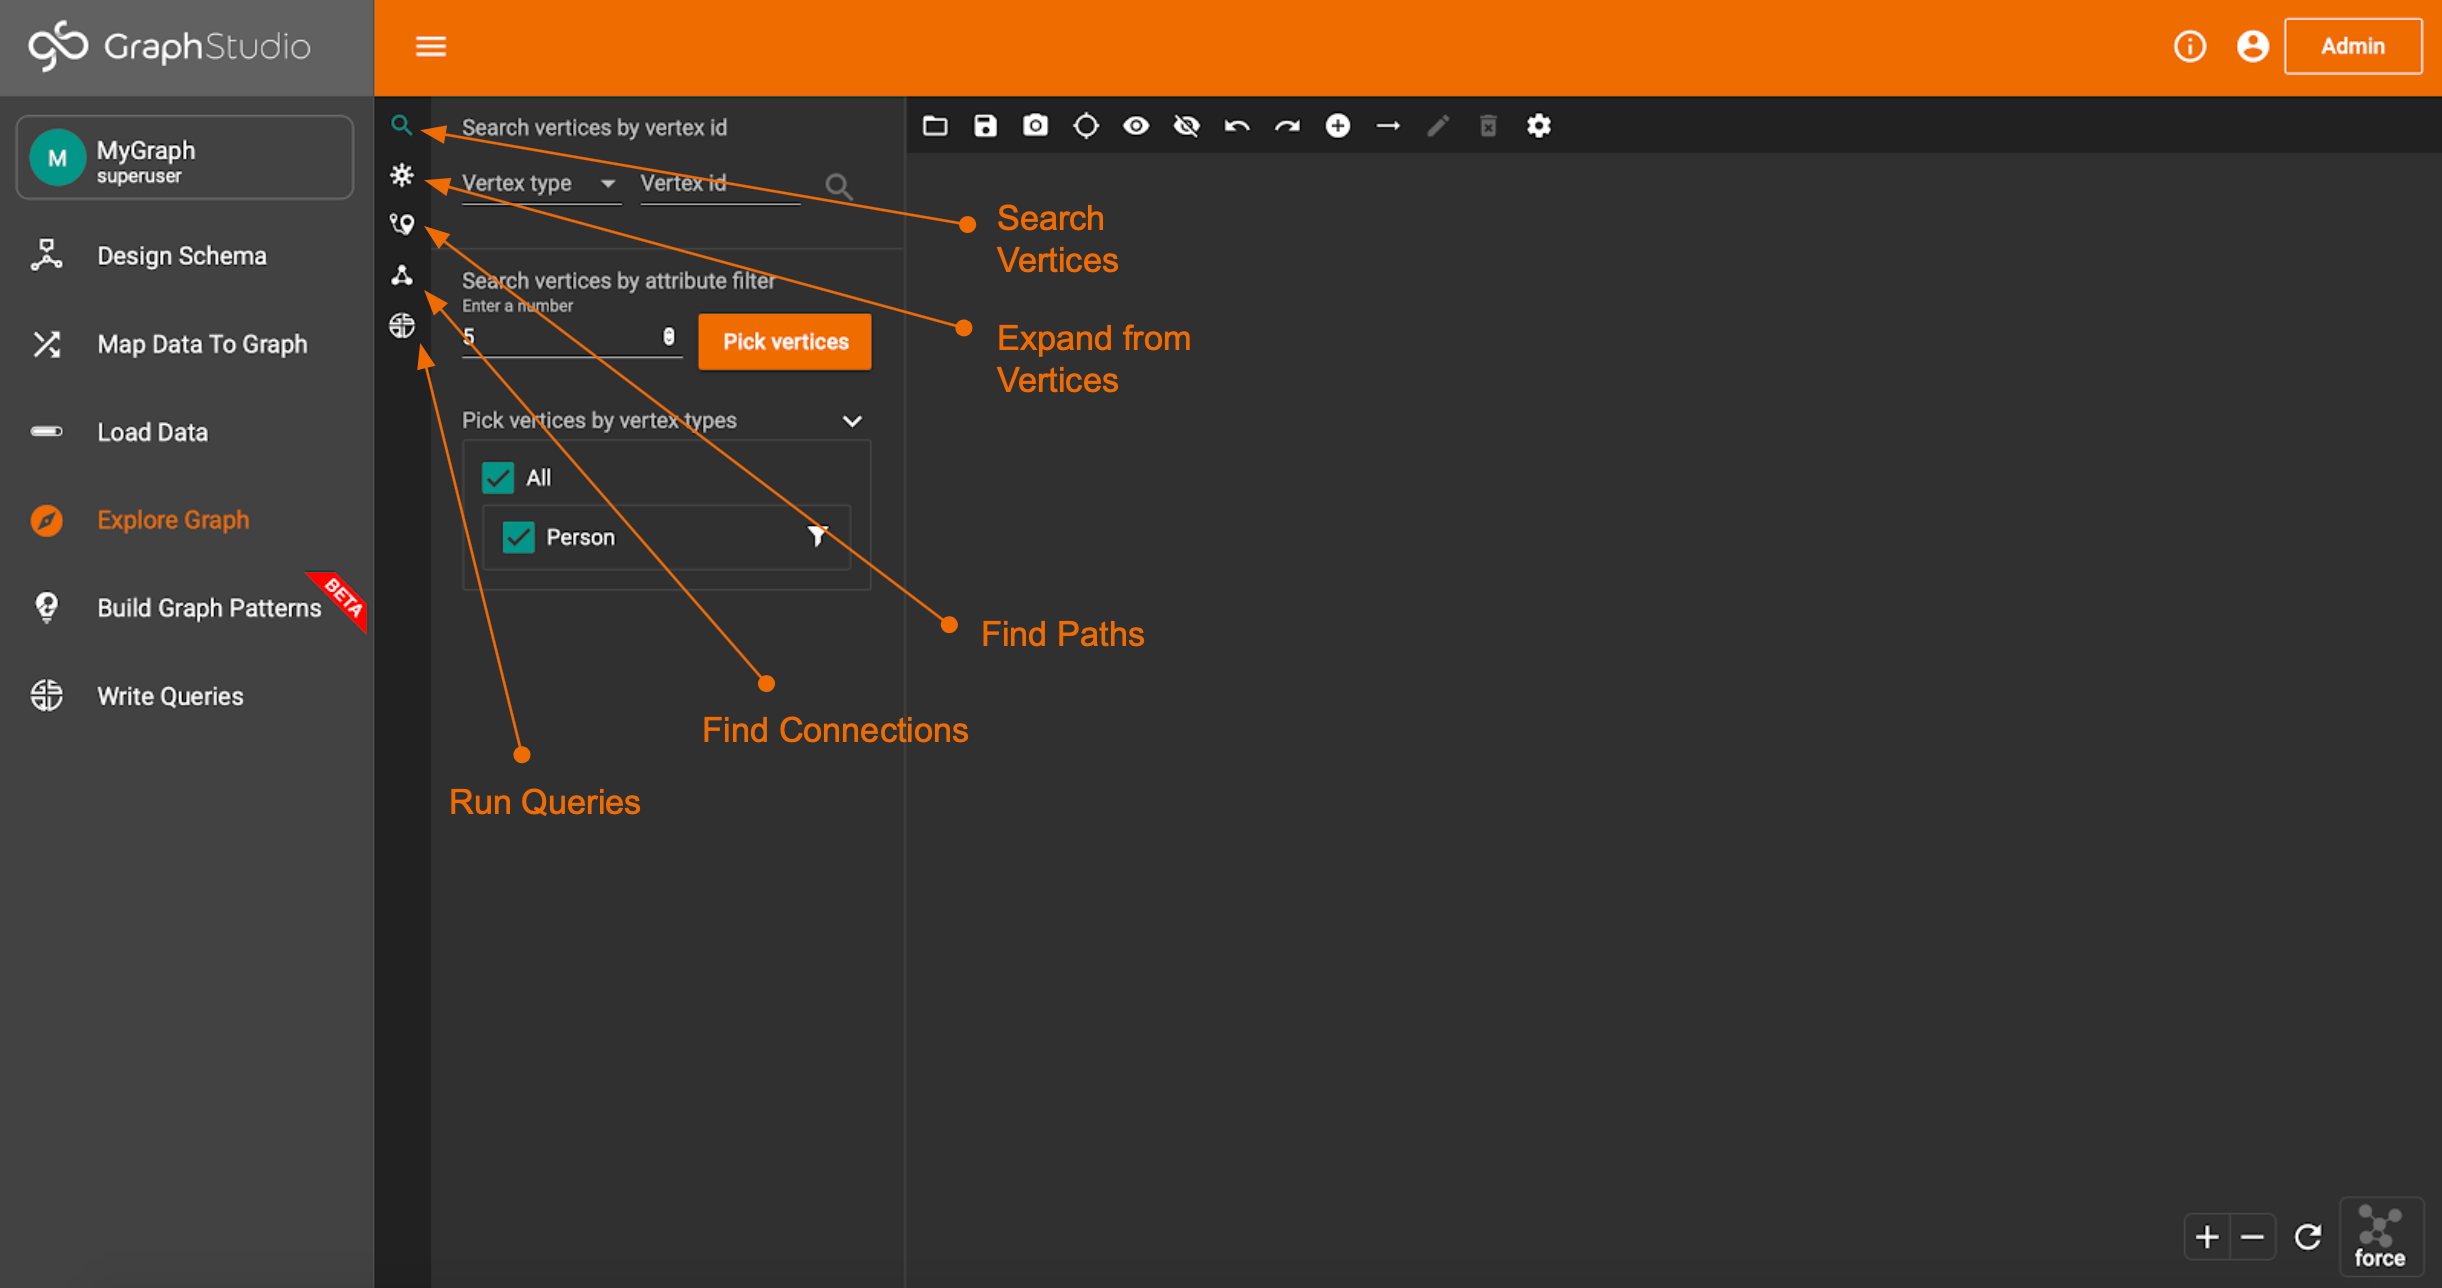
Let’s start with Search.
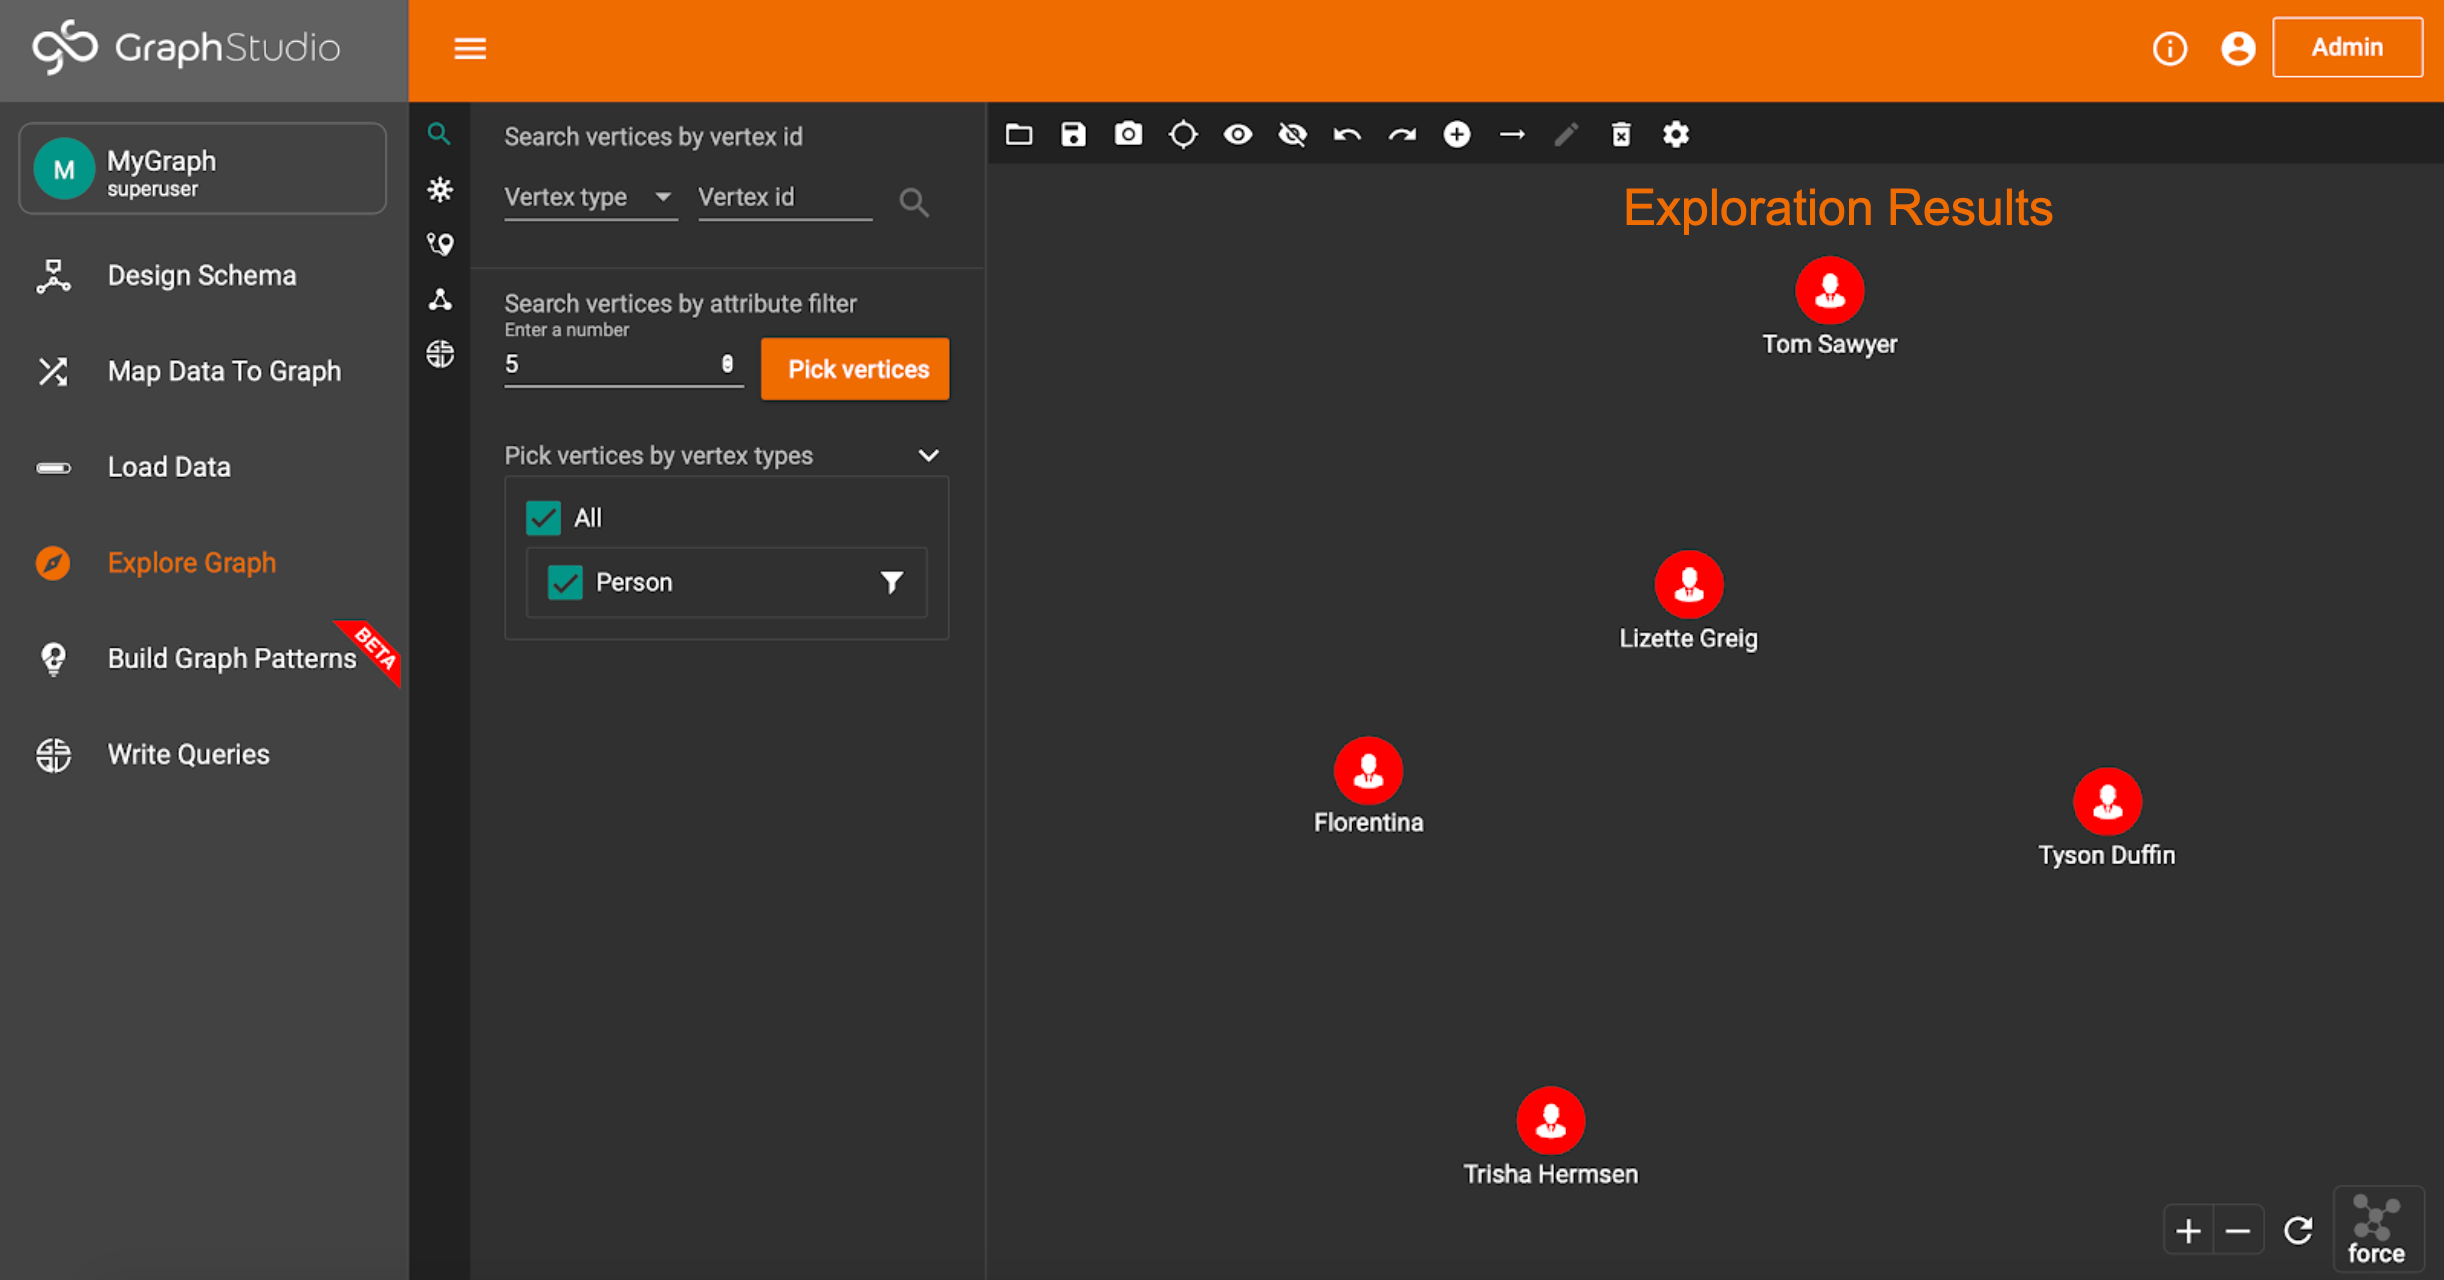
On this page, you can look for a specific vertex (if you know the vertex ID) or search for vertices of a certain type (we only have one type in this case).
Once you search, the resulting vertices will pop up.
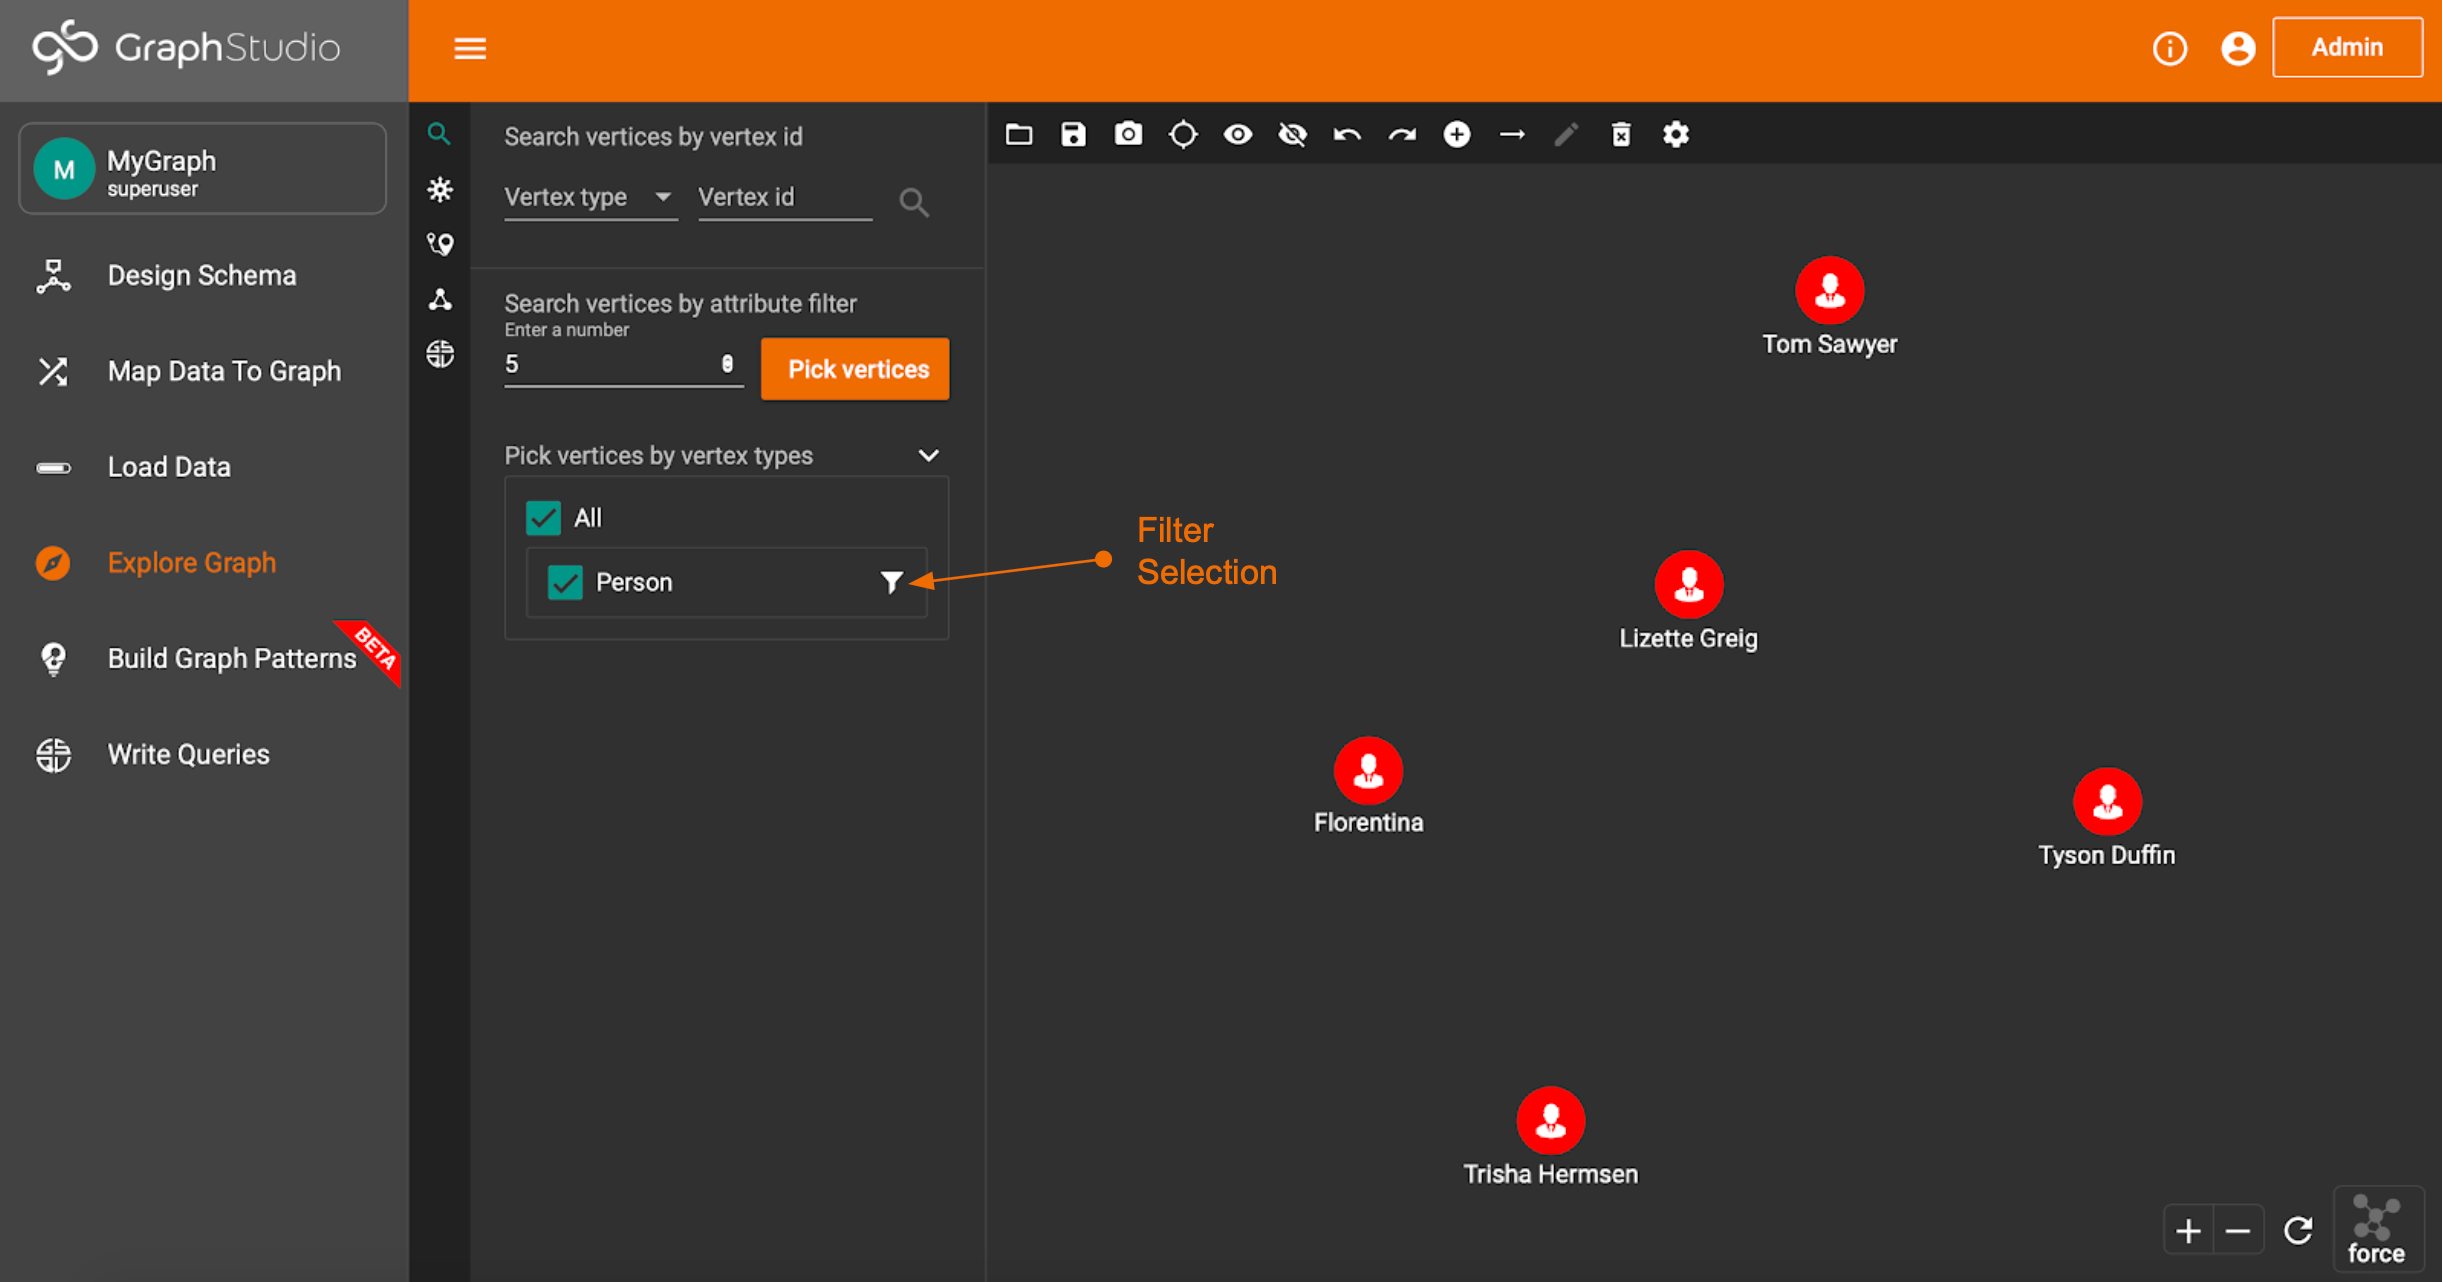
You can also fine-tune your exploration further by adding a filter to the vertex types you search for.
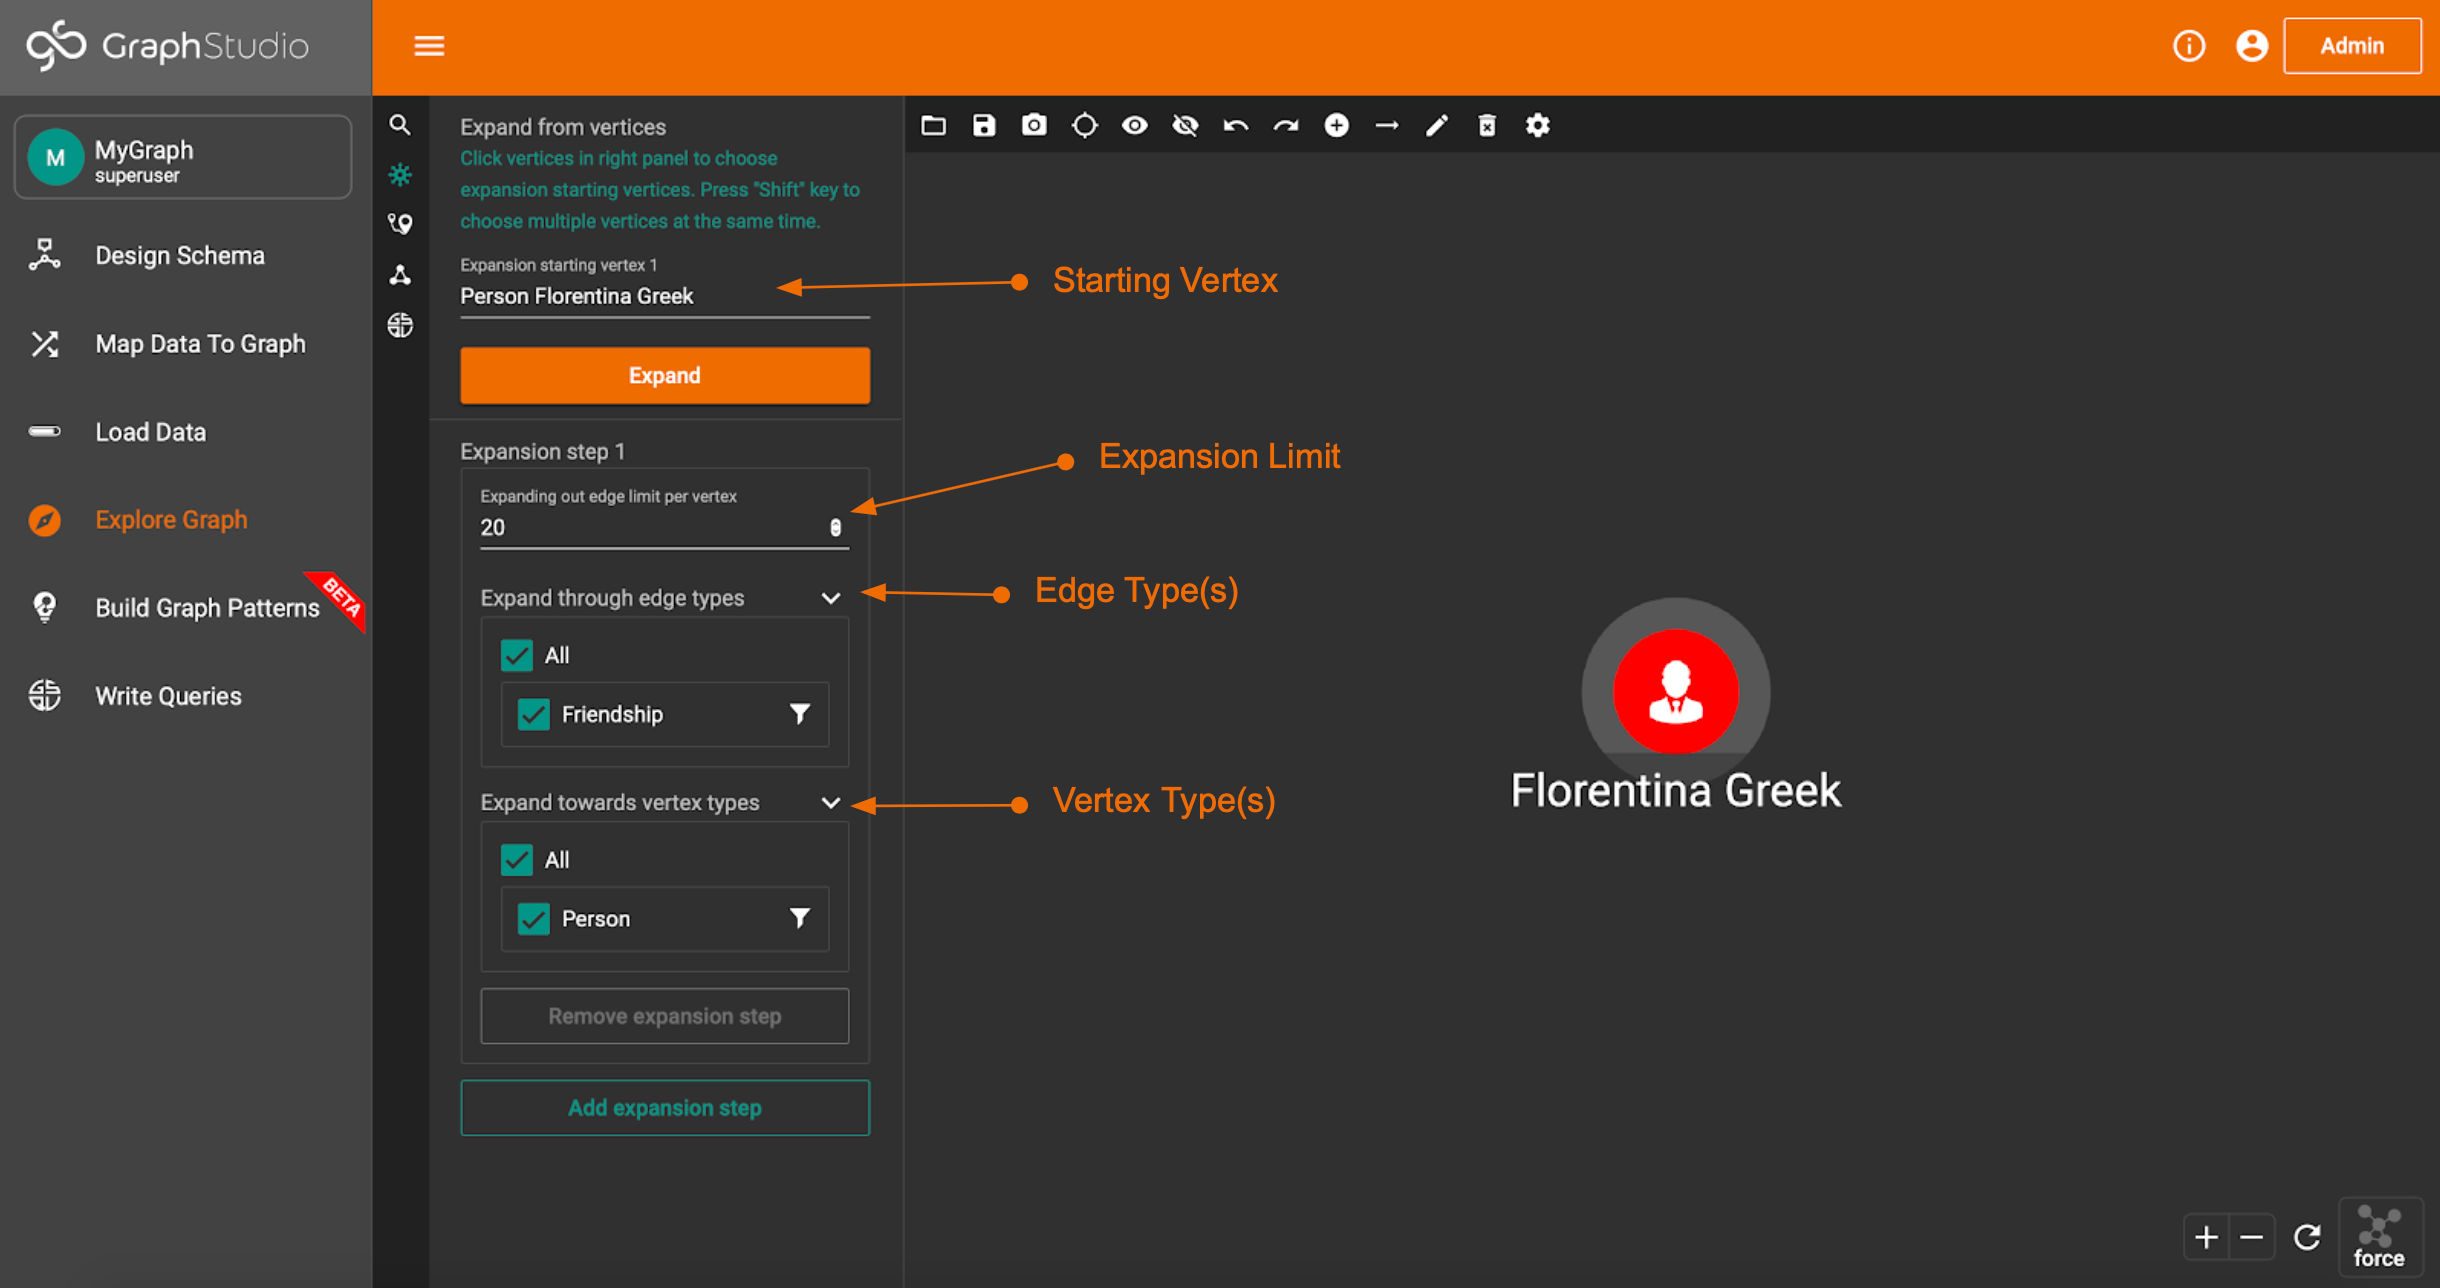
Next is Expansion.
On this page, you can expand outwards starting from some specific vertex or vertices. You can filter the expansion edge types and the destination vertex types.
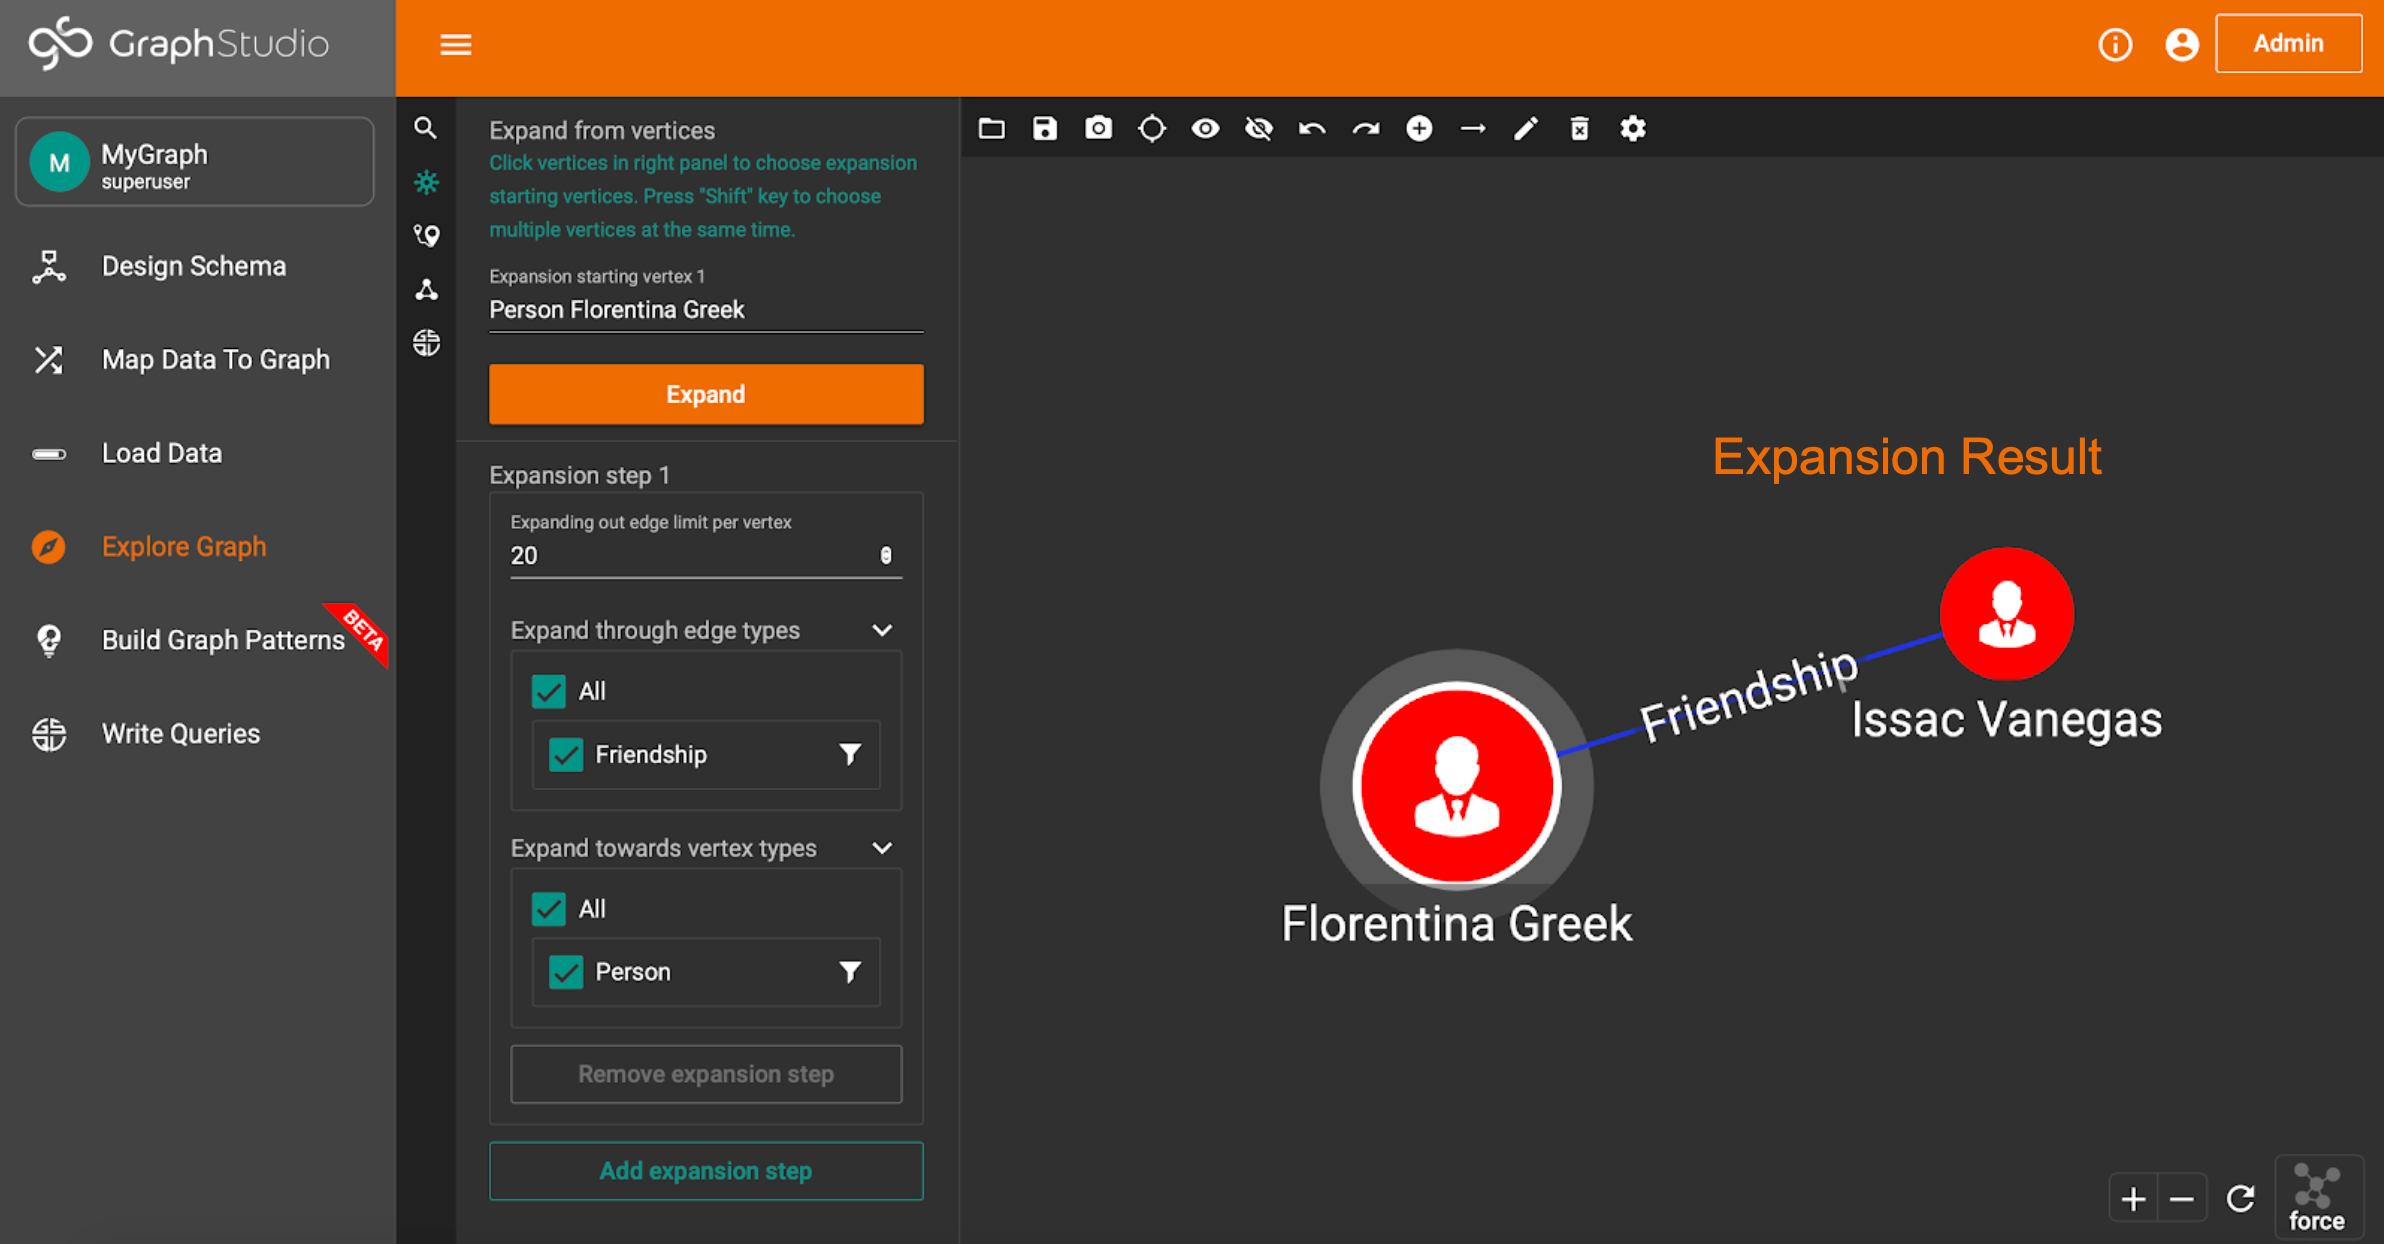
An example expansion would look something like this.
Note: You can also expand from a vertex by double-clicking on it’s icon. However, this will expand to every vertex connected to that starting vertex. There is no filtering with this method.
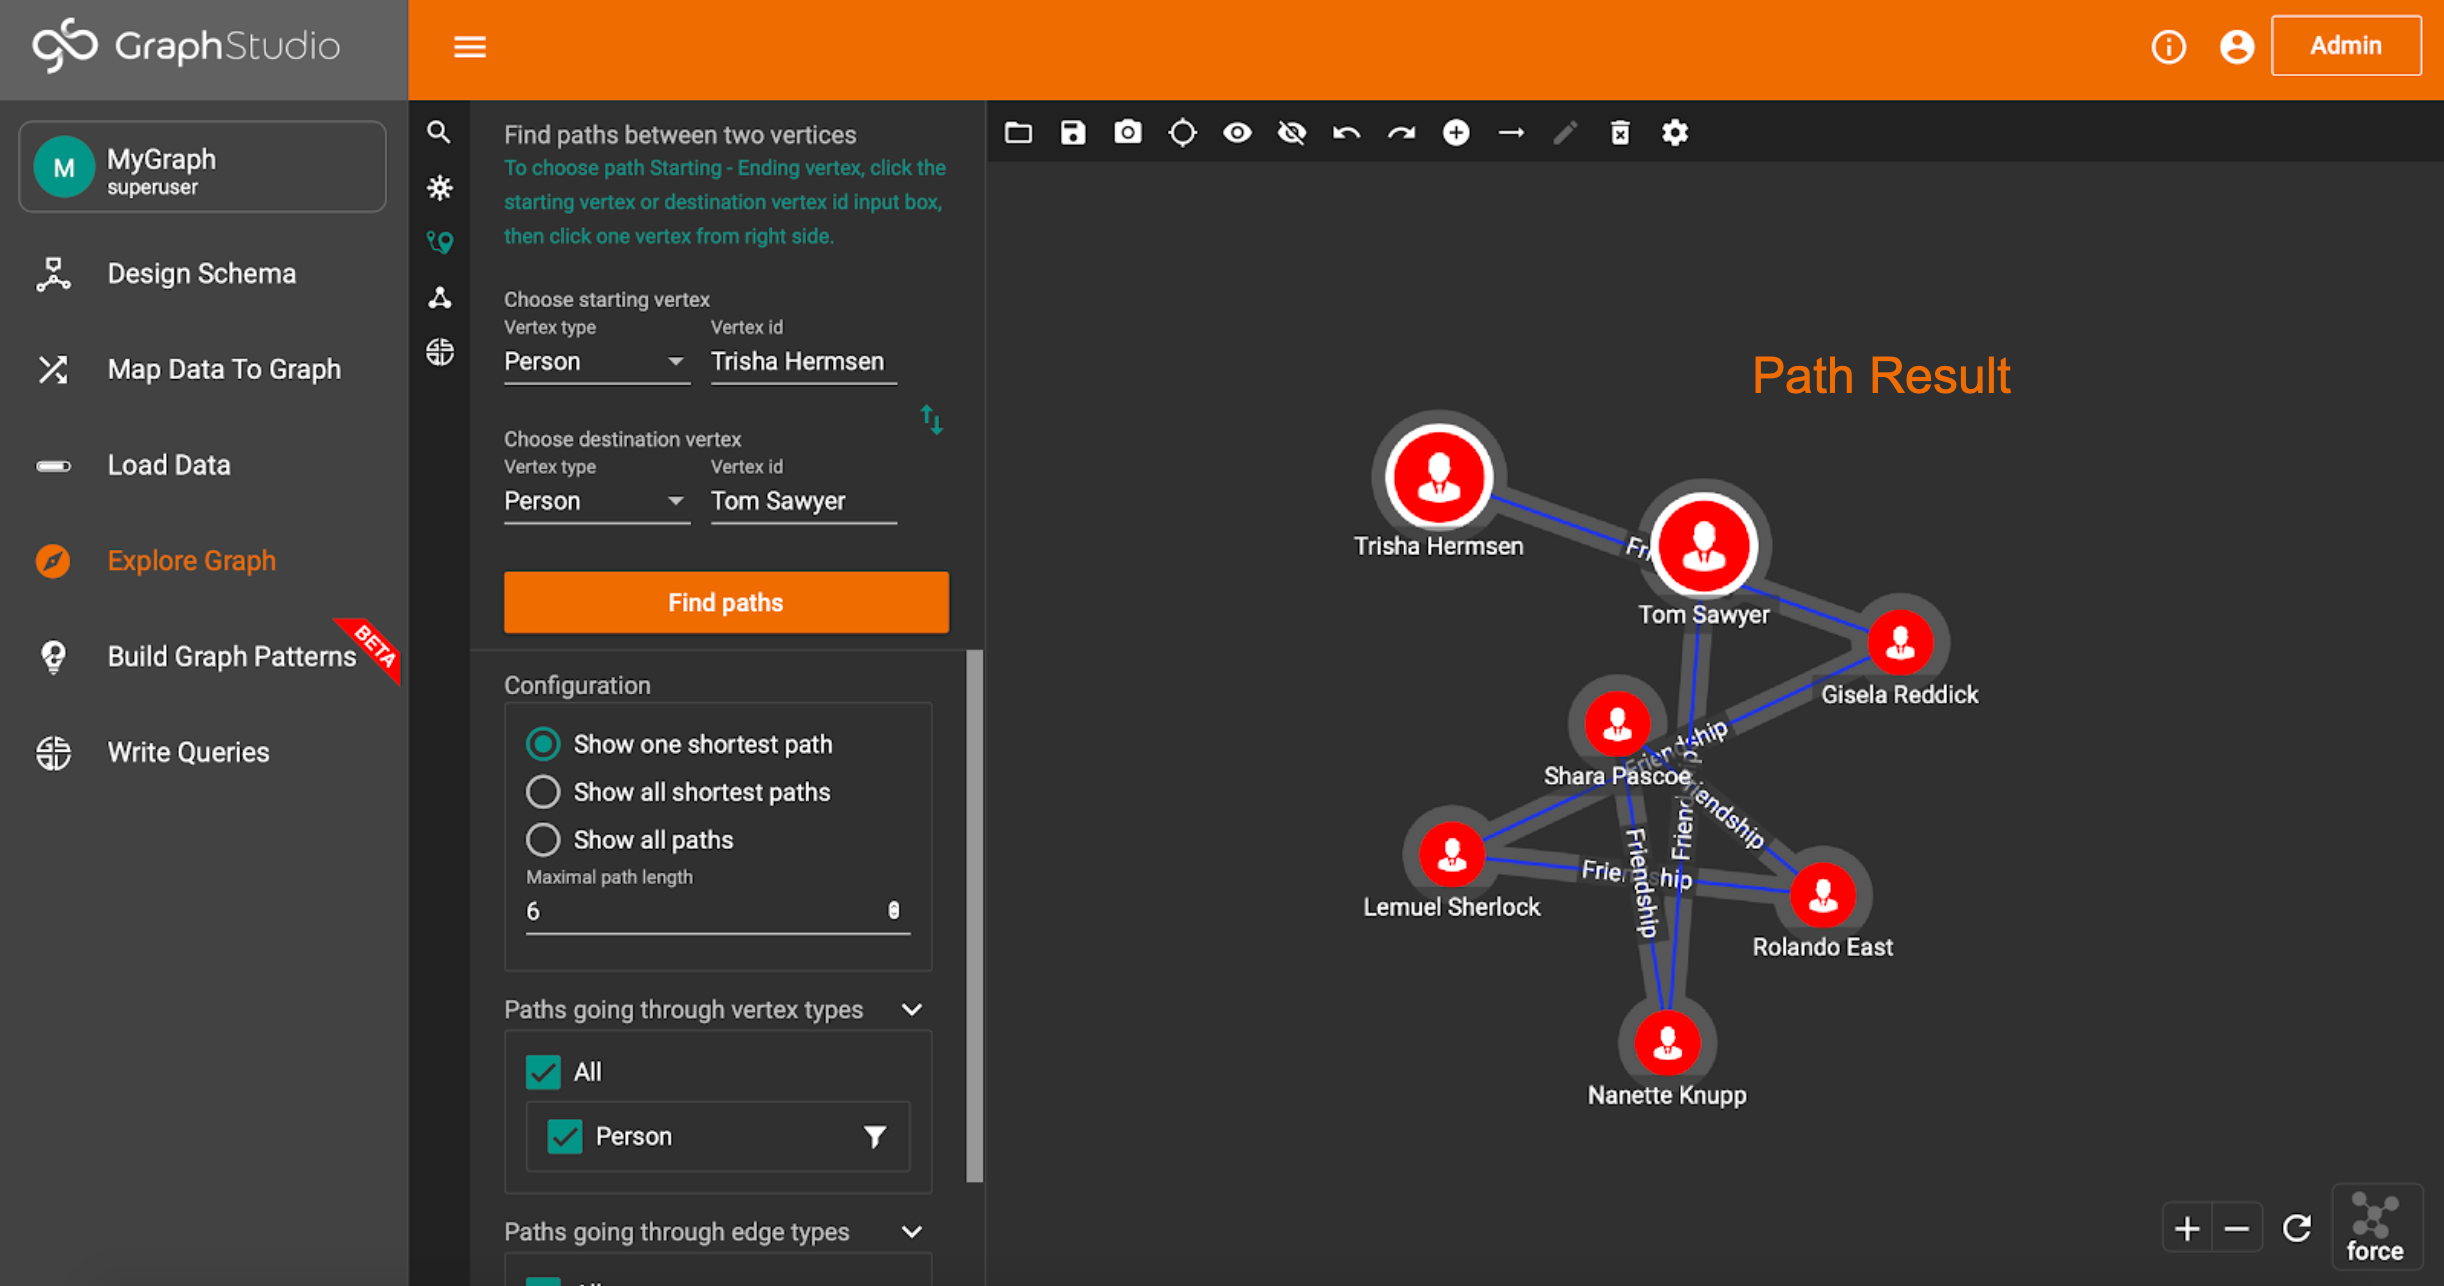
The third tab is to Find Paths.
Here, you can find paths (if they exist) between two vertices. Like for expansions, you can configure the path to only go through a certain vertex and edge types.

Here’s an example of finding the shortest path between 2 Person vertices.
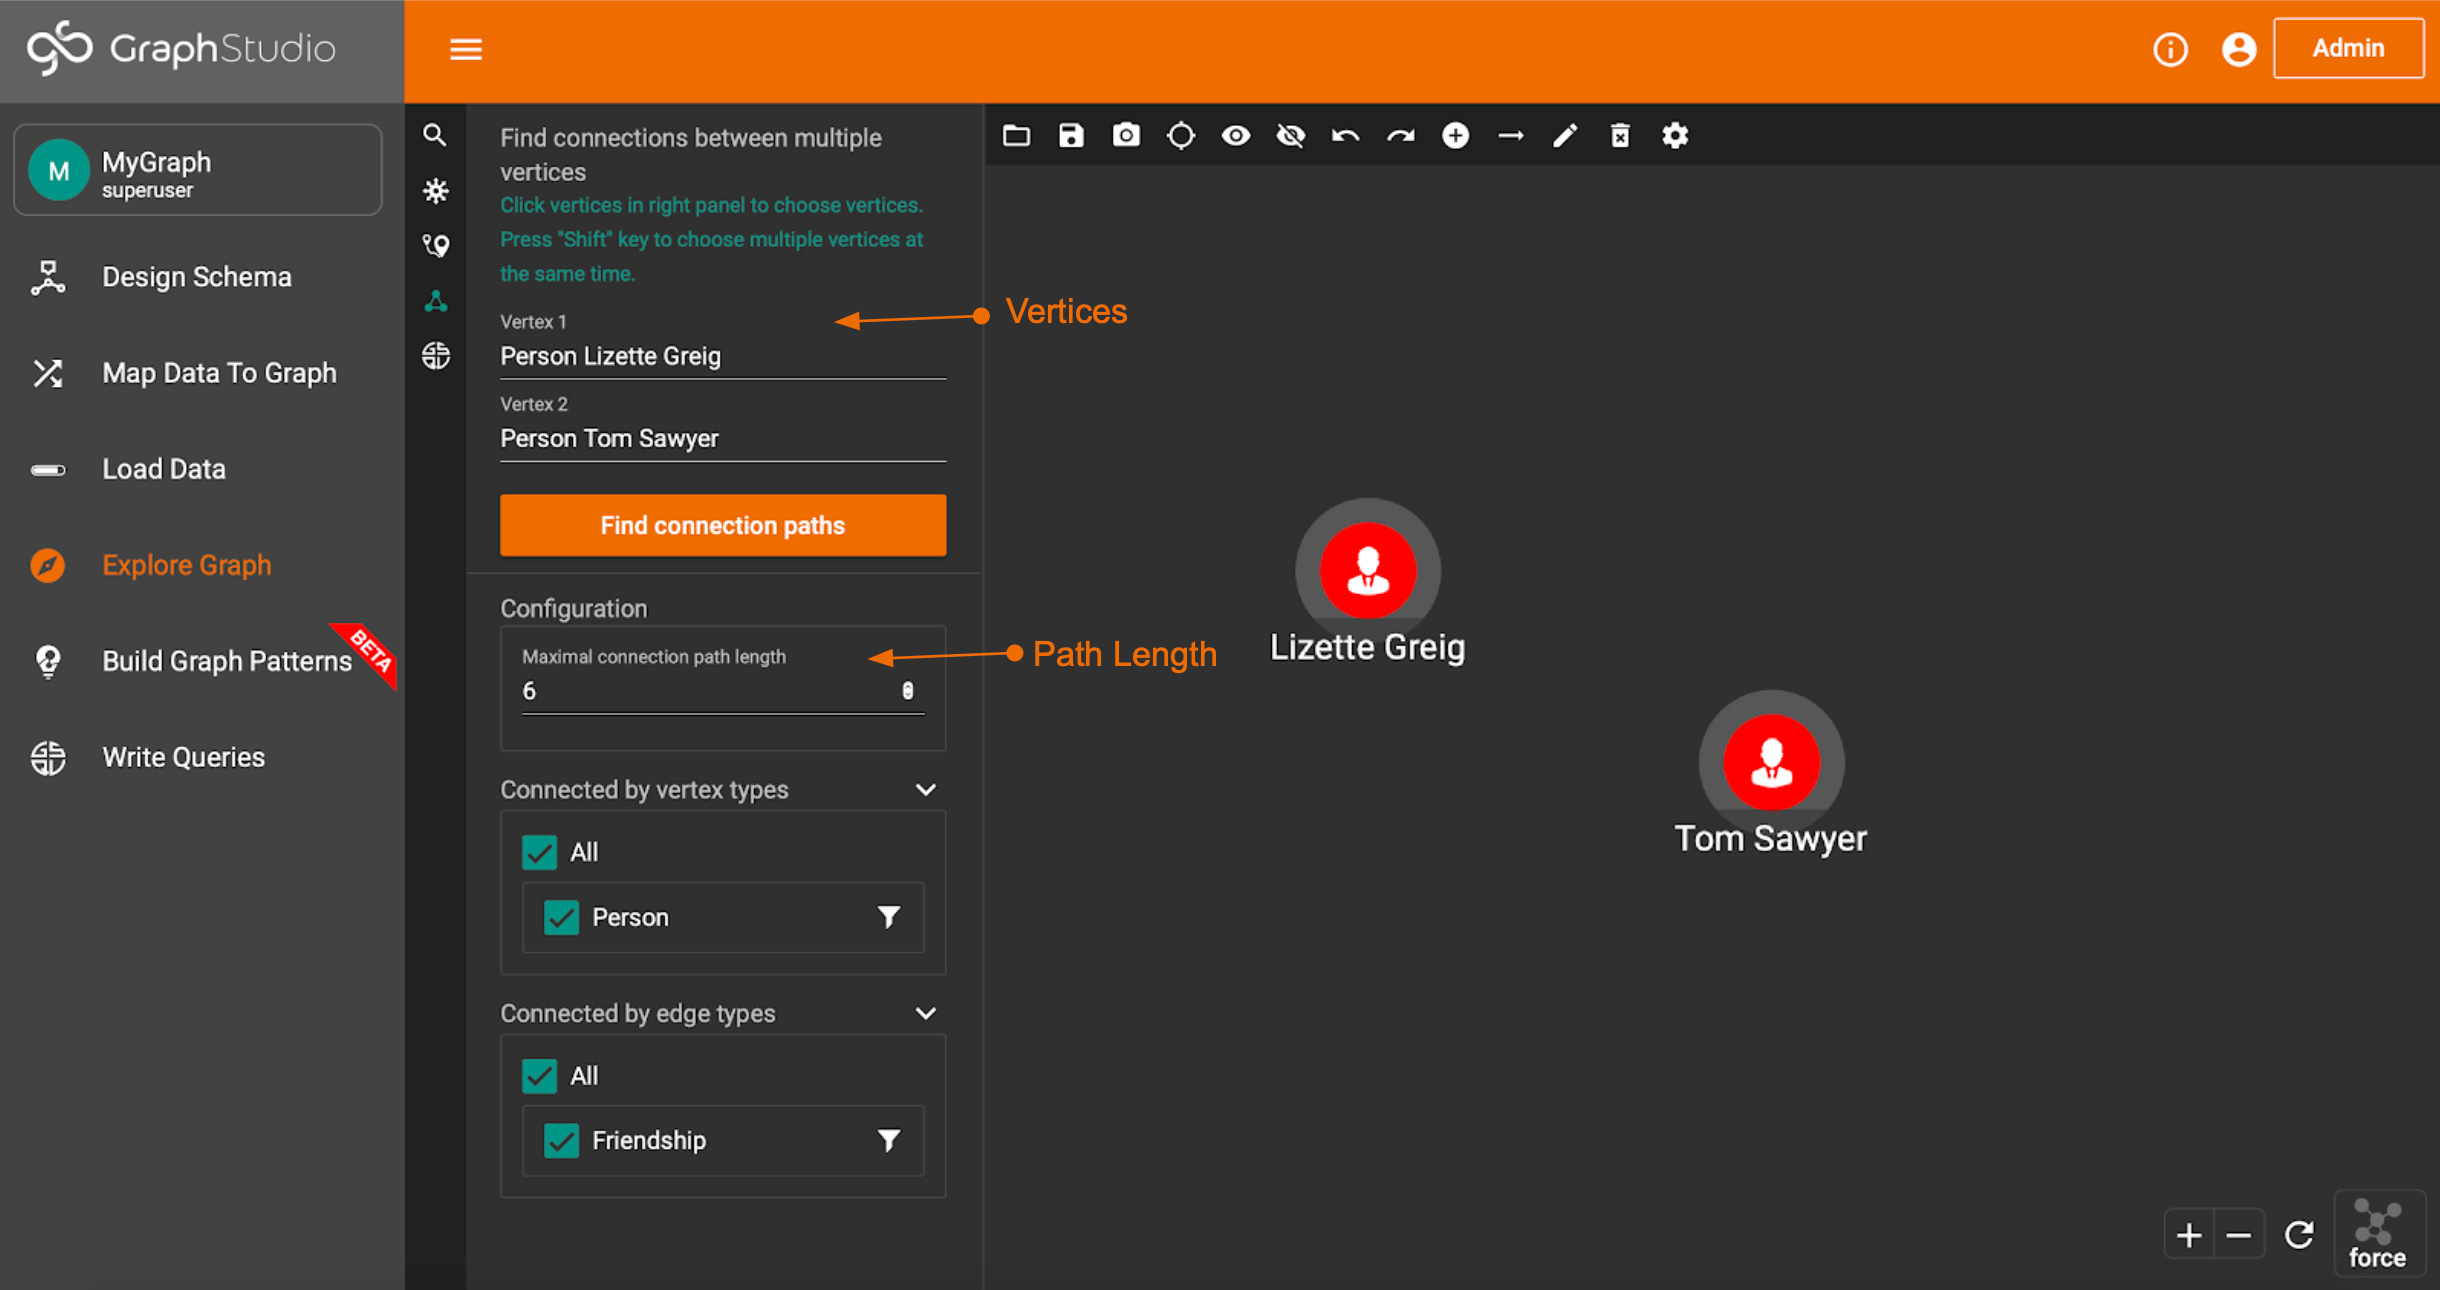
Finally, there is the Connections tab.
On this tab, you can find connections between two or more vertices. The configuration is almost identical to the Paths page, but you can have more than just two vertices.
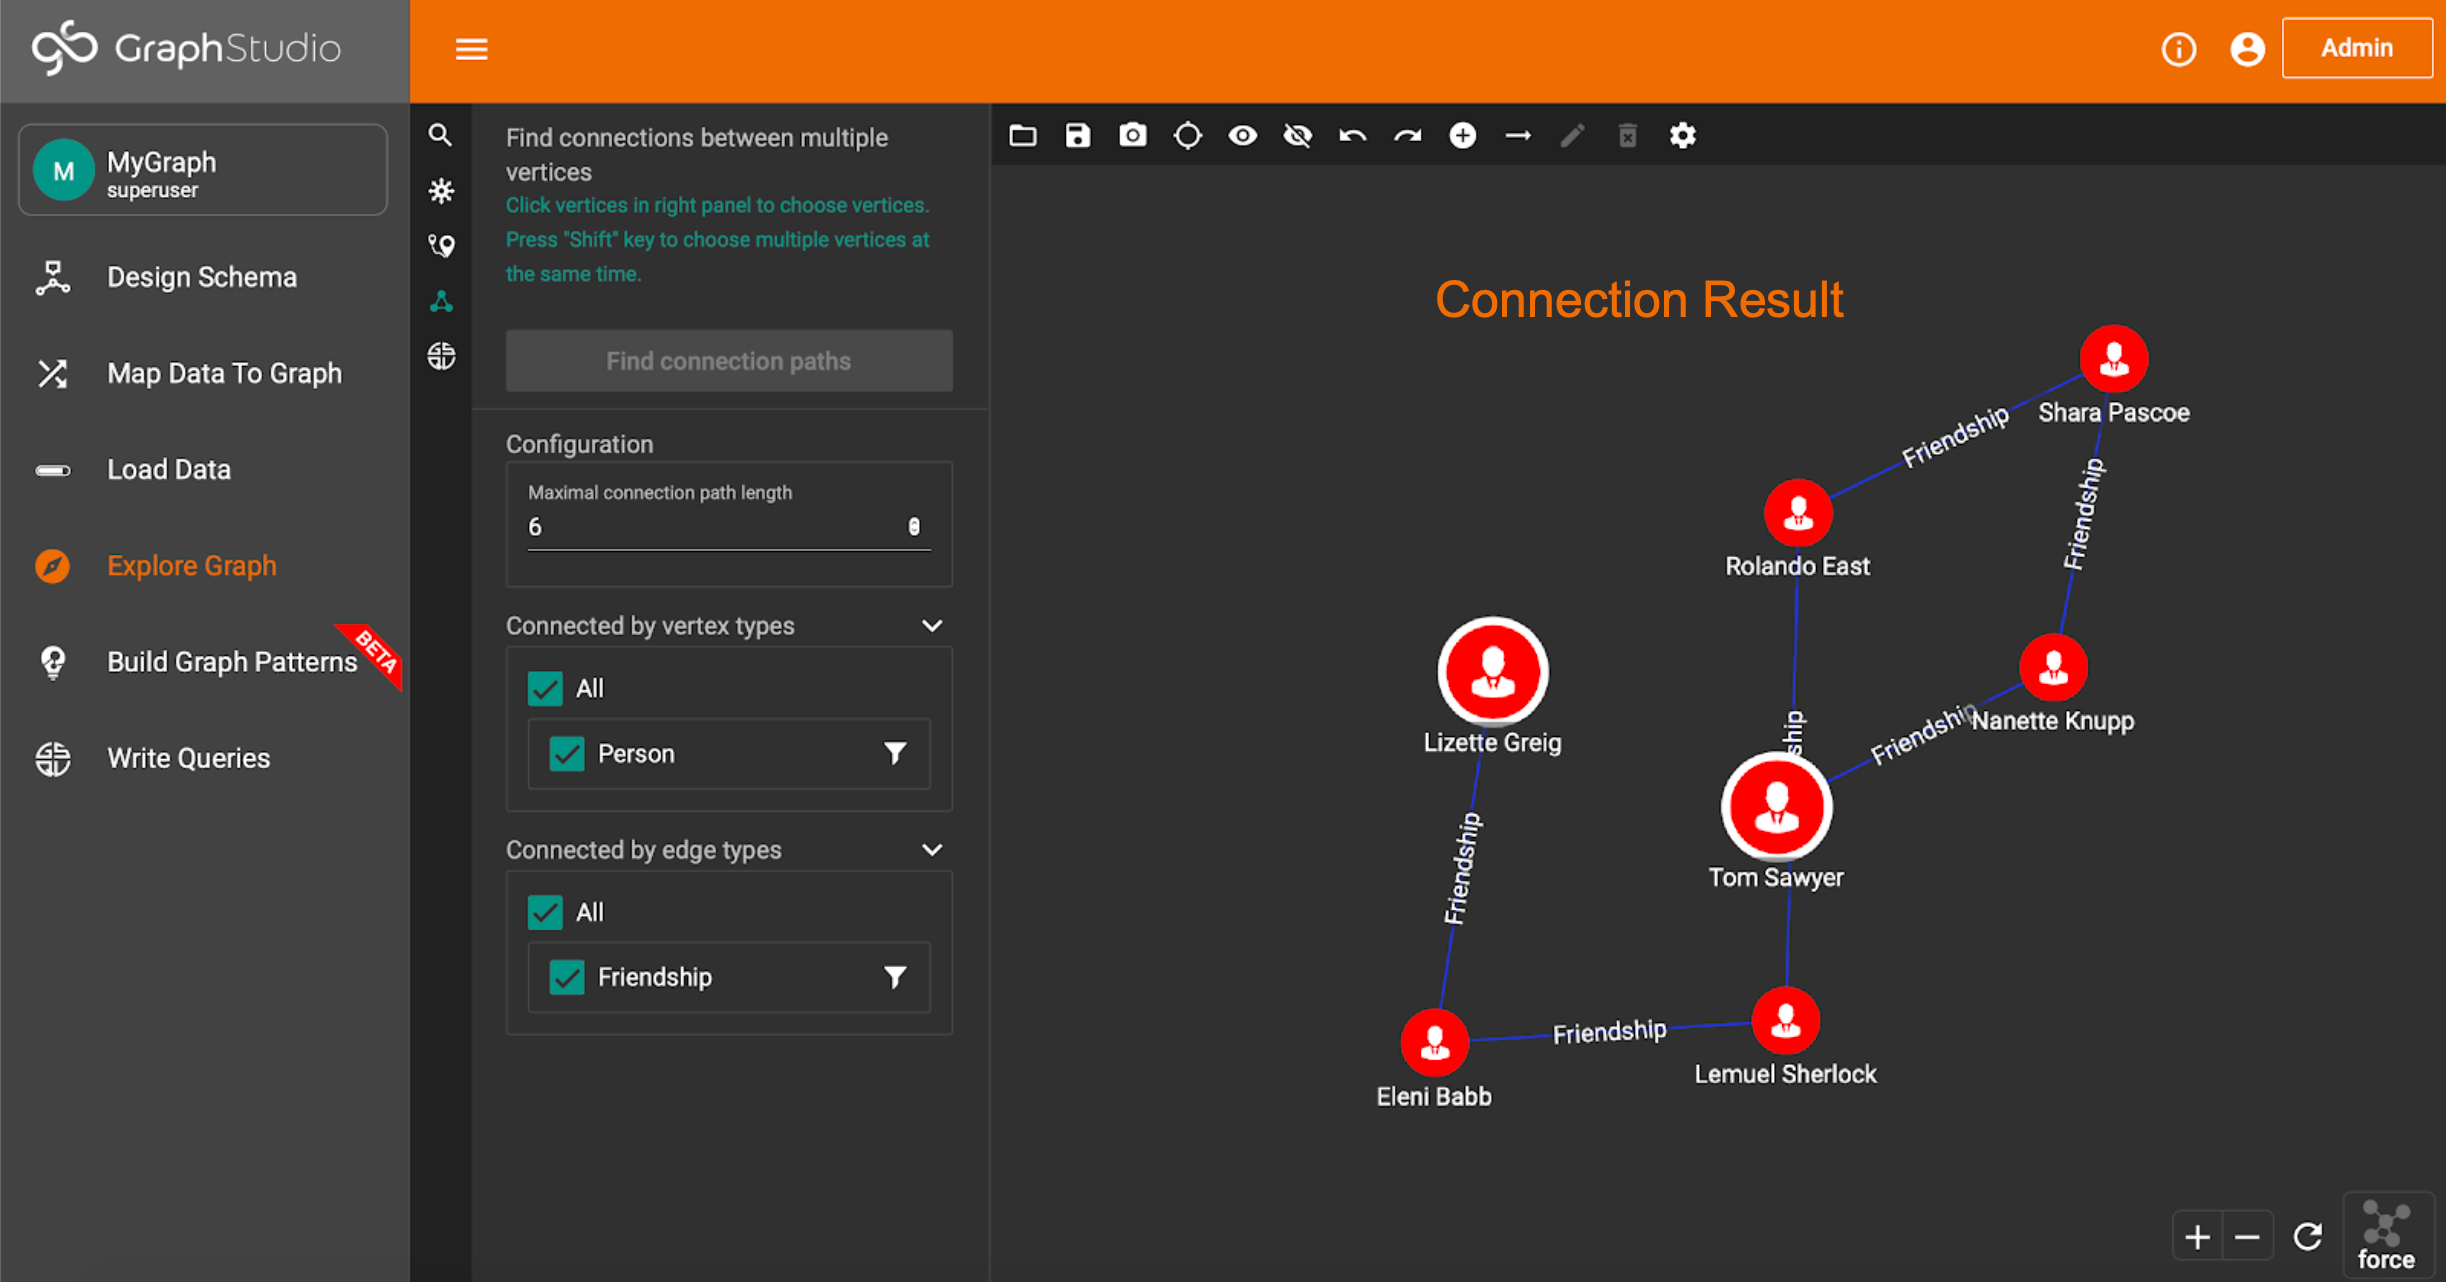
Here’s what a sample resulting connection path would look like.
The very last tab lets you run queries on the graph, using the GUI to set up any parameters or initial values. We will cover everything there is to know about queries in the next section.
Pattern Building
We’ve now seen how to explore the graph, but what if we want to grab specific data from our graph. For example, what if we only wanted to look at people over the age of 50, or friendships that started before 2008. This, and much more, is possible through the Build Graph Patterns tab.
Note: The Graph Pattern builder is still in Beta, so the results may not be accurate or exactly what you are looking for. Improvements are continuously being made to this feature.
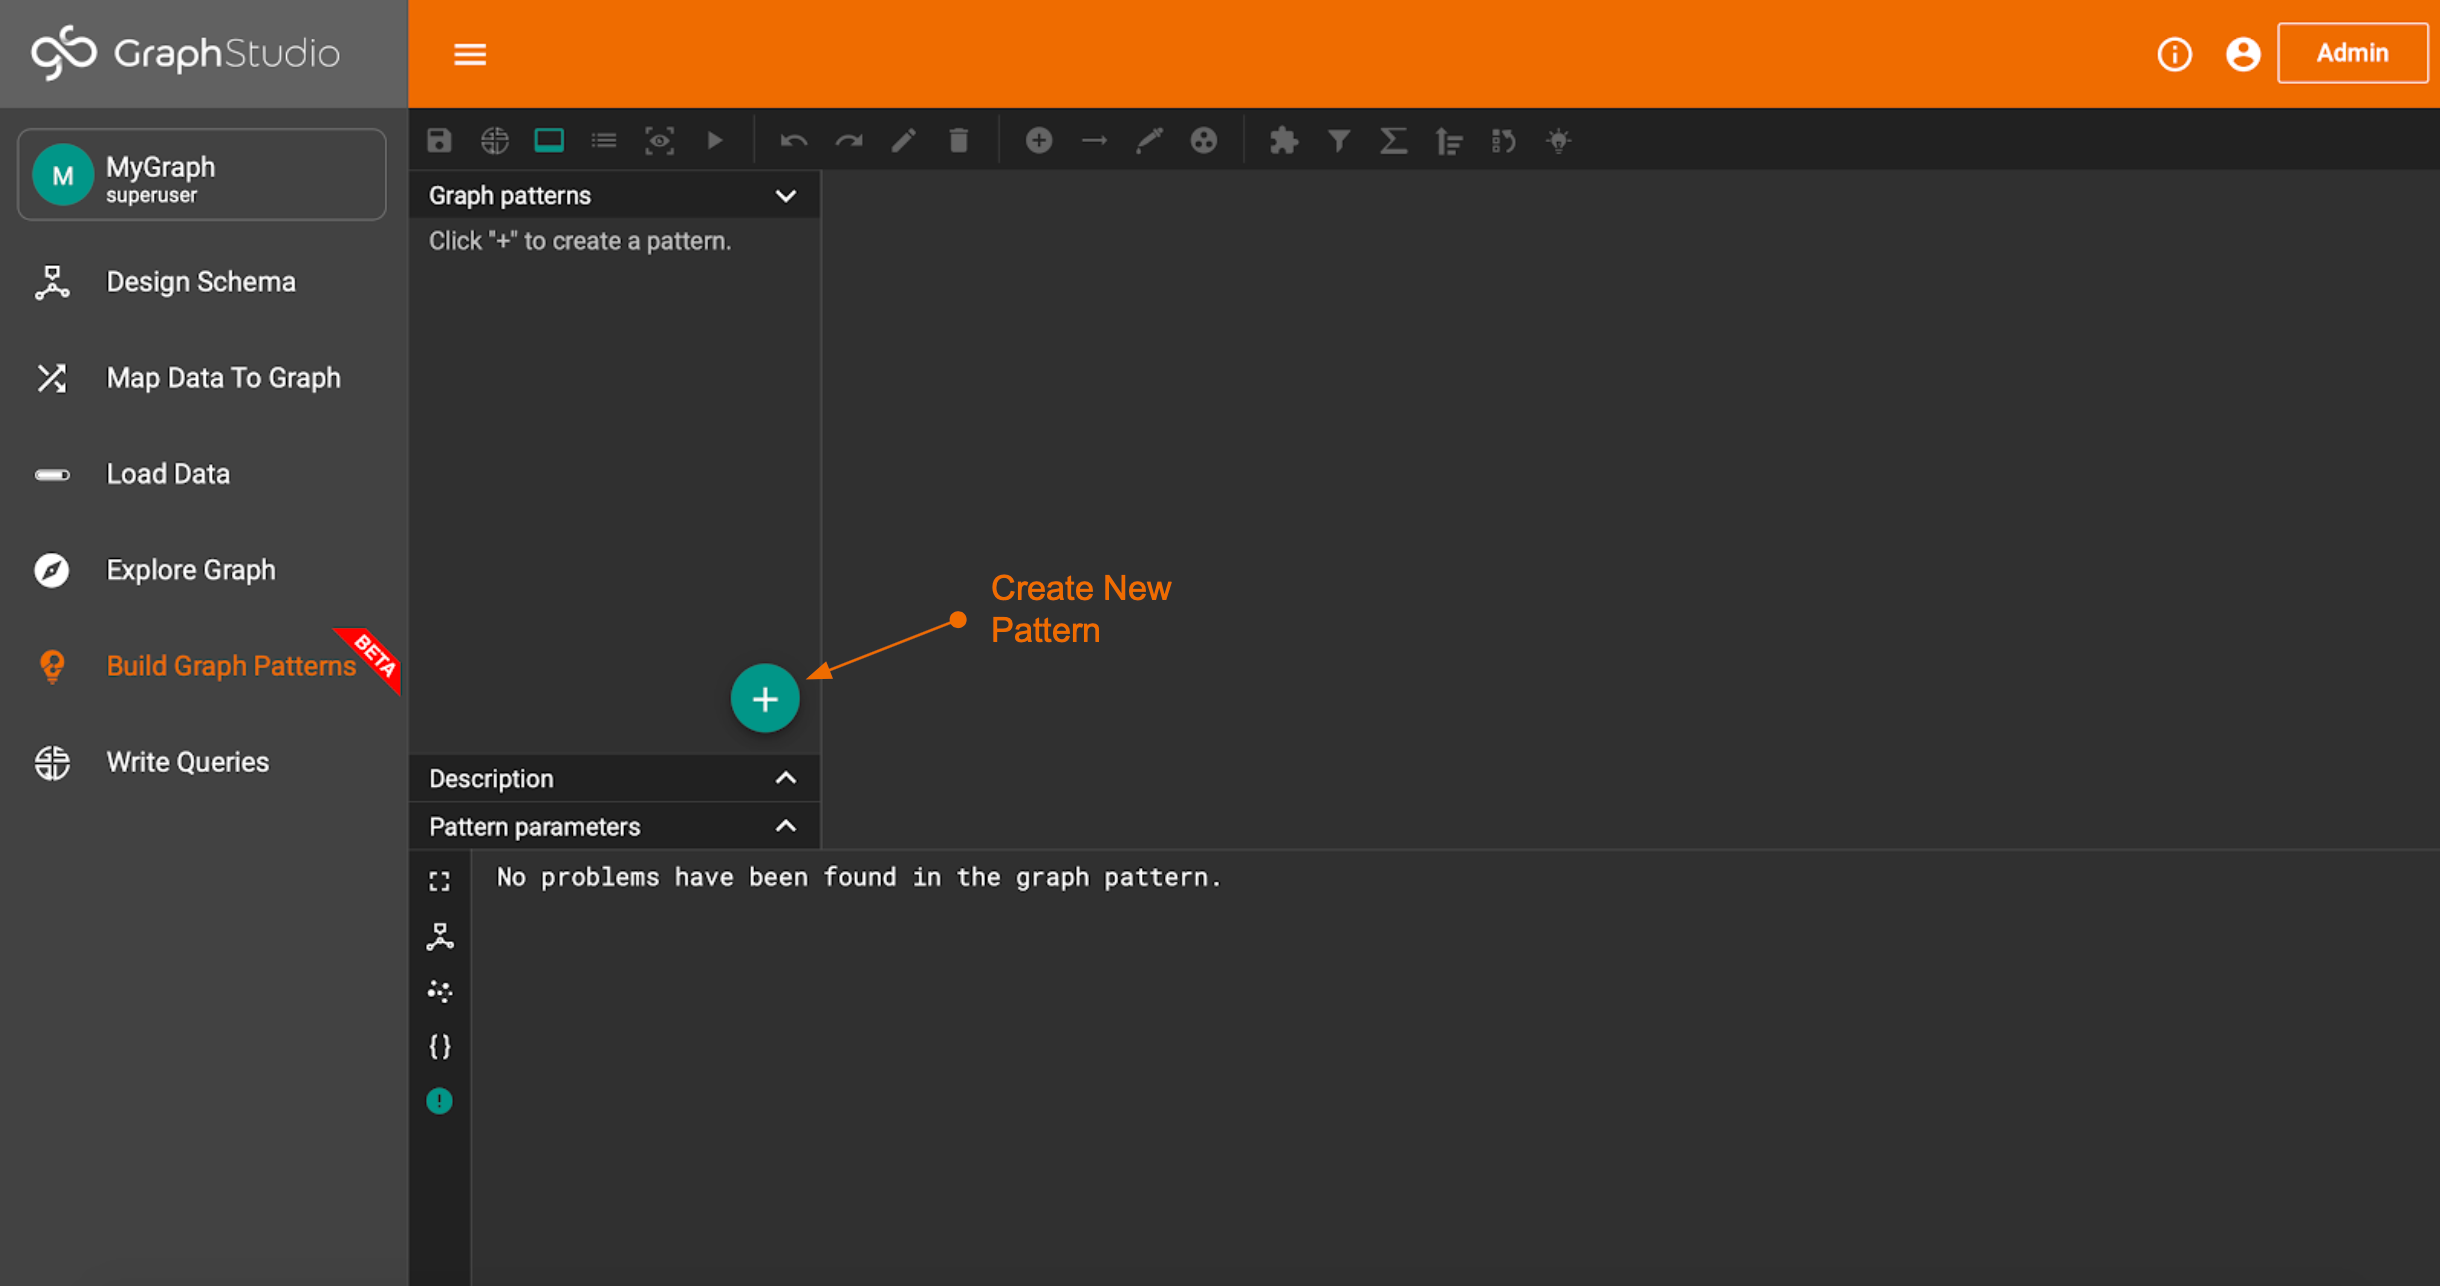
The first step is to create a new graph pattern. Feel free to call it anything you want.
Once the pattern for the graph is made, you can start adding patterns for specific vertices and edges. There are lots of options in the toolbar to help you build your pattern
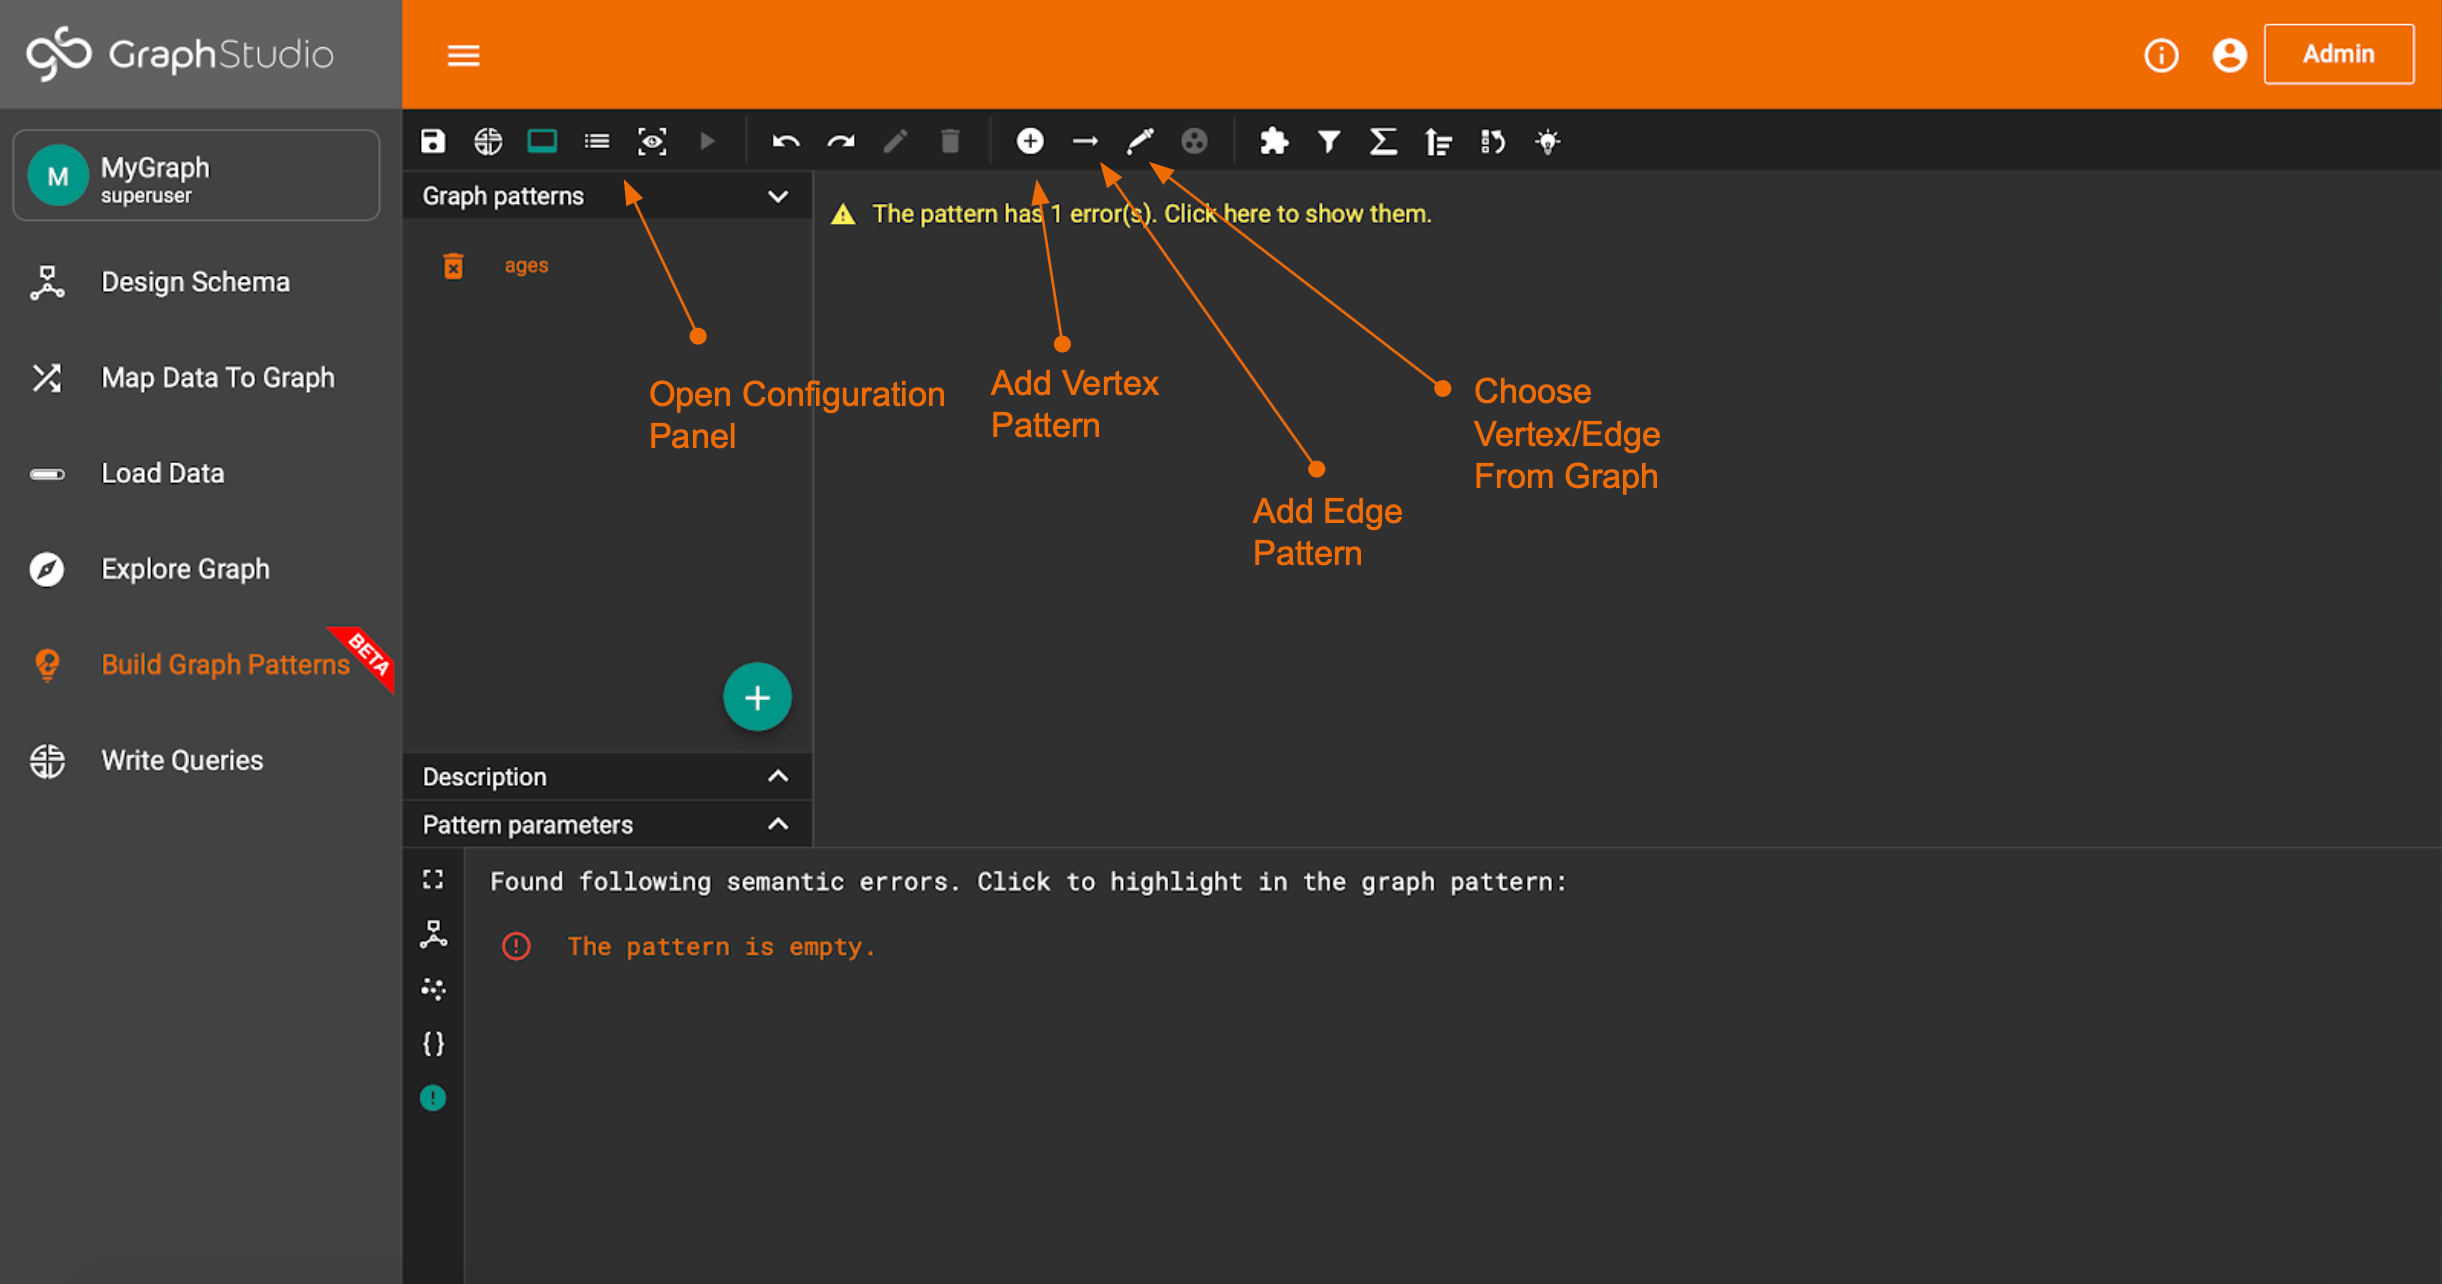
For now, just find the plus icon. This is used to add a vertex pattern. GraphStudio should automatically choose the Person vertex.
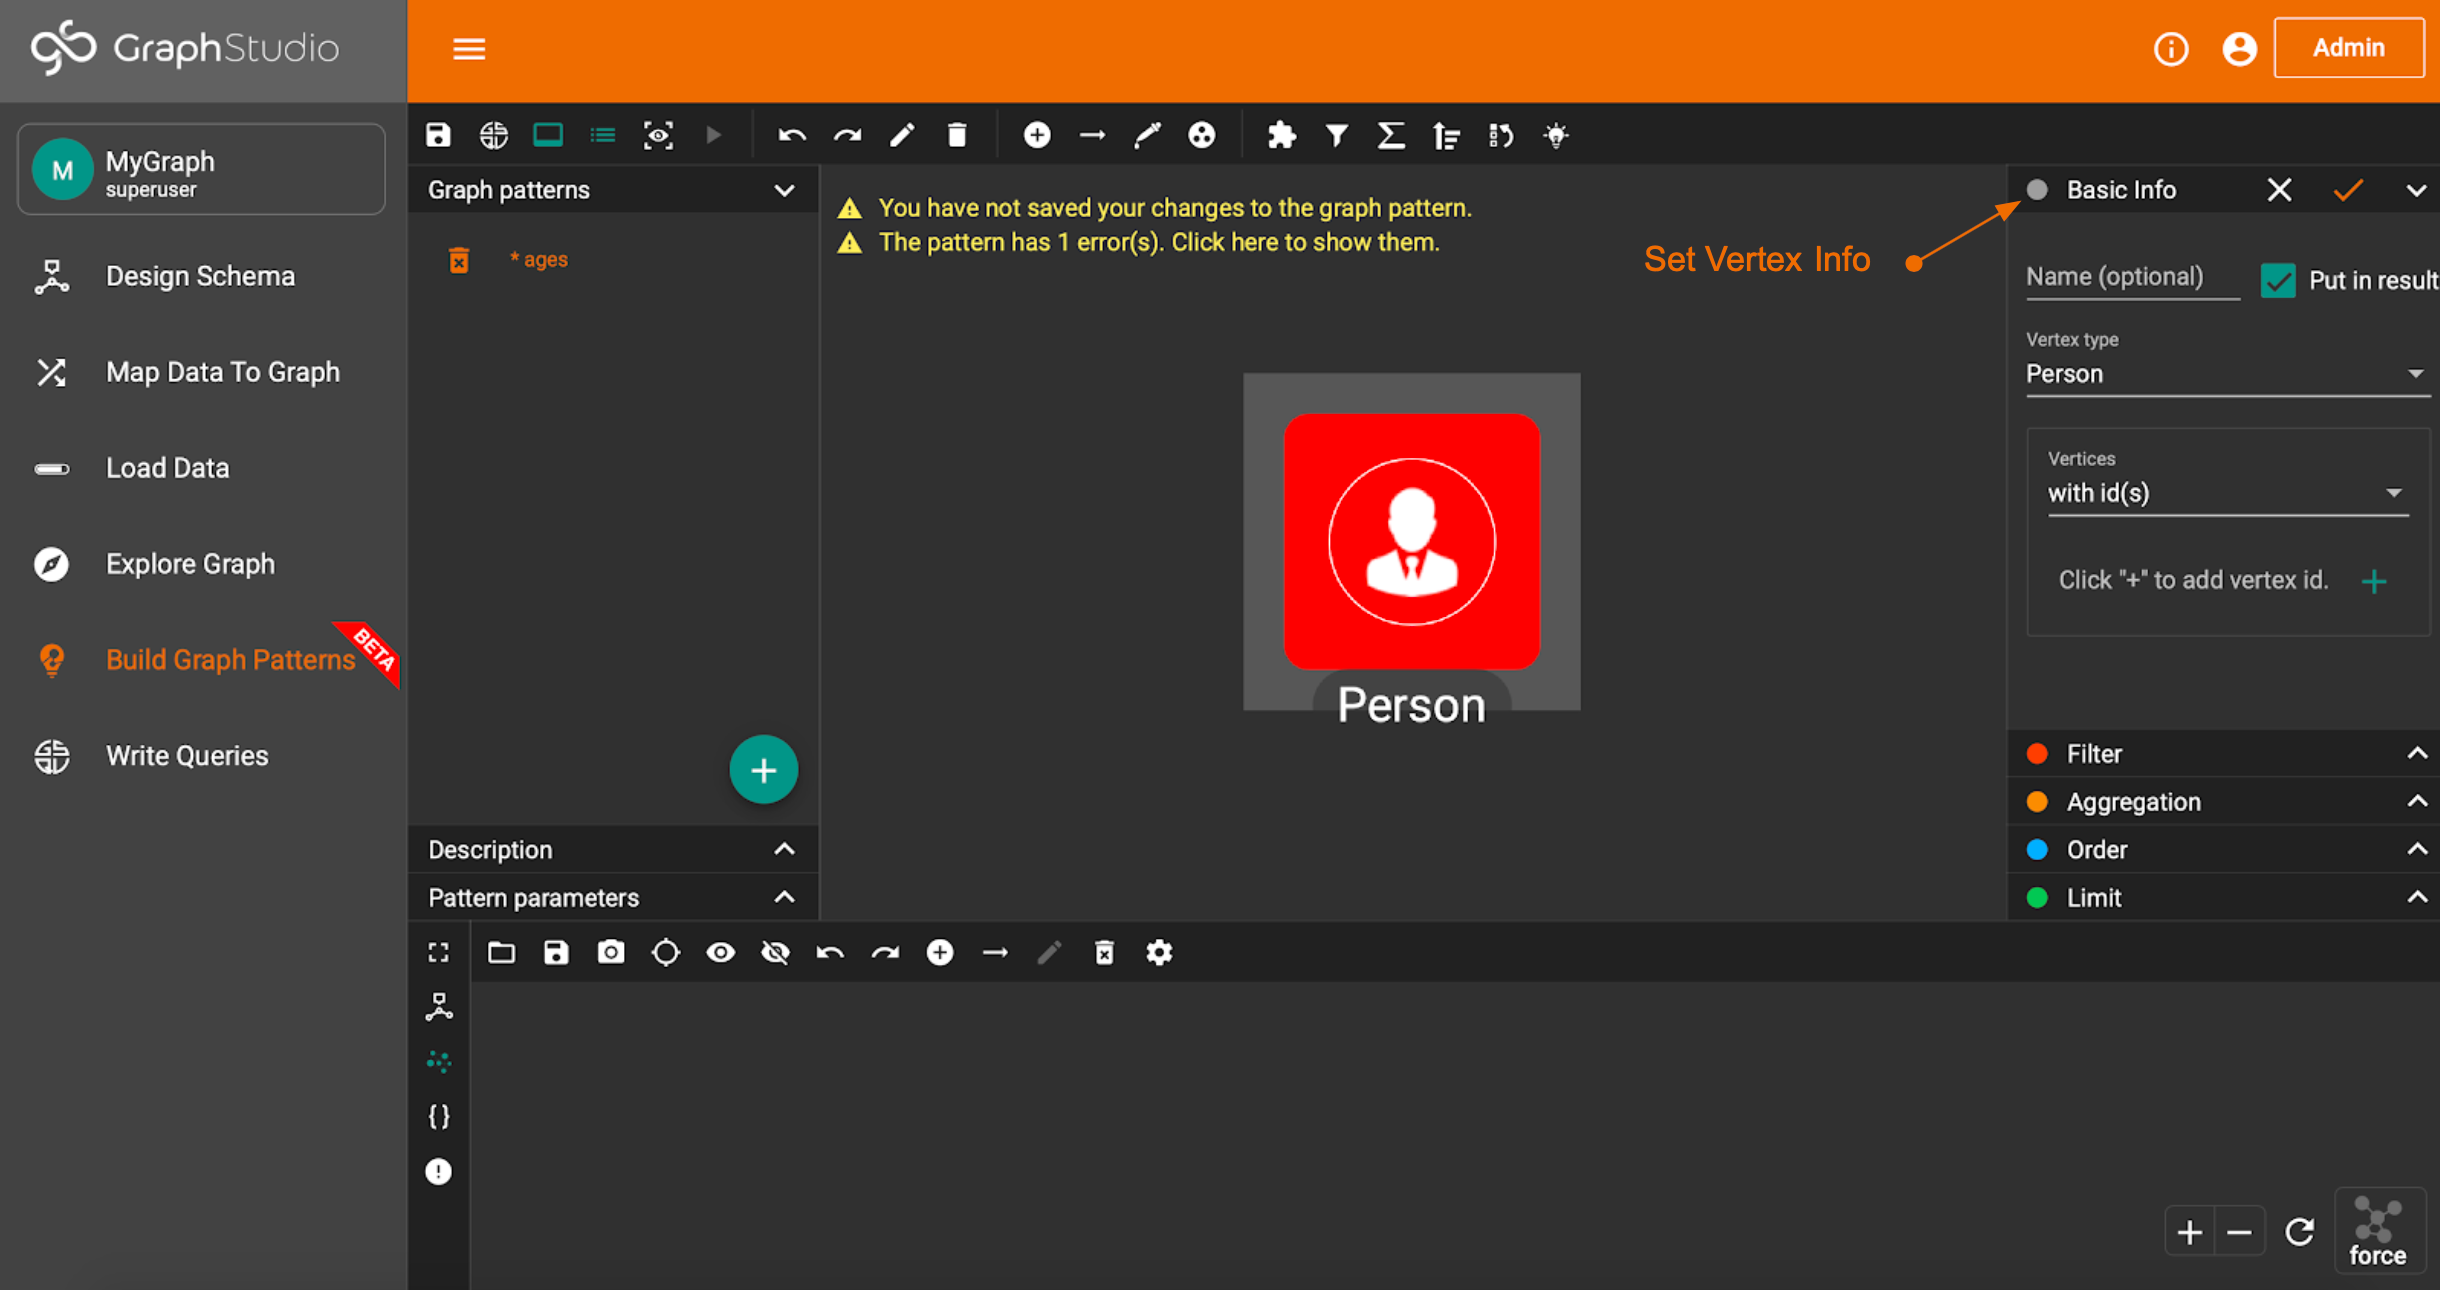
Now, we can start sorting through the data.
There are 5 tabs on the right hand side. The first one is Basic Info. This is where you set the information about the vertex or edge you are selecting.
The next tab is Filter. This is where you can select data based on some condition. For our example, we will select people who have an age less than 50.
The third option is Aggregation. This is used to accumulate any information as you traverse the graph. For our example, it doesn’t make much sense, but it’s included anyways just to show you how it works.
The fourth option is Order. This is pretty straightforward. If you want the results to come out in some order, you can set that here. Let’s have the results print in ascending order of age.
The final piece is the Limit condition. Here, you can limit the number of results you see.
Now, our pattern is ready to go.
You can save and run the pattern using the buttons shown.
When you run the pattern, you’ll see the output in the bottom window.
You can also view the JSON output by hitting the open bracket symbol on the left hand toolbar.
Congratulations! You’ve successfully grabbed specific data from the graph.
Write Queries
You may have noticed that there’s one tab left. The Write Queries tab allows you to write custom queries. These are a little more complicated, and are the foundation for grabbing data from the graph. GSQL is TigerGraph’s custom query language. GSQL and graph databases work much like SQL and relational databases, only the graph counterpart is much much faster. If you have any SQL experience then you’re in luck. GSQL was actually modeled after SQL, and so much of the syntax is very similar.
If you don’t have any SQL experience, that’s perfectly fine. The most important thing is understanding how queries work conceptually. If you’ve made it this far, then you already have a basic understanding of queries. The pattern building exercise we just did is actually just a visual way of querying the graph. You can see an approximation of what the pattern would look like in GSQL by clicking the “Save as a GSQL query” button.
The pattern builder is great, but It’s a bit cumbersome to manually choose all of the filters and selection tools we want to use.
This is why we write in queries in GSQL.
In the next section, we’ll see how to write some basic GSQL queries and learn how to implement filters, ordering, aggregation, and limits to grab any data we may want from our graph.
Starter Kits
TigerGraph comes with a large number of Starter Kits. The kits each cover a specific use case of graph analysis and come prebuilt with a schema, data, and queries.
These are great if you are wondering what a full graph system looks like, want to explore a specific topic, or if you’re looking for inspiration for your own custom graph database.
You can find all of the Starter Kits in your TigerGraph Cloud Portal by clicking Create Solution.
We won’t cover any of these right now, but we’ll take an in-depth look at the Fraud Detection — Payments starter kit in the next section. Don’t be afraid to explore the different kits and use them to become more familiar with TigerGraph and GraphStudio.


