


Can we discover astroturfing, marketing, and self-promotion networks using graph databases?
Originally posted by Daniel Ward on Medium.
Exploring Reddit Marketing Networks with Graph Databases
If you’re short on time and only interested in the tech and results, skip to the “What is a graph database?” section below… But I recommend you read the lot for context.
What is the scenario?
I’m an avid Reddit user. More of a lurker than a contributor, but I’ve visited Reddit multiple times daily for around seven years now. As a result, I’m very familiar with astroturfing, which can briefly be described as (from Wiki):
the practice of masking the sponsors of a message or organization to make it appear as though it originates from and is supported by grassroots participants.
It is prevalent. Efforts both on and off Reddit have increased in recent years to tackle this, most clearly seen through the introduction of laws making it explicitly clear that social media influencers must declare when something is a paid advertisement. In spite of this, the rules are often flouted, and it can be hard to determine when something is a paid endorsement or a genuine endorsement.
When it comes to Instagram, Facebook, Snapchat, and the majority of social networks, it is clear who the individual posting is (provided, of course, they are a real person at all). Being a visible and open person grows trust and makes people more likely to have faith in your recommendations, paid or not. This is why influencers are seen as such a concern, as their good-natured recommendation might actually be a thinly veiled advertisement.

Reddit is slightly odd in this sense. Users are typically anonymous, with many (myself included) operating multiple accounts for different types of content. Likewise, I have never once come across a submission or comment on the site which has made clear that it is an advertisement or sponsored post (except for in certain IAMA posts). Astroturfing isn’t widely discussed on the platform, but it is a recognized concern.
Unlike with Instagram, tackling astroturfing on Reddit is hard. You don’t know who the users are, the majority of the content is in the comments (of which there are a lot), it’s very fast to set up a new account, and there’s nothing stopping you from commenting on your own content.
Reddit has one more strange, cultural quirk. People are in equal parts trusting, and untrusting. Take the r/TIFU subreddit (a subsite within Reddit, known as a Subreddit, where people post real stories starting “Today, I fucked up”). Some relatively mundane stories are posted here and some truly fantastical ones (of which, the latter are much more well-received). In either case, you can hop into the comments of any post and find a mix of people calling the submission “fake” and likely many more accepting the post for what it is.
There’s nothing illegal about posting a fake story to r/TIFU, provided you’re not advertising something, even if that is a bit disingenuous. But there’s plenty of content that is advertising more broadly on the site.
The Trigger
I came across a video on the r/funny subreddit which, to be honest, wasn’t particularly funny. And I found the music on it completely out of place. In fact, I thought the music was so out of place that I checked the comments to see if other people felt the same way. Many people did, though a minute number were interested in the music. In fact, the OP (“Original Poster”, the person who submitted the video) posted their own comment with a link to the Soundcloud page for the music.
Of all the astroturfing I’ve come across on Reddit, this was the most blatant. Opening OP’s profile revealed many repetitions of this same trick in the exact same format. Take a funny video, pop the music over it, post it and make a comment pointing to the Soundcloud.
Exploring deeper, I found some of the comments pointing to the Soundcloud existed on submissions by other users, who had also posted videos with the music track on it. And likewise, some of those users had commented the same way back to our original user. There were also a handful of comments from accounts made on the same day as the comment itself, with no other comments or posts, simply asking “What is the music?”, to which the OP would readily reply with a link to the Soundcloud.
This is very clear astroturfing, and more than likely, what was happening was:
- The poster makes a submission and comments on it, linking to Soundcloud.
- The poster logs into other accounts, promoting the post* and leaving comments.
- Some comments ask about the music, to which the submitting user account readily replies with a link.
*It’s also worth noting that using multiple accounts to promote your own submissions is strictly against Reddit’s T&Cs, and they are known to crack down hard on users breaching these rules.
So, where does this leave us? We can be almost certain a single user is using multiple accounts to promote a musician (likely themselves), commenting dishonestly to appear trustworthy and using multiple accounts to the same aim. There is potentially some vote manipulation going on, though this is much harder to determine from our end.
Let’s investigate.
What is a graph database?
Before we dive into the solutions, let’s just quickly run through what a graph database is. Graph databases are databases that exist as specific points (entities), with connections between these points. Whilst they have many uses, one of the best and oldest uses is in discovering hidden connections. This approach has been used in banking for decades in order to detect fraud and other unscrupulous individuals. It is even used by HMRC as part of their Connect system to find tax evasion. I can vouch for how impressive it was because I used to work in one of the Connect teams, but I digress…
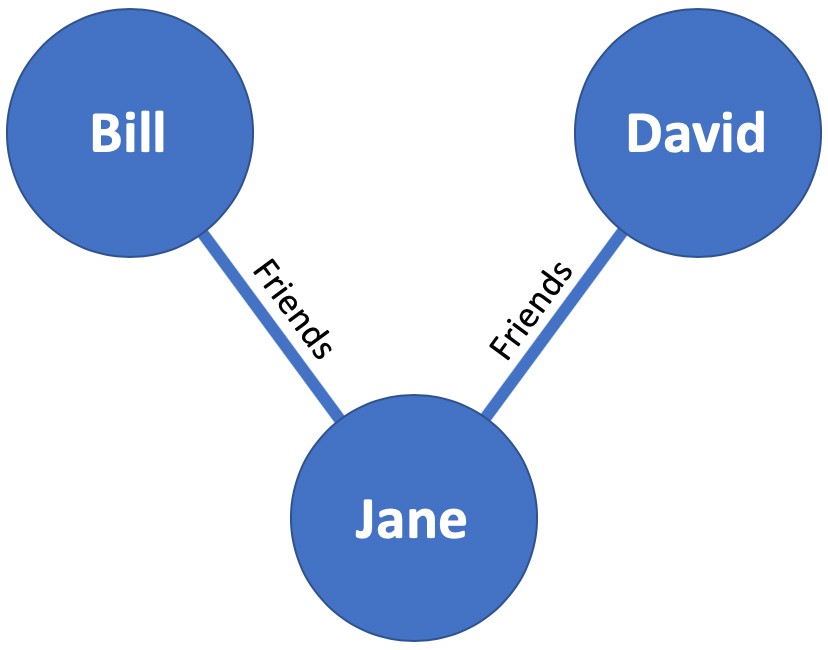
The idea of a graph database is relatively simple on the face of it. Entities will often have relationships with other entities. For instance, if Bill knows Jane, and Jane knows David, but David doesn’t know Bill, we can determine three entities and two relationships between this small group.
With this, we can then explore the graph. If we were to ask “Who is a friend of a friend of David?”, we could quickly and easily find Bill. Graph databases allow us to ask this question directly, as opposed to in a traditional relational database which would likely require at least one join. The aim of this post, however, isn’t to go into deep detail about the difference between RDBMS and graph databases, so I’ll leave that to your own research.
For our scenario, you can hopefully see how identifying the connections between users might help us discover networks of accounts astroturfing.
Scraping Profiles with PRAW
Here’s the plan. To begin with, we identify a Reddit account we think is astroturfing. Then, we find all of their posts and comments. For each of their posts, we find who made a comment on it, and for each of their comments, who made the post the comment appeared on. We then repeat that logic for those newly discovered people, and again for the even more newly discovered people, and so on.
In theory, we will end up with a network of closely linked accounts, with some of the more distant hops being more closely connected than we might expect based on where they’ve made comments.
To get this data, we’re going to use the Reddit API. PRAW (Python Reddit API Wrapper) is a very handy Python library that provides us easy access to the API. The logic we’re going to use it best shown in the diagram below:
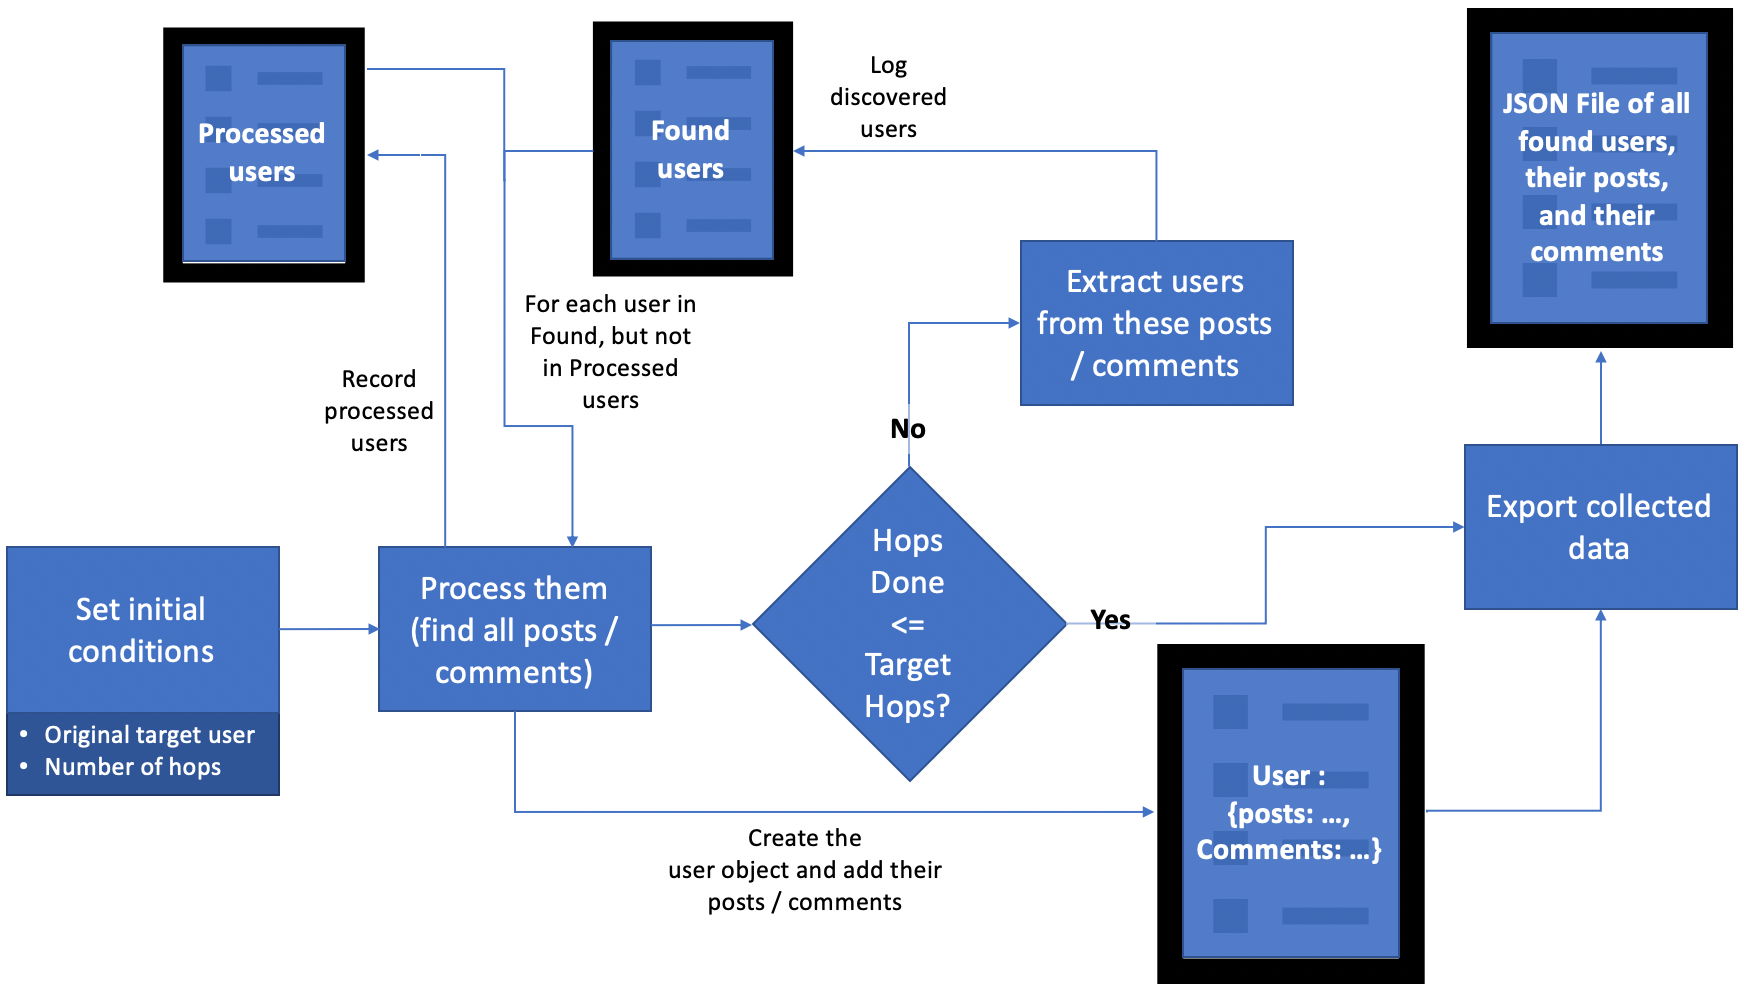
The overall code to do this, which effectively only relies on the PRAW library, comes in at around 200 lines of code.
There are a few things to be aware of with this code, not least in the approach we’ve taken. The problem with finding every related user, and then finding theirs, means that each hop increases the data volume exponentially.
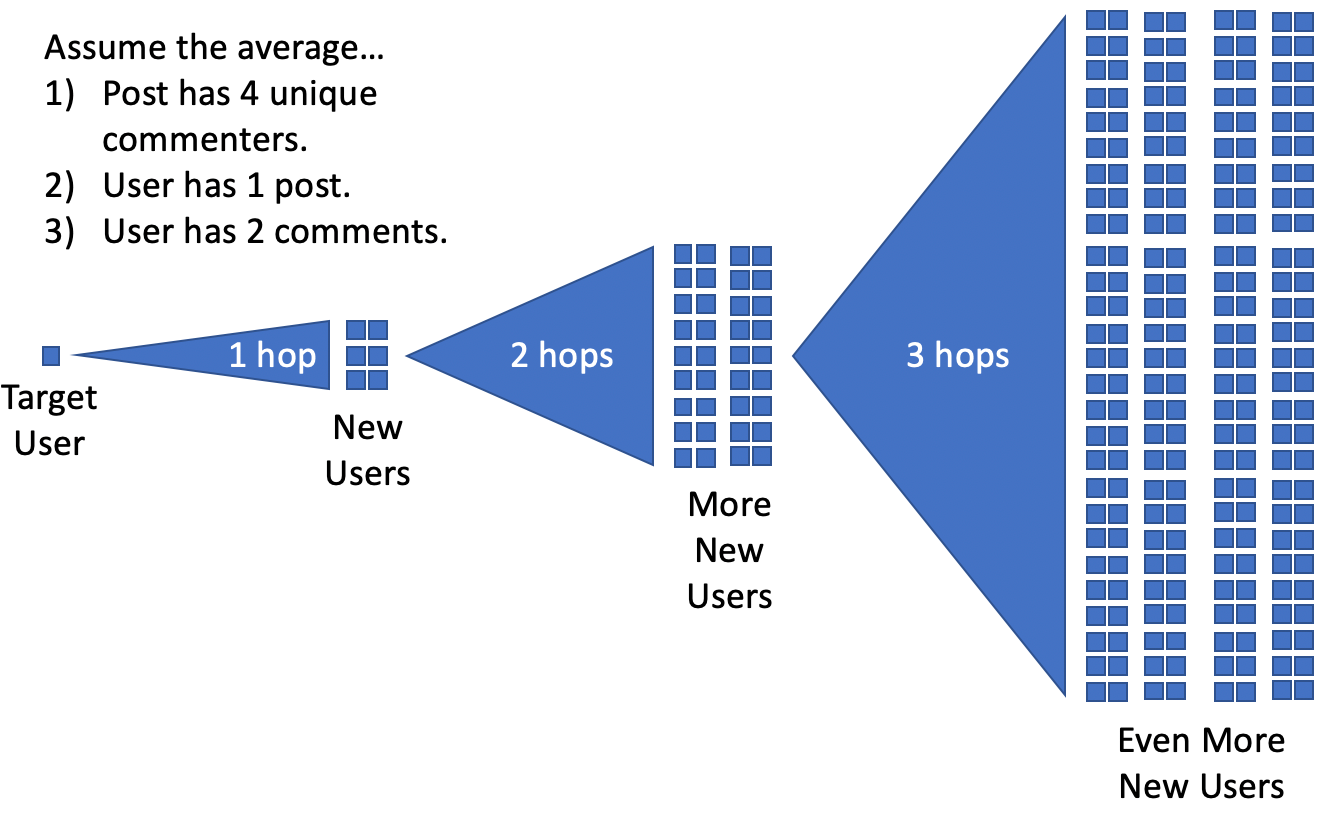
It’s clear to see, the more hops we go through, the exponentially greater volumes of data we’re going to end up with. Further, and much more frustratingly for the volume of data we need, Reddit limits you to 60 API calls per minute. PRAW goes further and enforces a minimum 2-second wait between API calls. So we can process 30 API calls per minute in reality.
For how the code works, we must submit a separate API call for every single post and comment by a user in order to find the connected users. We can immediately limit this by not scraping the same item twice (multiple people might comment on the same post), but we also limit each user to their most recent 100 posts and 100 comments. This is still a vast quantity of data, and means that processing a single user could take over 6 and a half minutes in a worst-case scenario. *See addendum below
To reduce needless processing, as mentioned before, we avoid scraping the same content or user twice. In reality, users are the big ones here, as they will require many API calls. This is as simple as recording who has already been processed and then doing a check before any API calls relating to them. We do the same for individual posts, in case multiple people comment on the same post.

One quirk that appeared on the first multi-hop run of this script was that some users were generating an error in PRAW. On closer inspection, it turns out these users had been suspended. Suspended users may retain all their comments and posts on Reddit, but their profile becomes completely inaccessible.
We also want to make sure we record the data in a useful state. In an attempt to make this as simple as possible, the code initializes an object for each user, which contains their relevant data and methods to manipulate the data attributed to them.
For context at this point: From starting with one user with just 4 posts and 12 comments, after two hops we’re up to over 37,000 users, with a data file clocking in just under 500MB.
Building a Graph Database

In building a graph database, there’s an element of working backward. We need to know what we want to achieve before we go and get the data. In the interest of giving you a flow of development, I haven’t really mentioned the data model, but the image above gives you an indication. We want to go from users to any posts they’ve made or commented on (or both). The easiest way to do this is to create a single CSV for each of the above parts: A user table, a posts table, and a connections table (which also includes the name of the user and PostID so we can link them together).
Each individual connection between a user and a post will have its own line. The only really quirky part here is the Comments JSON field. This just means that this field will contain a JSON markup with any comments made. This is important, as we only want one row per User -> Post connection, but a user can make many comments on a single post. This isn’t critical for our graph database to work, it just means we can extract some extra detail on their types of comments more quickly and easily.
Our graph database software of choice here is going to be TigerGraph. It offers a handy developer edition, though this is admittedly limited to 500MB of data and struggles with large graph visualizations. Plus, I have a particular fondness for GSQL as a graph query language, especially over Gremlin. So, in step 1, we define our graph schema.
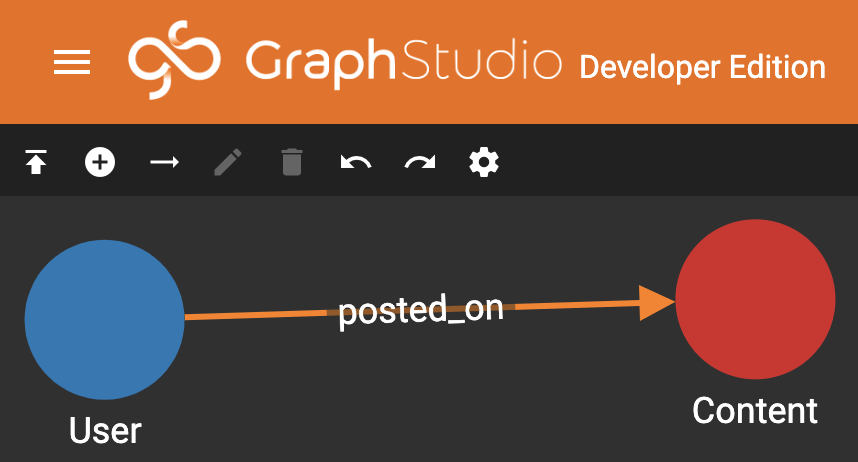
Voila! It really is as simple as that for us. At the absolute lowest level, this is what our graph is trying to do. Who posted on what? We’re actually not treating comments or posts separately because the connection would look the same, just with a different word saying “commented_on” instead.
Next, we need to attach our data. We upload our data file and start telling TigerGraph which fields of our data related to which features in our graph. For instance, a username in the data relates to the User bubble. A post ID (puid) in the data relates to our Post bubble. The edge connecting the two bubbles is a special case and takes both of those fields. This special connection is where the magic begins in a graph database.
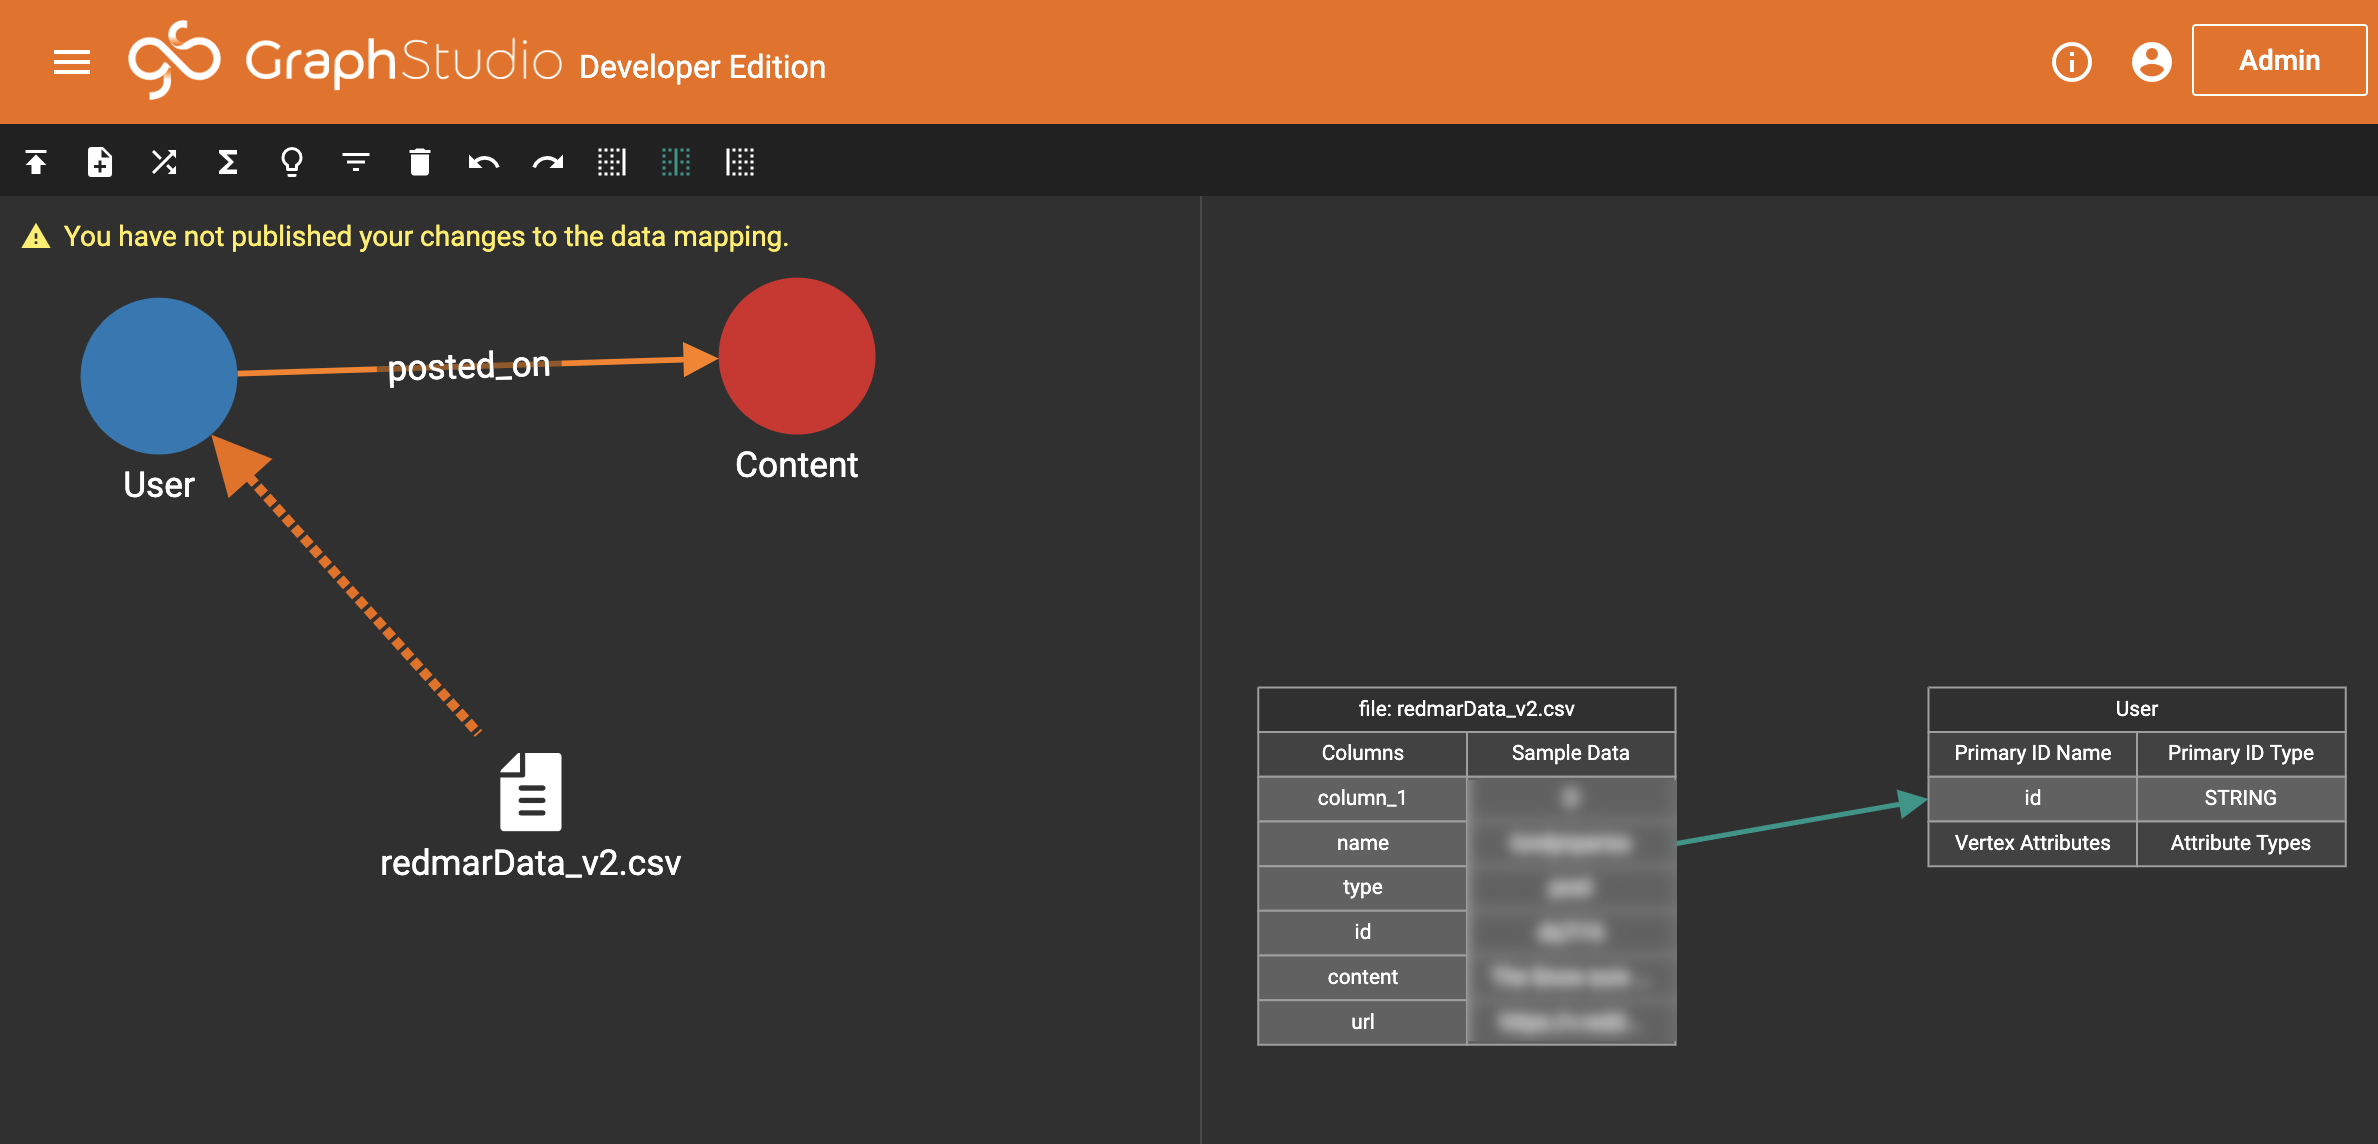
On the left of the screen, we tell TigerGraph where we want to make a connection between our data and our graph schema. On the right, we give it the specifics. We repeat this process for the Content vertex (on the Post ID), and again for the posted_on line (which takes two entries, one being the username and the other the Post ID).
Onto step 3: This is really easy. We just say that everything is good and, yes, we want to build a graph database on what we’ve set up. Hit run, let it do its thing (it’s surprisingly fast, even when running just on my 8GB MacBook), and check the stats.
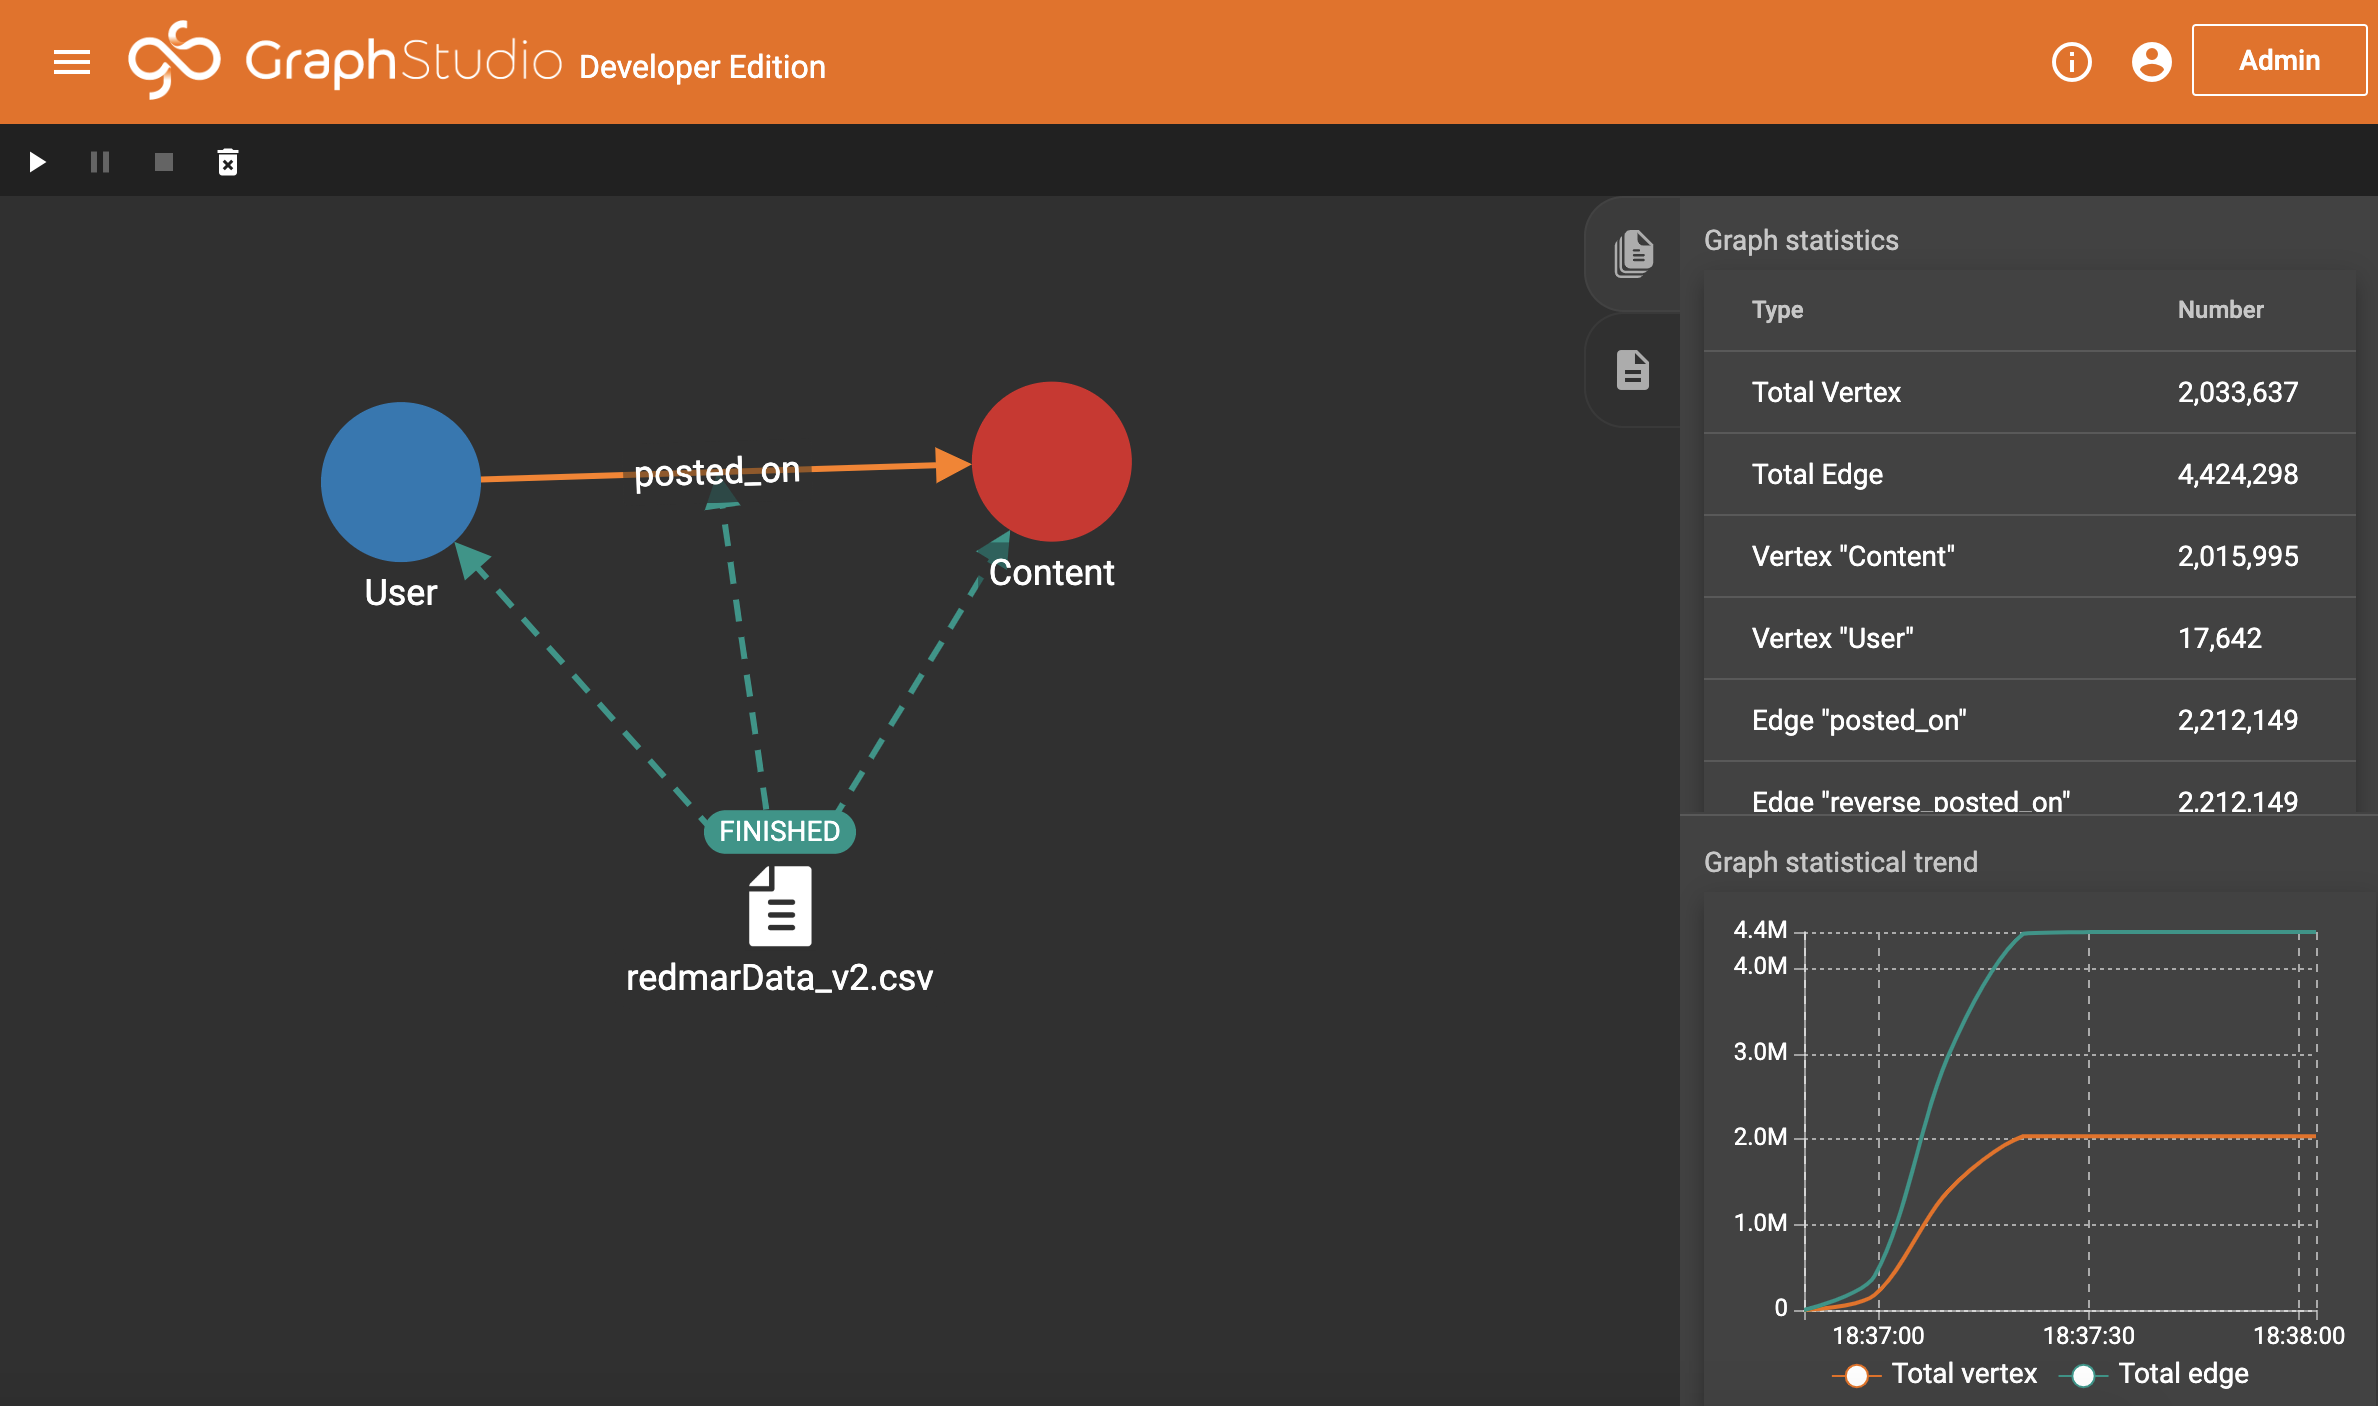
We’ll linger here for just a moment to look at those stats. 2,033,637 vertices, of which 17,642 are users and the rest posts. This was from only two hops worth of data! We also have over twice as many edges as vertices, which is a good sign for finding internal connections.
So, let’s get to the good bit.
Exploring the Graph
We move onto stage 4, visually exploring the graph, the final stage of what we’ll be looking at (although there is a stage 5, which is writing GSQL queries, which is beyond what we need to do for now).
To begin with, I’m going to ask TigerGraph to return the user we started with, the cause of this entire project.
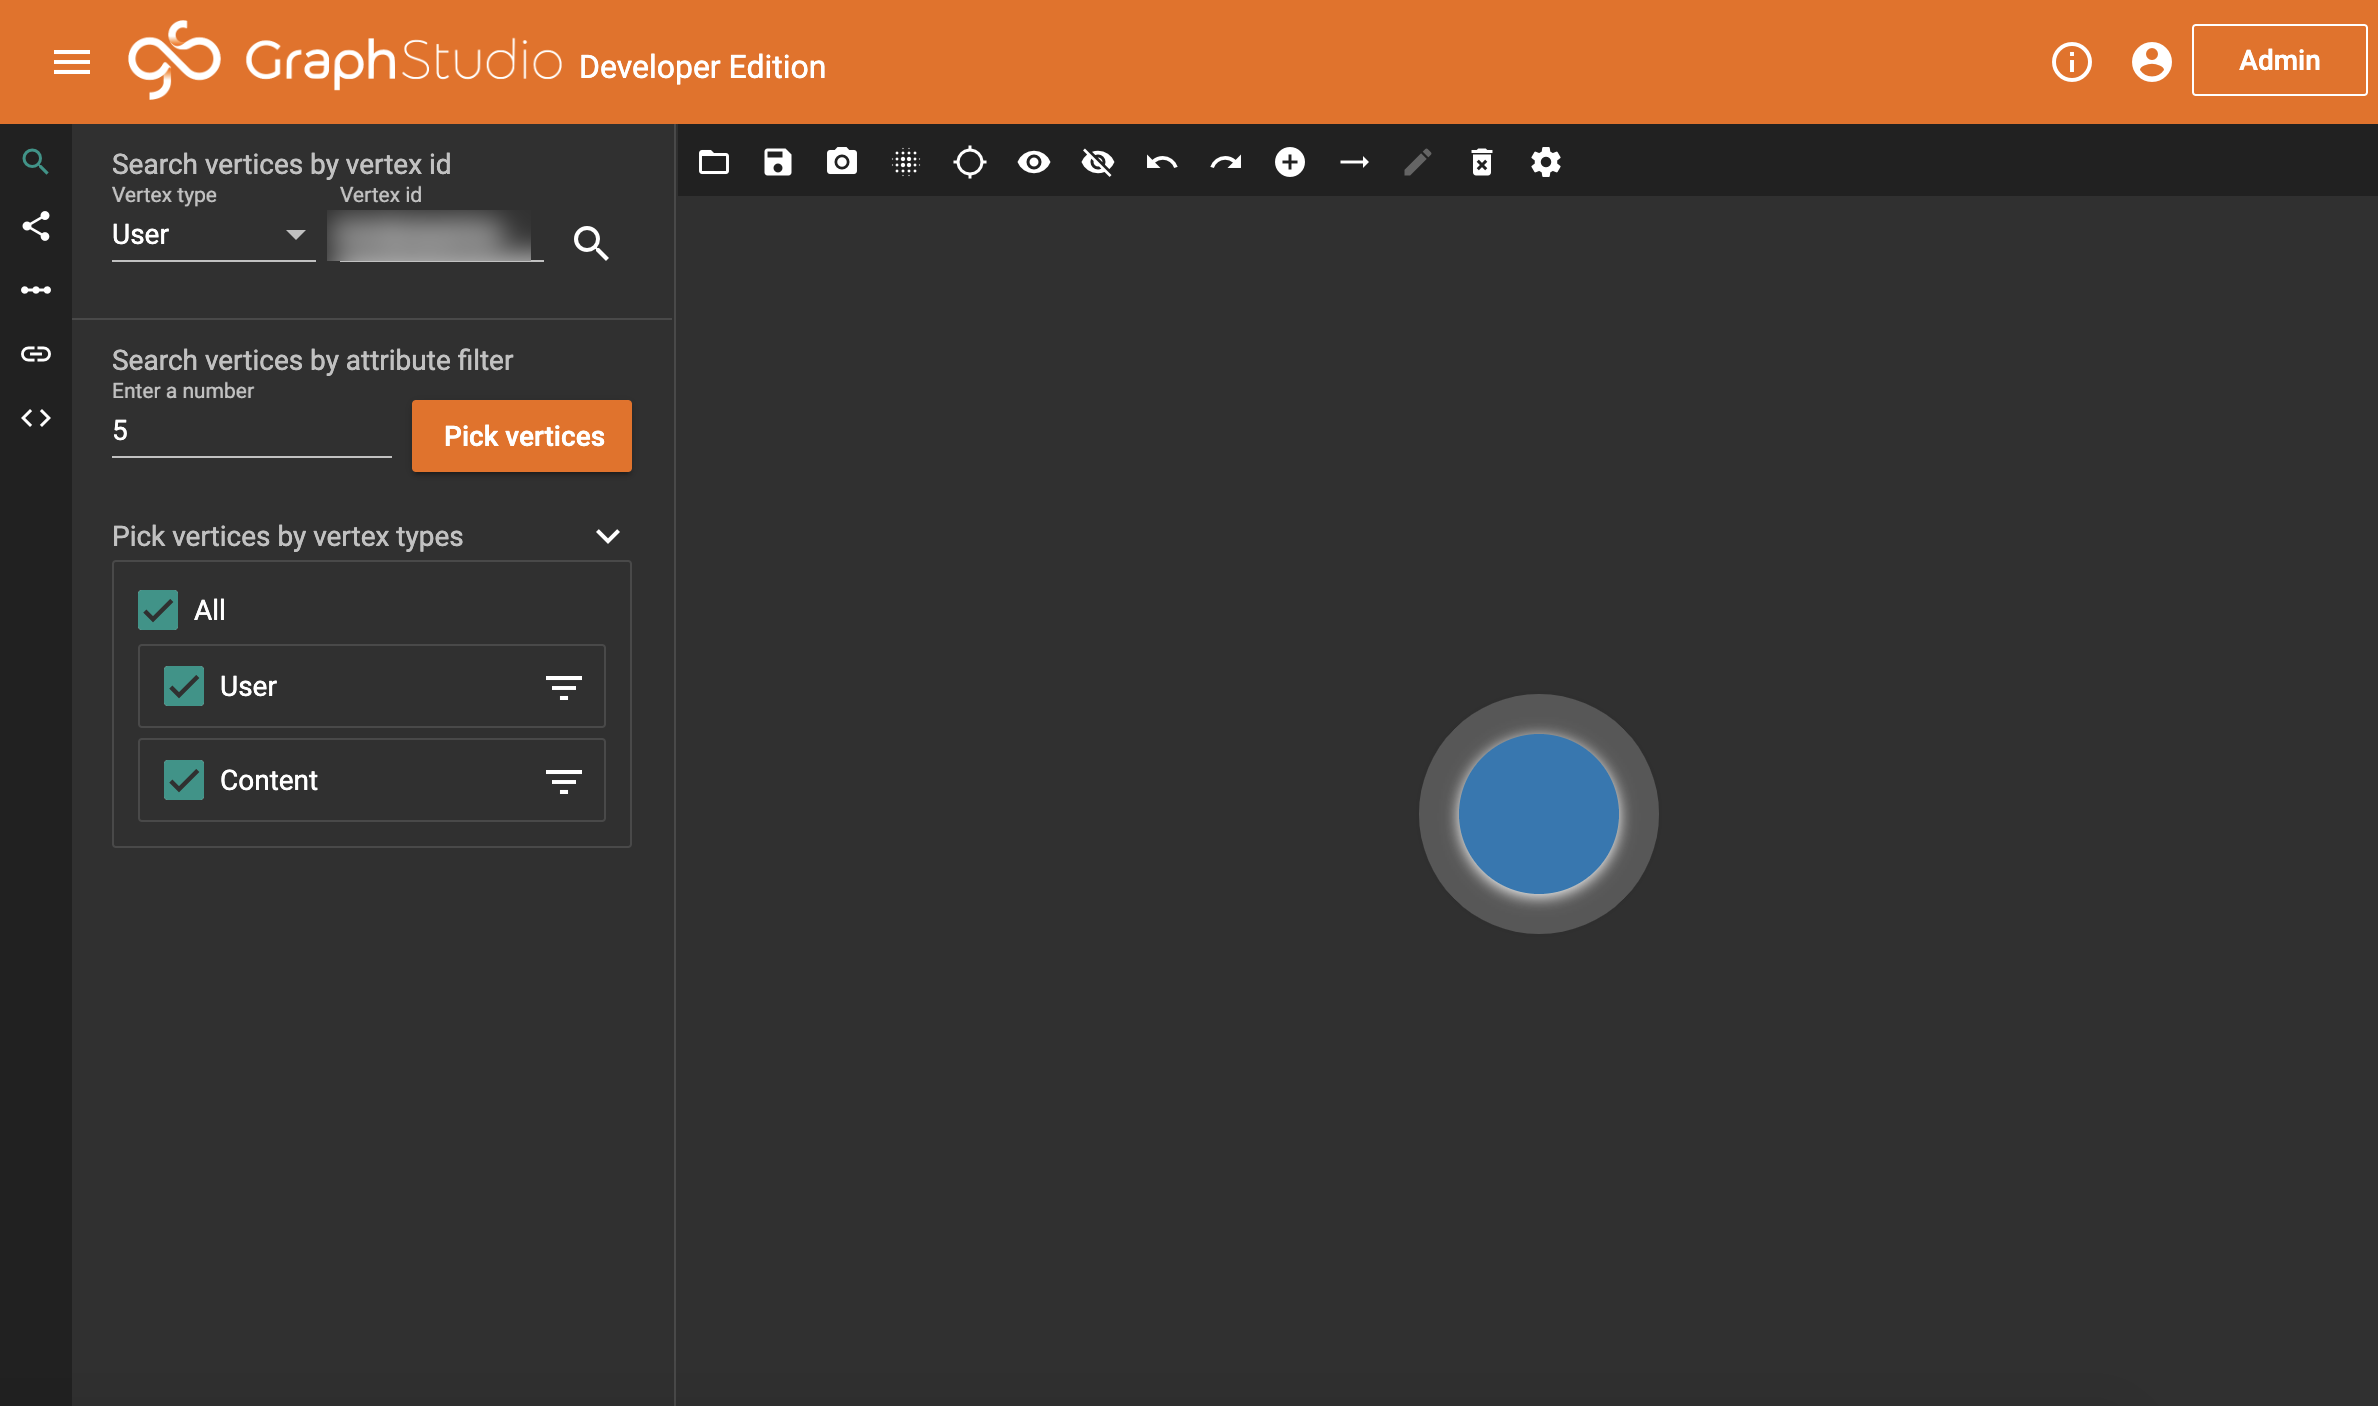
And now, we double-click on this bubble. And we get…
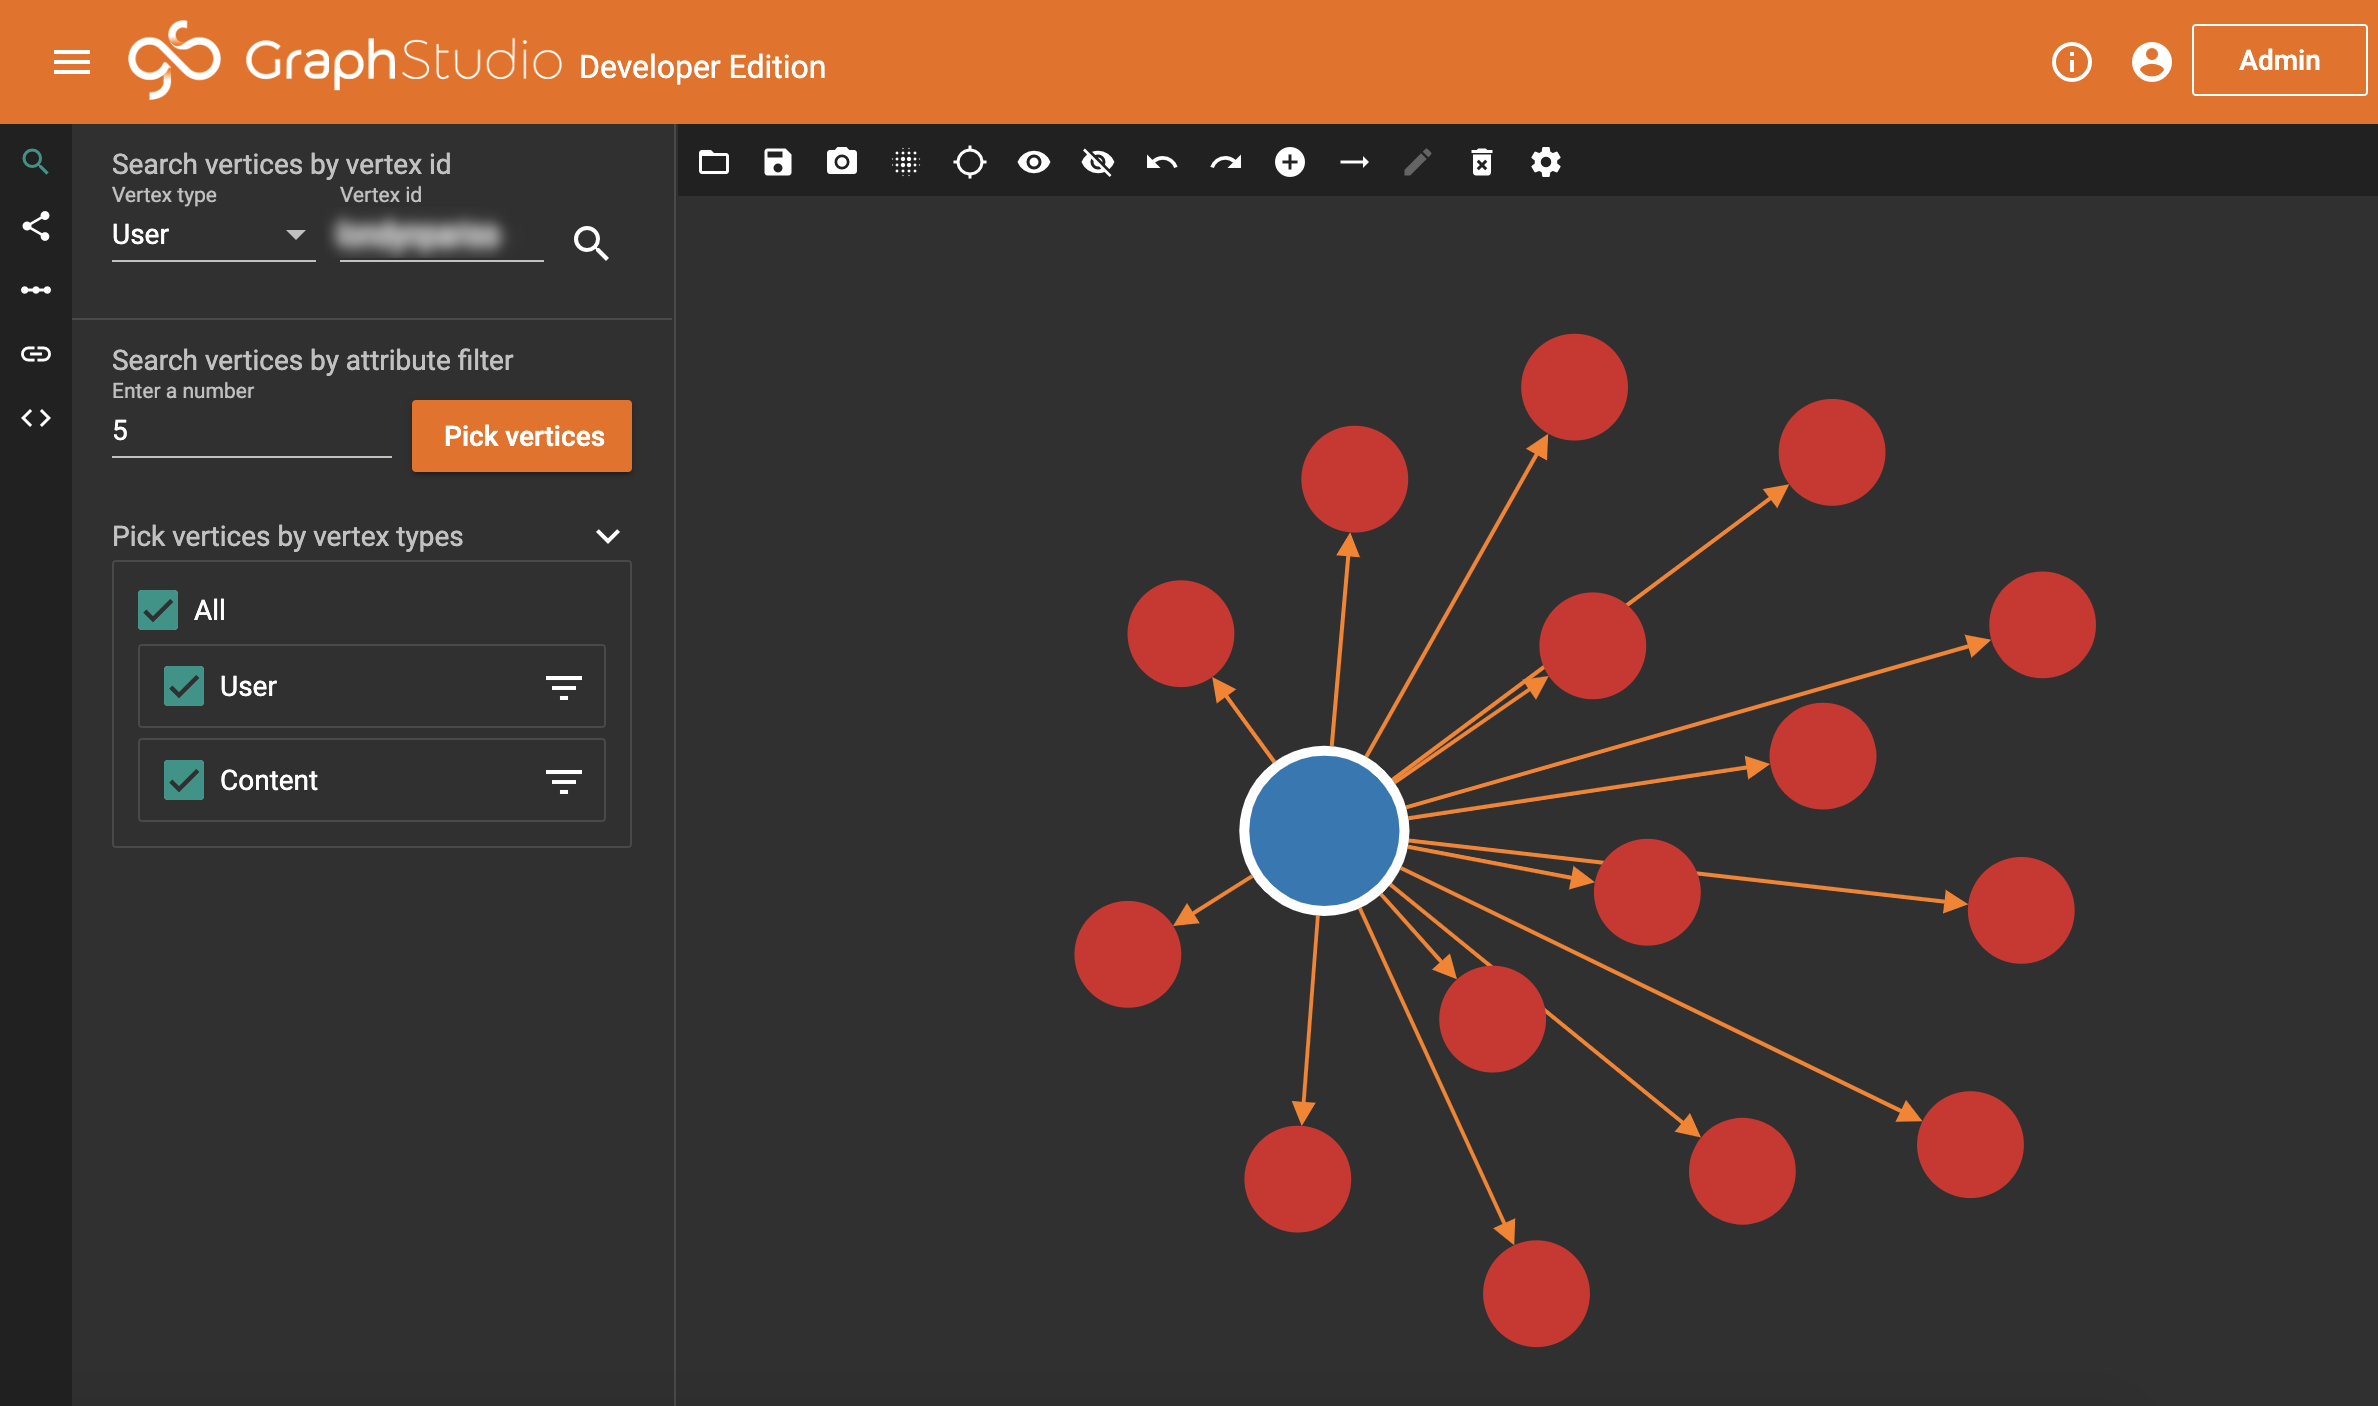
All their posts, and posts they’ve commented on! So, for a final check, let’s just quickly double-click a post and see what happens.
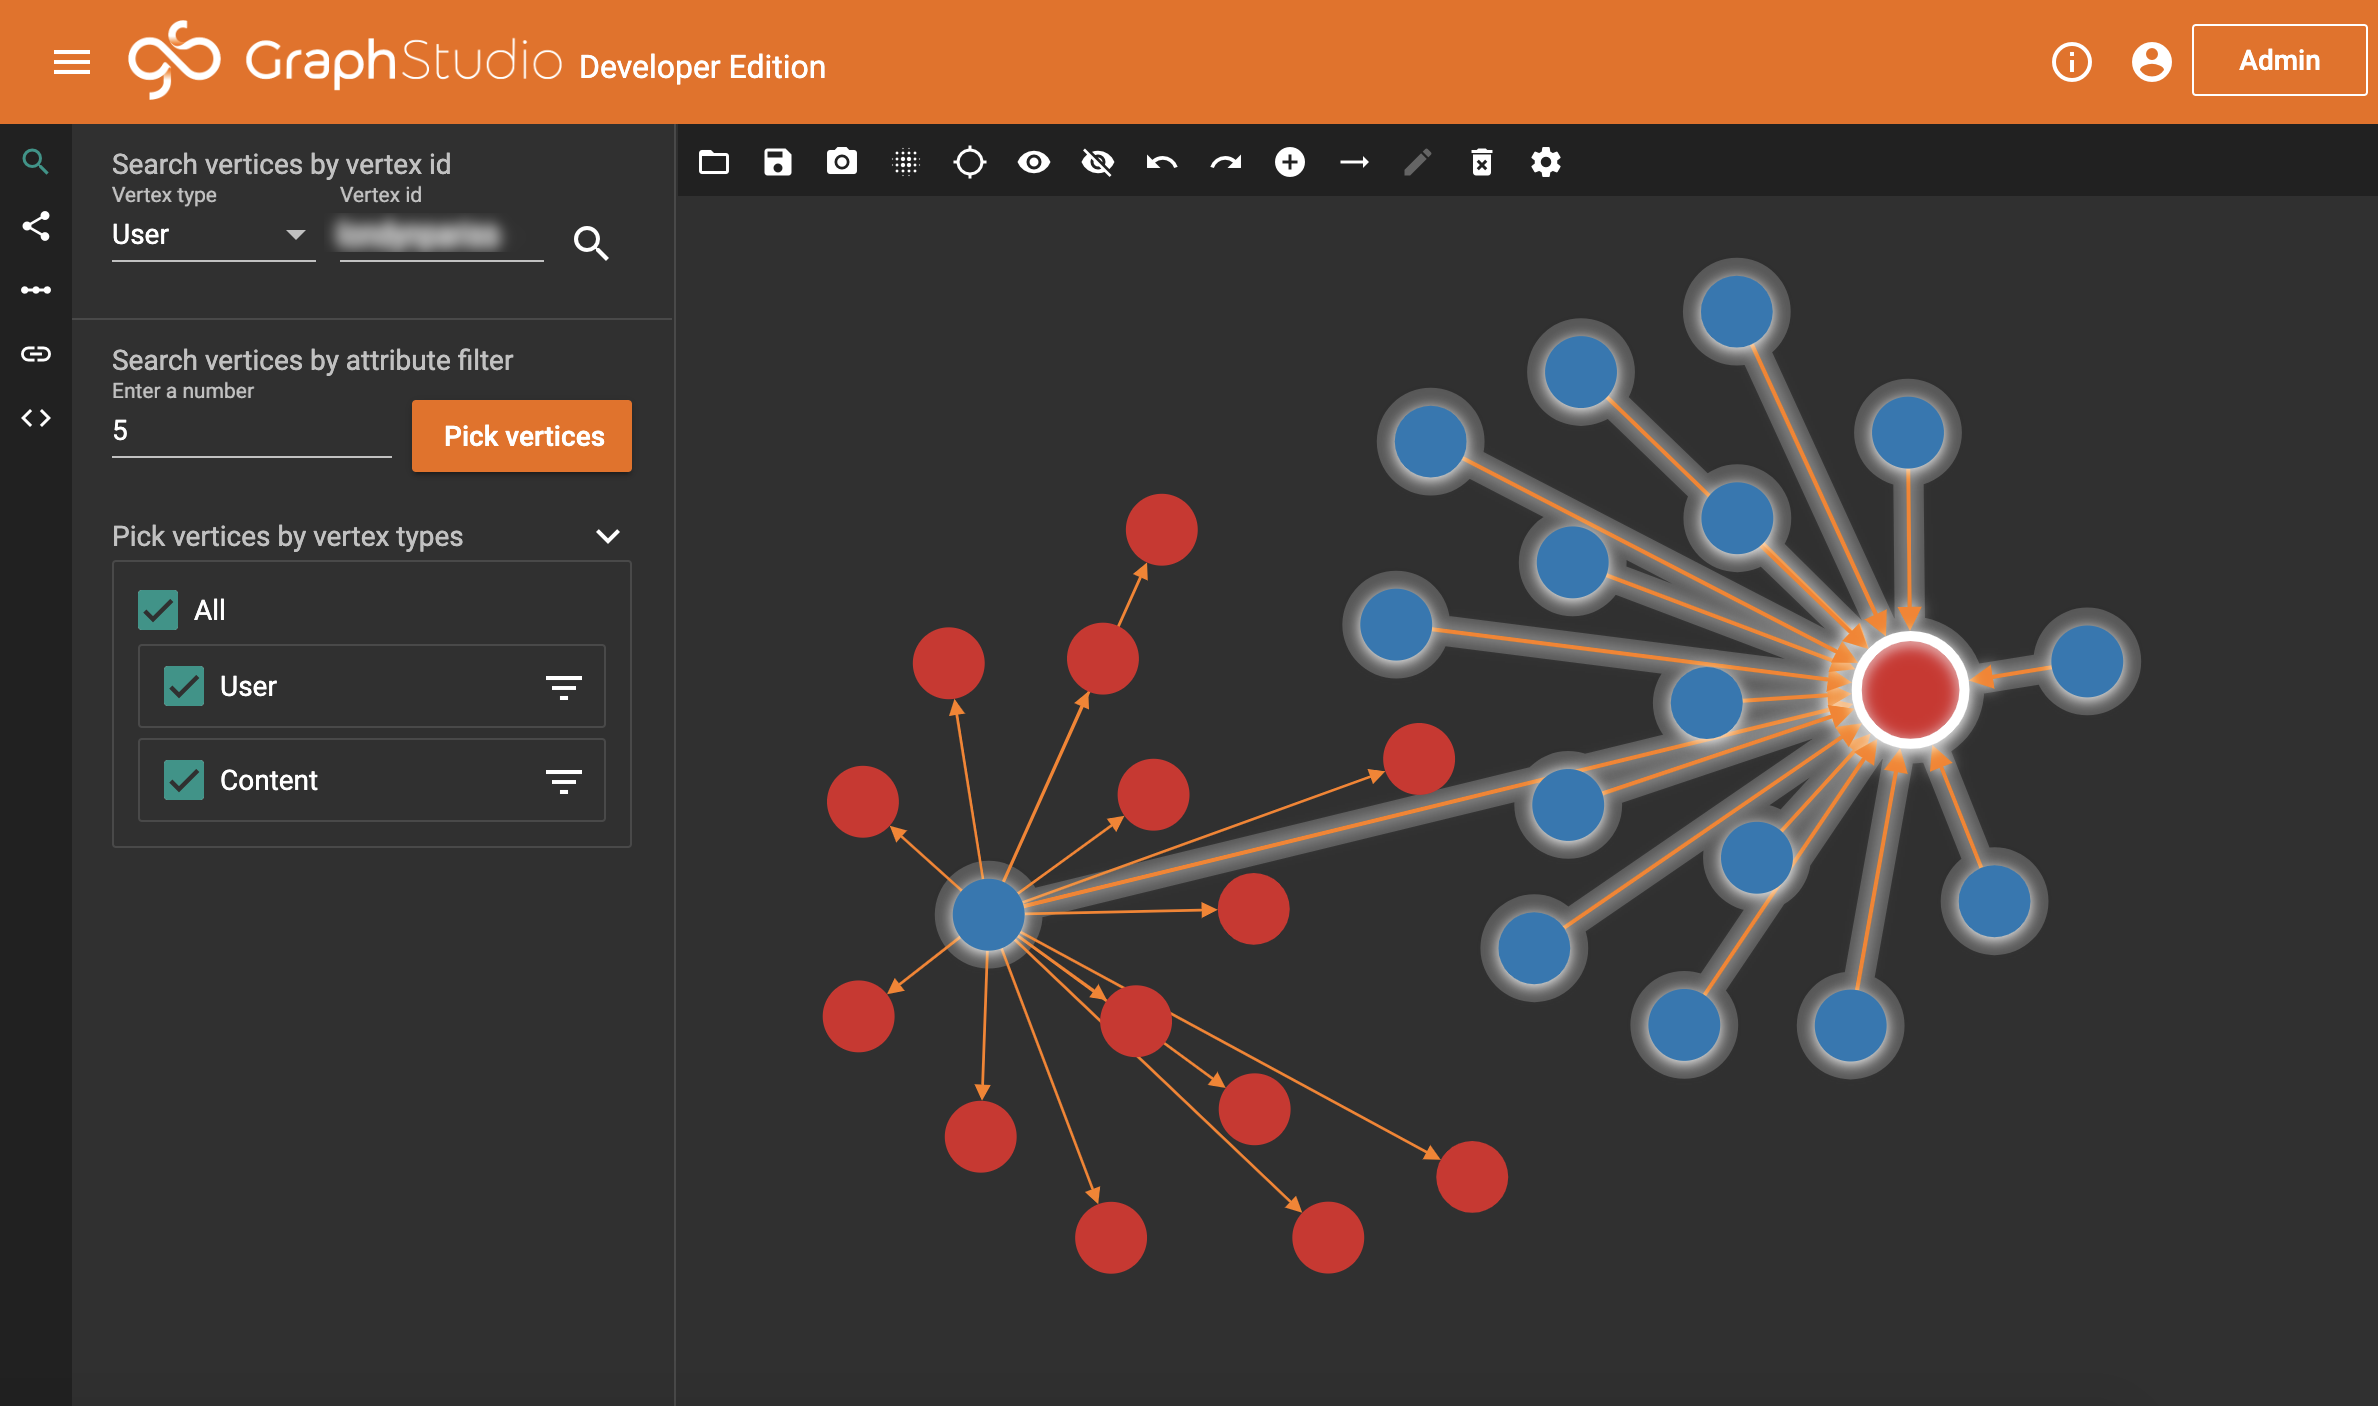
Amazing. – looks like it all works. So, we’re going to go one bigger. We can also tell TigerGraph to, starting from our origin user, expand out to any relevant posts. Then from there, to any relevant users. Then again to their posts, and so on. We actually only need to do this process a small number of times before we duplicate our hops. There is one catch though: This version of TigerGraph can only show a certain amount of data. So we’re going to tell it to sample and bring back most, but not all, data. We could miss useful things this way, so in a production environment, this wouldn’t be appropriate. Alas, let’s go ahead and see what we get.
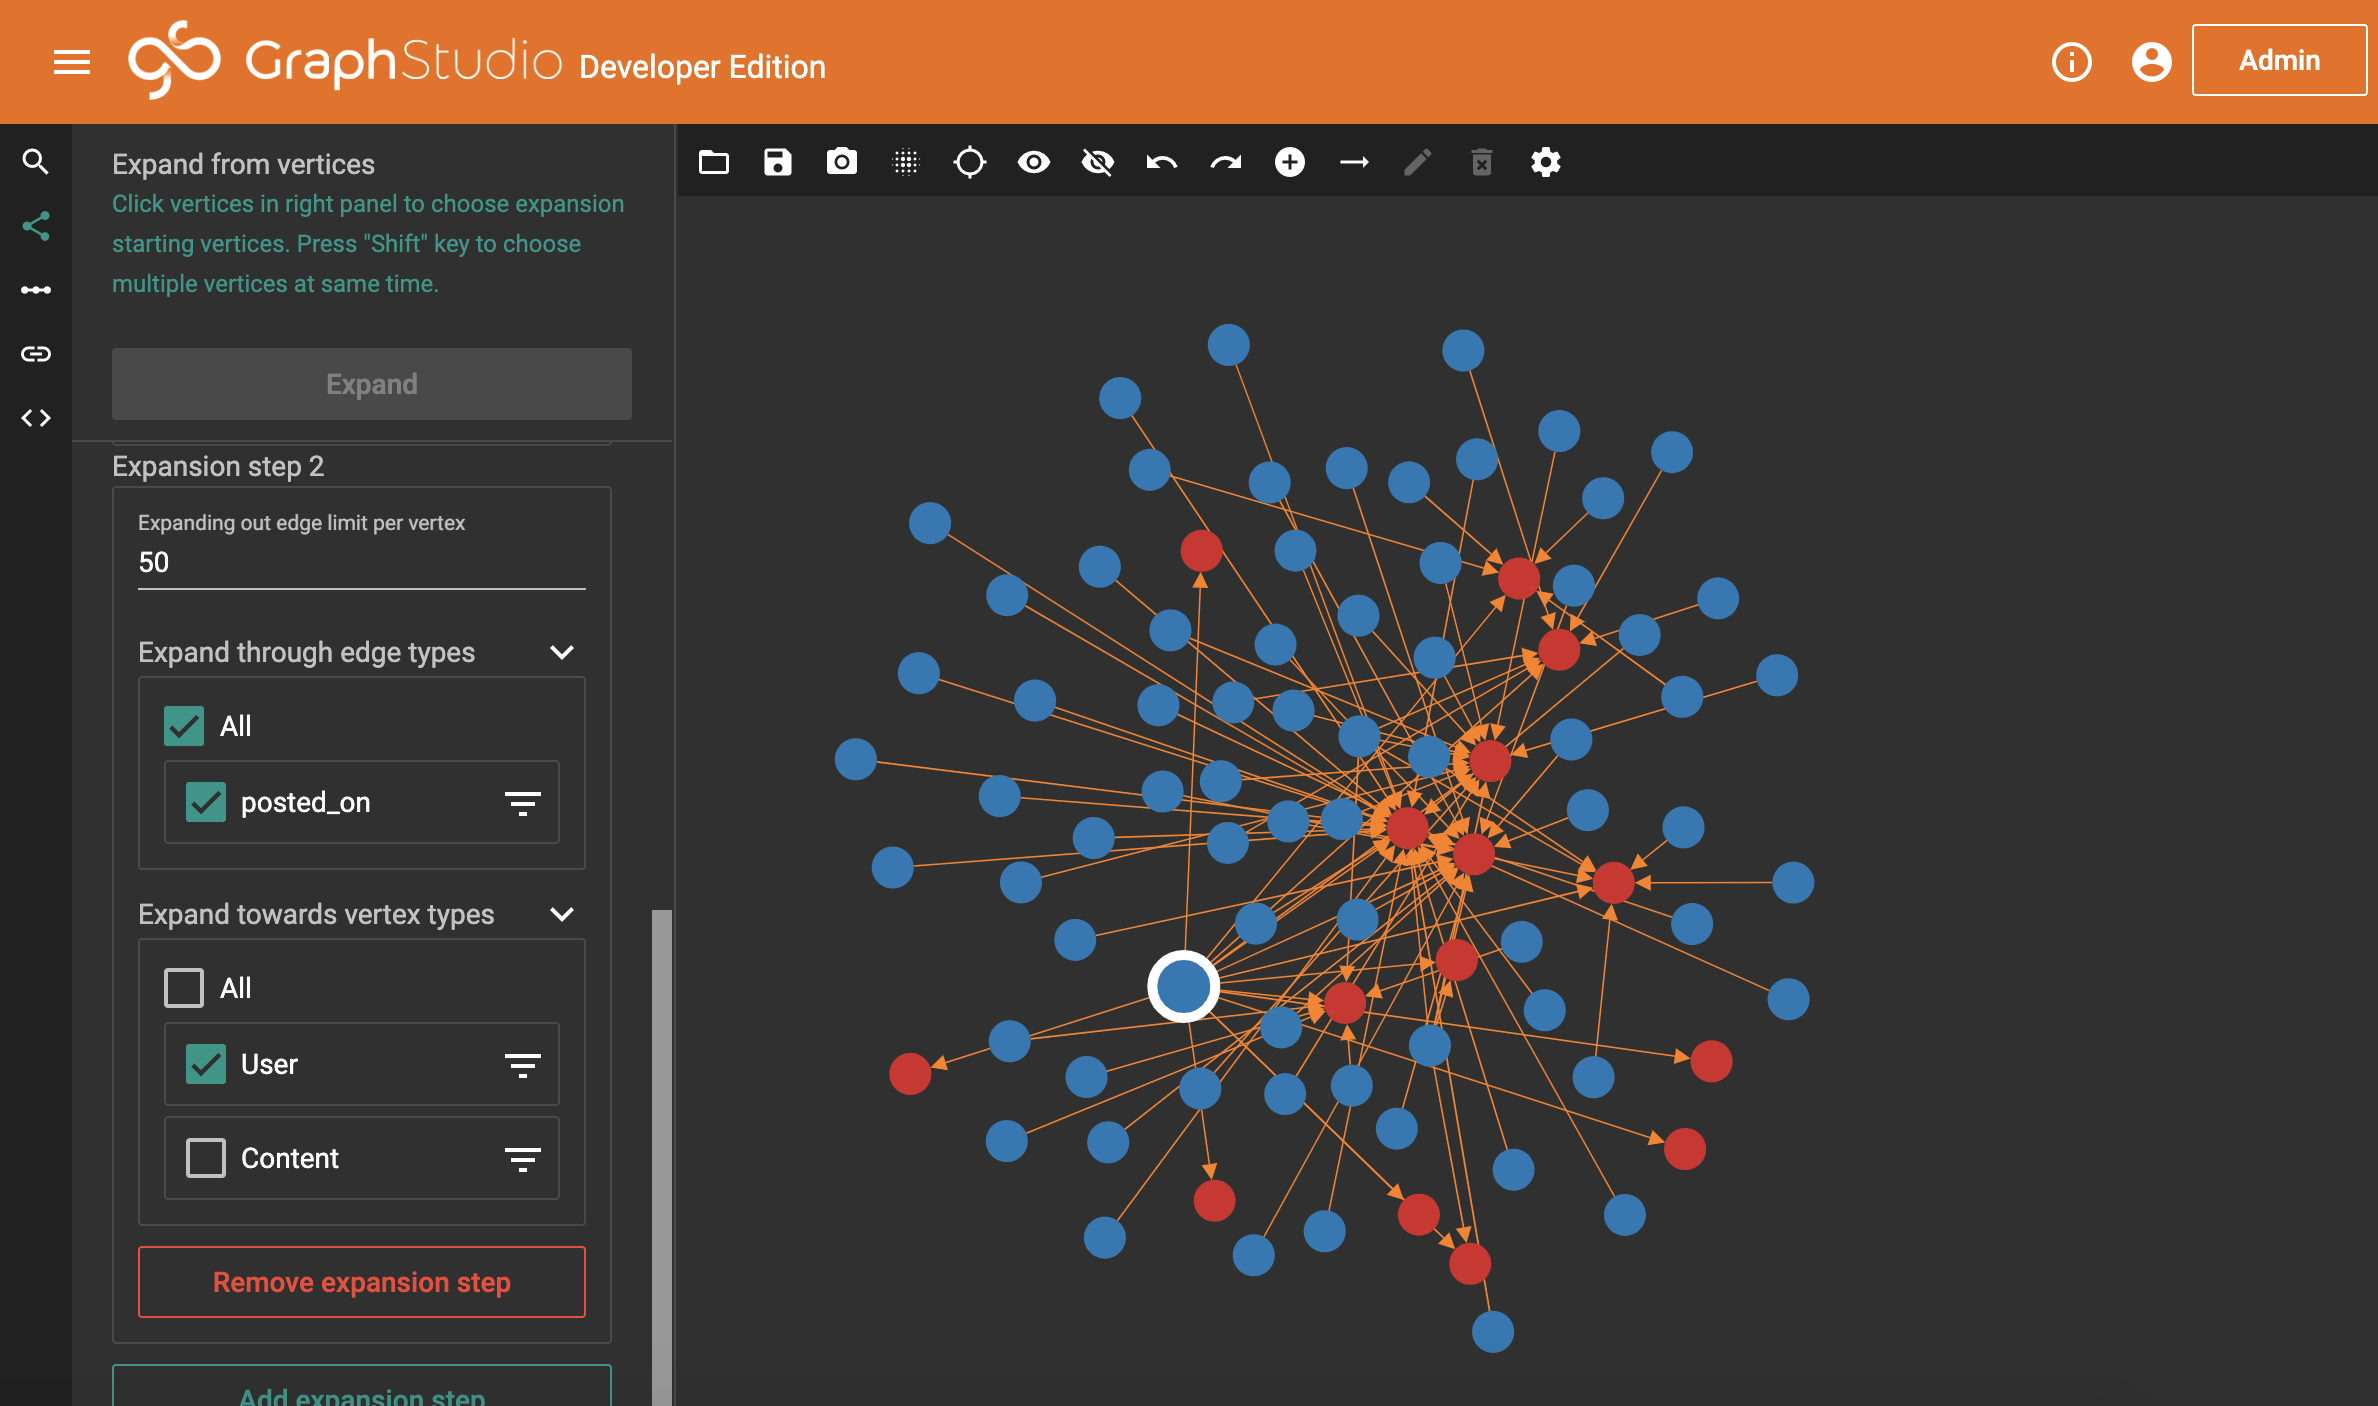
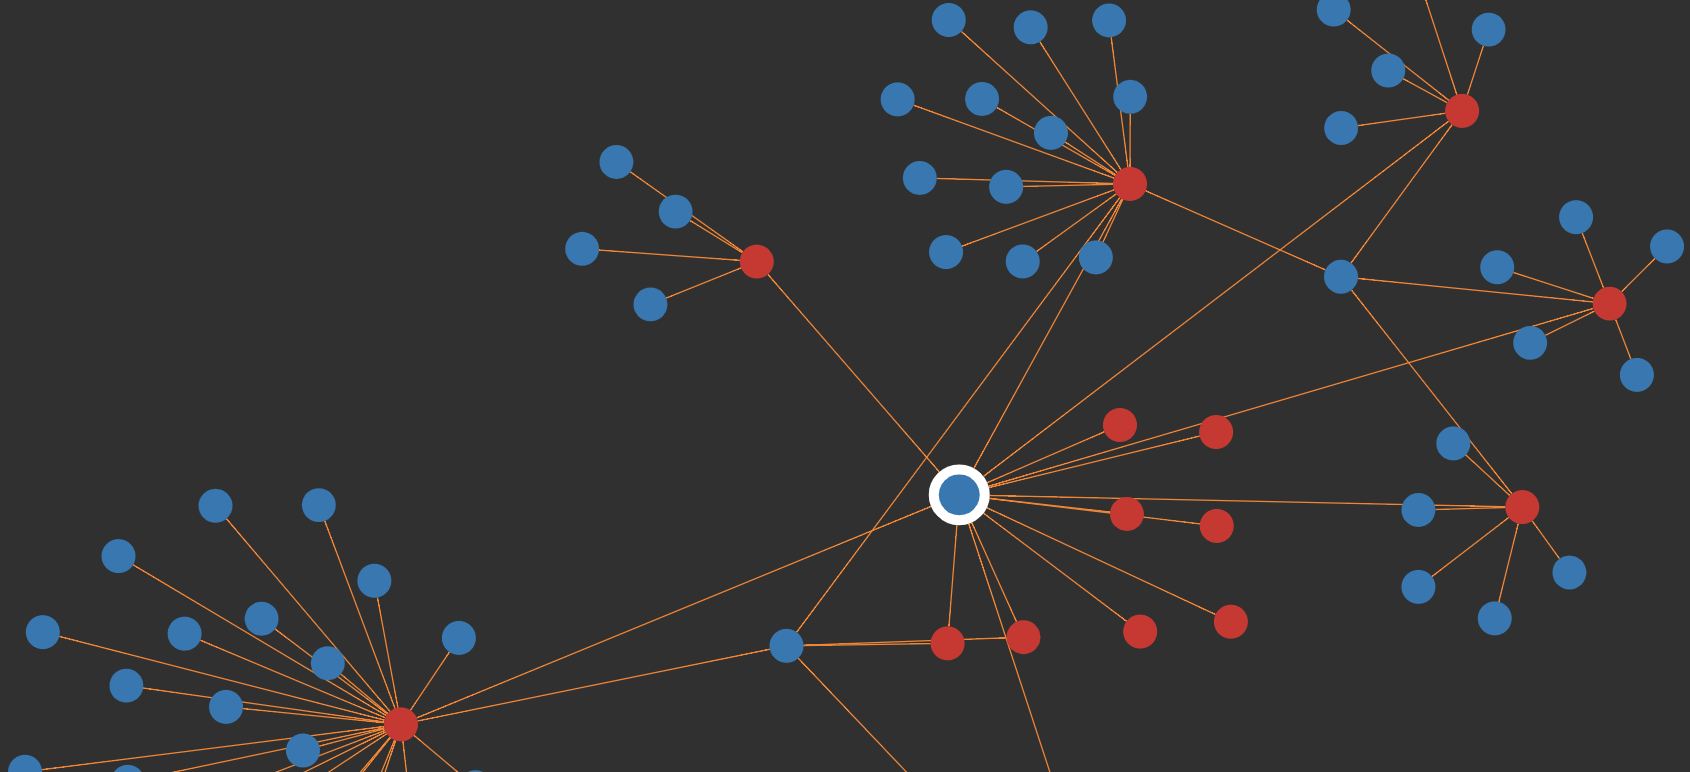
And this is what we get. We’ve asked TigerGraph to bring back the first 50 bits of relevant content for our origin user (for which, there are only 15 pieces anyway, which we know from when we double-clicked earlier), and then bring back 50 users attached to each of those posts. Luckily for us, the actual volumes here are small. But, it’s not particularly nice to look at. TigerGraph has a handful of options for changing how the data is shown. If we choose the circle mode, we get something nicer.
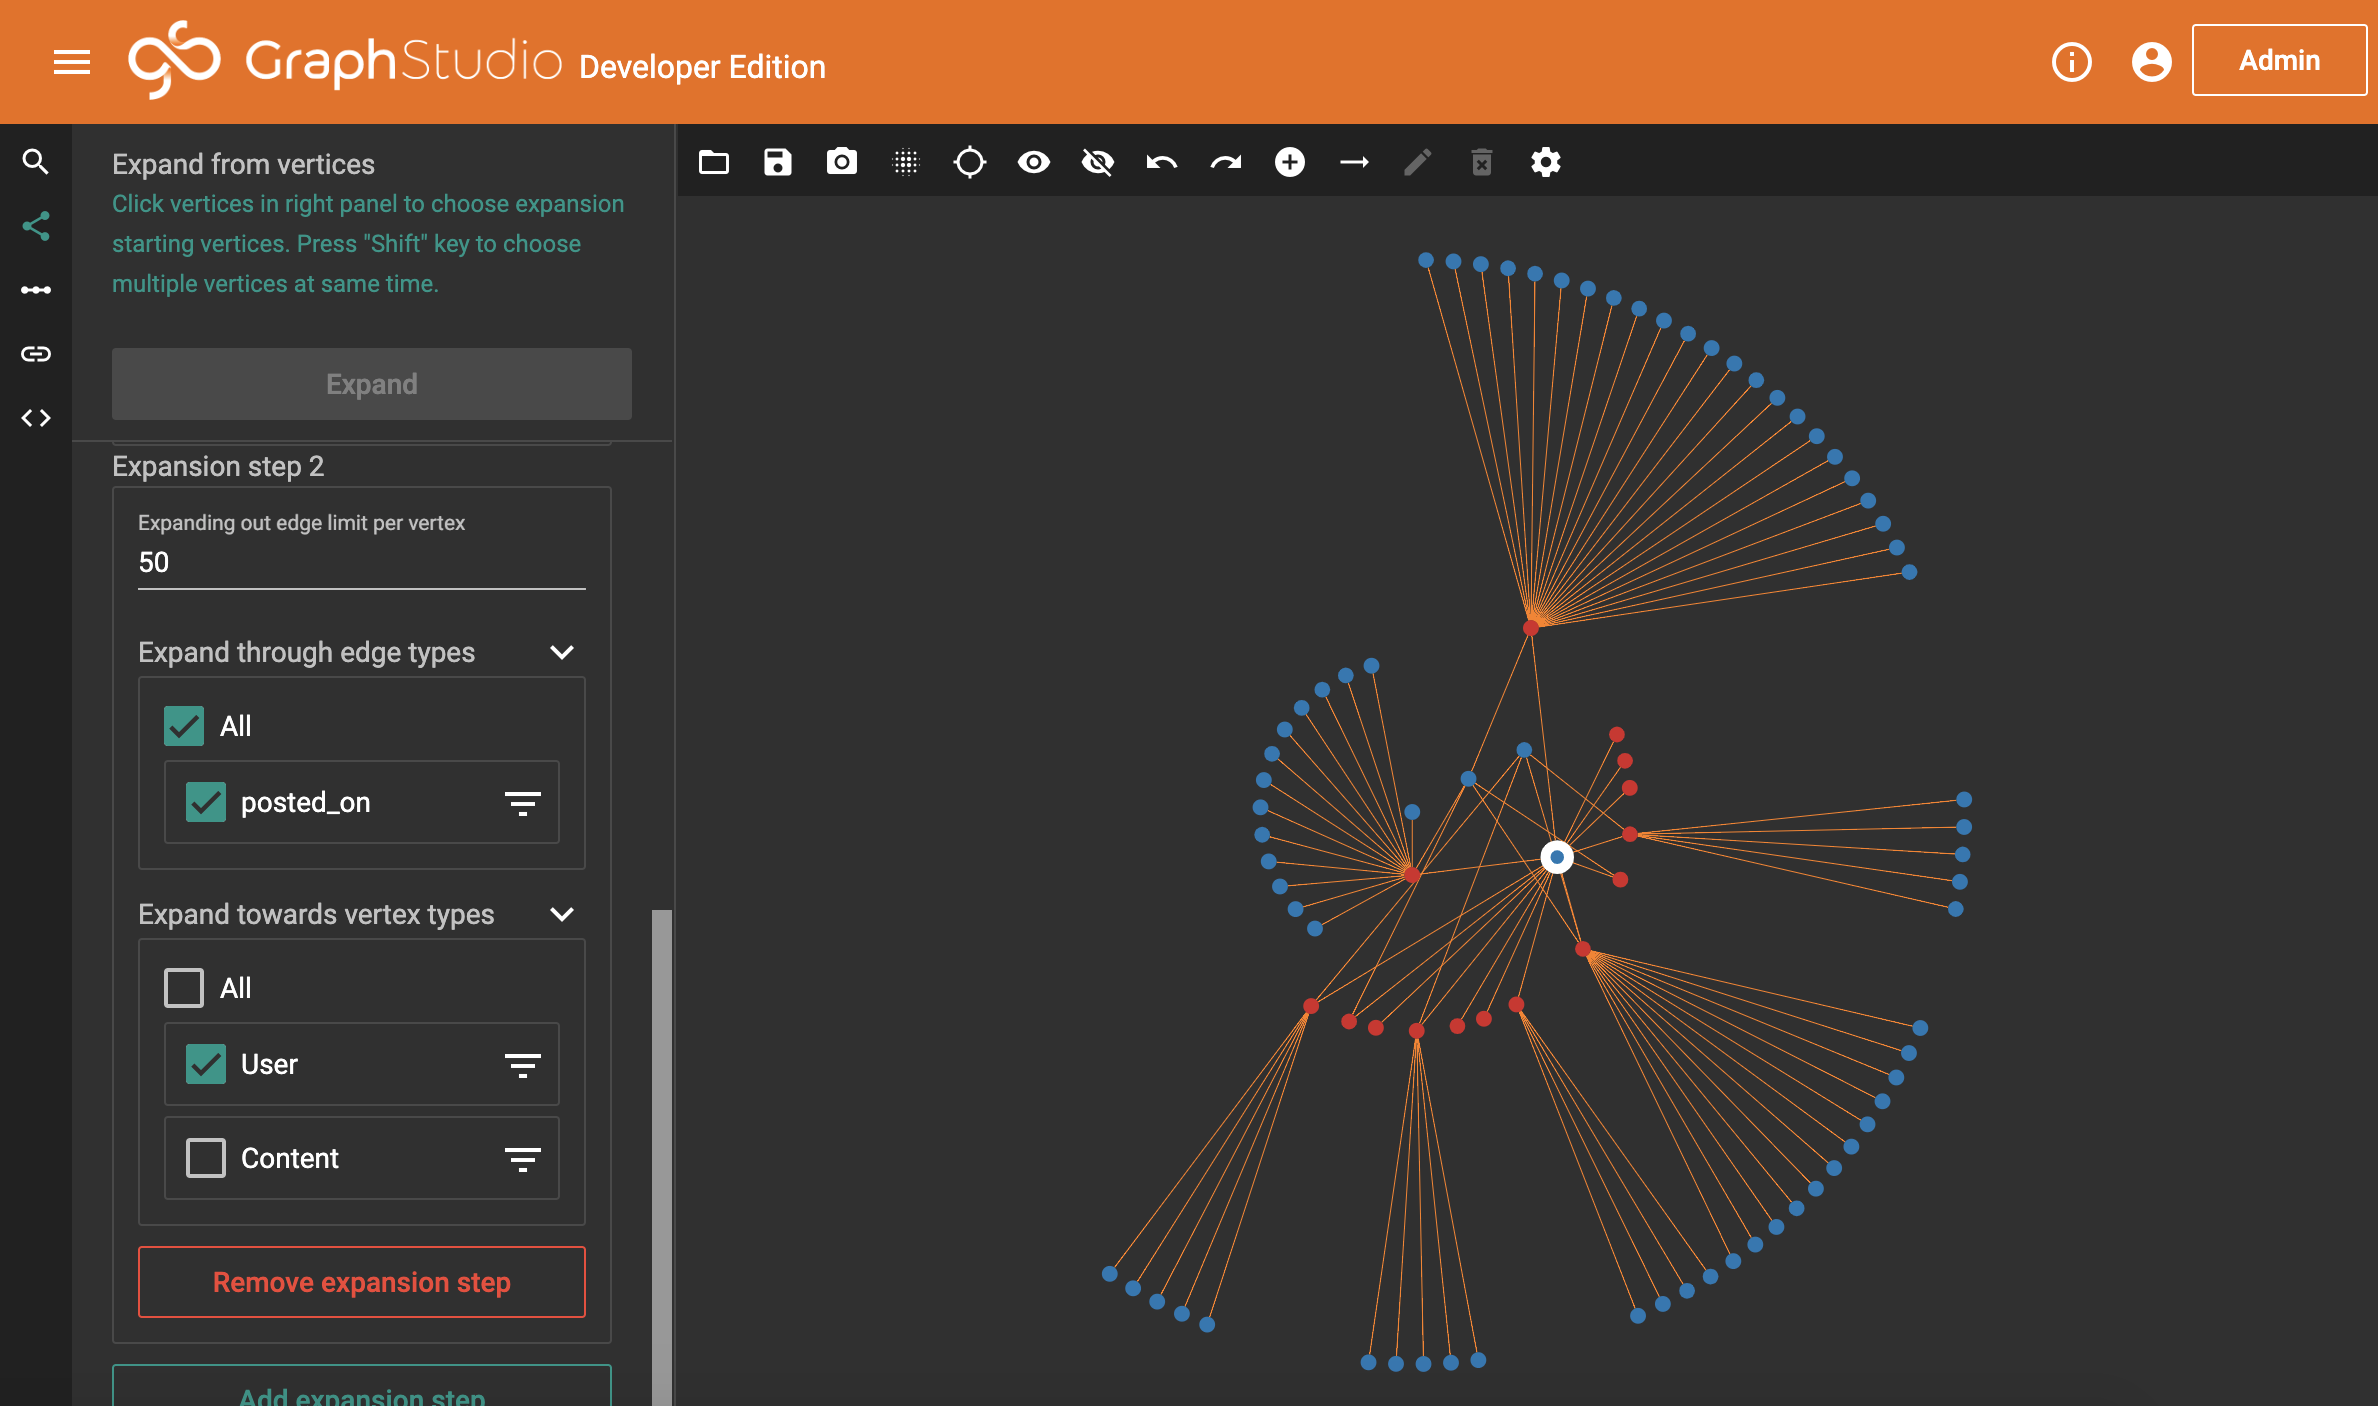
Amazingly, the circle mode almost perfectly suits what we’re trying to do. We’re now seeing something really useful. Each of those lines dictates where a user has commented on something. What we’re looking for is where users (blue bubbles) have lots of lines. In reality, we’re simply looking for where there’s more than one line.
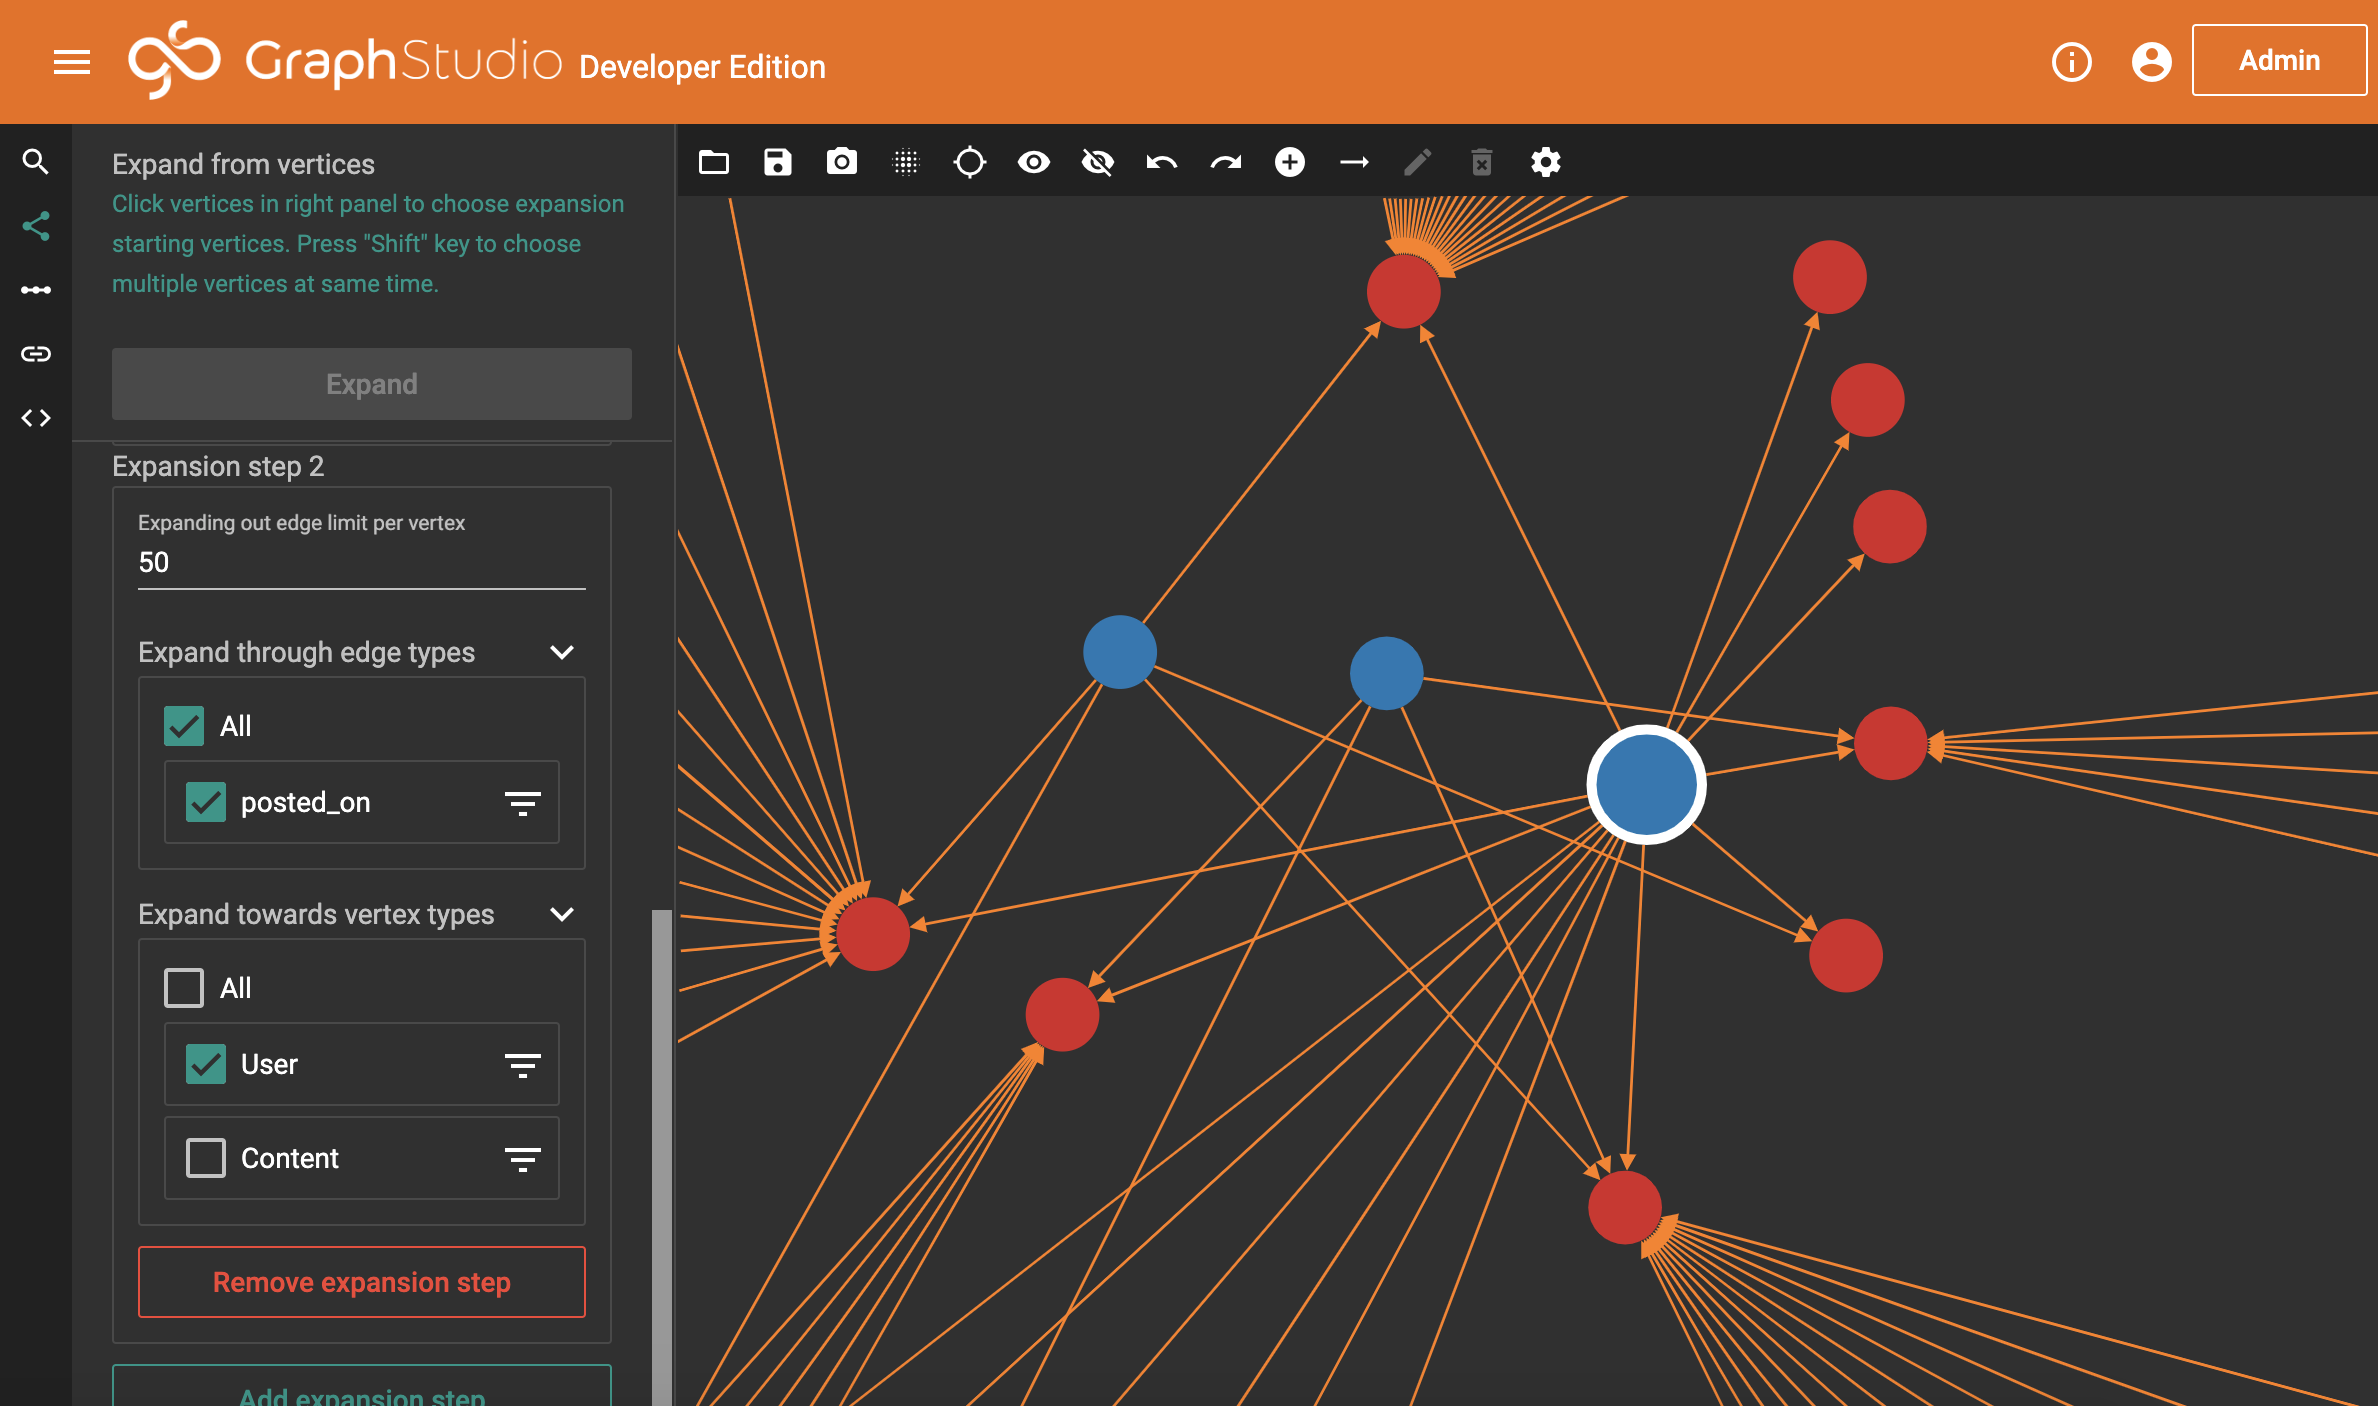
We have three users here that stand out. They have a number of connections between them, which on viewing more closely we would discover are always a mix of where one of them has posted and another account has commented. We also have a single post which all three accounts commented on (the bottom-right bubble).
But why is this suspicious? Well, look at the image posted before we zoomed in. Of all those blue bubbles, only three have more than a single connection. Reddit is a huge website, it’s deeply uncommon for people to comment on the same things, even on highly popular posts, and we can see from the small number of users (when we asked for 50 per post) that this is not particularly popular content.
So what now?
Findings and Conclusions
This alone isn’t enough to determine astroturfing. Far from it. But I can assure you that looking into these accounts guarantees it (and, as I showed right back at the start with the Soundcloud comments image, we already know it’s happening). But it does suggest graph databases could be used to find astroturfing activity with relative ease.
There are a few counter-arguments. What if friends comment on each others’ content? What about really, wildly popular posts? What if there are ‘Reddit celebrity’ users that always attract the same audience to their content? This approach isn’t perfect, but we can use more traditional methods to filter this out. Rules like “Only show me users with connections to more than a single post” and “Whitelist these users to ignore them and their content, as we know they’re okay” would be a massive help.
The biggest issue I’ve had with this, by far, is getting the data. There’s just so much and the ability to access it through the API so slow that I can’t possibly get enough. However, if you already had all this information and could dive straight into the graph database side of things… (cough cough, Reddit admins, cough).
This approach does work. It’s surprisingly simple to do. In fact, for me, the hardest part was getting the data in the first place. It isn’t a be-all and end-all, you still need to take the output from your graph and investigate it.
During the course of this project, I made a lot of twists and turns, and I endeavor that you read the addendums if you have questions. If you have questions I haven’t covered, do put them in the comments section.
Thanks for reading. It’s been a surprisingly long road putting this together. Let me know in the comments if you’ve got ideas on how you could use graph databases, or where I missed building in functionality for this Reddit tool!
Addendum for Unanswered Questions
What do you mean by Post and Posted? How can a commenter Post on a Post? What is OP?
I will be brutally honest that this is my own laziness and familiarity with Reddit-speak. On Reddit, you have submissions and comments. Submissions are links to content or text posts which start a conversation. You reply to submissions with comments, and you can reply to comments with other comments. Submissions are often called “Posts”, and the person who made that Post is called the “OP”, or “Original Poster”. Because our graph model only tracks posts as nodes, irrelevant of whether the edge was by the OP or a commenter, all content has been made on a Post (Submission). I might say an OP posts a post and a comment is posted on a post, but what I mean is a user submits a submission, a comment is commented on a submission. It’s best not to overthink this, it’s a simple concept I’m over-explaining.
How come the graph section doesn’t match your outlined data?
You might have noticed that, despite writing out at the start of the “Building a graph database” section the format we’d be using, that isn’t used. After about two months of playing around with this idea and trying to refine it from my initial build, I realised I’d actually already achieved what I was trying to do, which was to prove Graph Databases could be used to find astroturfing on Reddit. All the time I spent on it after was refining it, making it more functional, increasing the data collection capabilities, and so on. It was coming back to this in the new year I suddenly realised that, unless I want to become an expert in using PRAW, I wasn’t gaining anything from this. So the graph section used my first code iteration’s data, purely to showcase what can be done.
You talk about Comments JSON, but then don’t use it?
See the above explanation.
Why do you put everything in a JSON file when the Graph Database uses a CSV?
For some reason, I assumed TigerGraph could happily use JSON. This is not true for the developer edition, which demands CSV. Rather than go back and rewrite how I was recording the data, I decided to simply convert my JSON to a CSV.
6 and a half minutes for one user? Why not access their profile directly?
It’s true that we could scrape a single user’s profile very quickly and easily; we simply send one API request for their username and pull back all their comments and submissions. However, from each one of those, we then want all the people who commented on the content or were responsible for the original post. Because of this, we then have to run another API request for each individual comment and submission to get back the detail we need; the original request doesn’t contain it. If, somehow, we knew all the users we would need to scrape, we could simply run their profiles alone and save hundreds (or thousands) of API requests… Alas, the entire point of the scraping code is to find where people are connected, so we can’t make much progress in this space without the many API requests. Of course, if you happened to work for Reddit, this wouldn’t be an issue…
If everyone is anonymous, why have you blurred everything?
On Reddit, everyone gets to hide behind a username. But if you choose to put up certain details, it can be trivial to find out the real person behind it. Some people want this (celebrities, for instance). In this scenario, I’m picking on one particular person and their Reddit usage, talking quite poorly about their music, and using them to highlight a bad practice done in a poor way. They also link directly to their own Soundcloud. If, perchance, you work for Reddit and are interested in the specifics, you’re welcome to message my API account directly, u/fk4kg3nf399. I’d also pop a comment below to let me know you’ve done this, as I don’t really log into it.


