Skip to content
START FOR FREE
START FOR FREE
  • SUPPORT
  • COMMUNITY
  • CONTACT US
  • SUPPORT
  • COMMUNITY
  • CONTACT US
MENUMENU
  • Products
    • The World’s Fastest and Most Scalable Graph Platform

      LEARN MORE

      Watch a TigerGraph Demo

      TIGERGRAPH CLOUD

      • Overview
      • TigerGraph Cloud Suite
      • FAQ
      • Pricing

      USER TOOLS

      • GraphStudio
      • Insights
      • Application Workbenches
      • Connectors and Drivers
      • Starter Kits
      • openCypher Support

      TIGERGRAPH DB

      • Overview
      • GSQL Query Language
      • Compare Editions

      GRAPH DATA SCIENCE

      • Graph Data Science Library
      • Machine Learning Workbench

      Success Plans

  • Solutions
    • The World’s Fastest and Most Scalable Graph Platform

      LEARN MORE

      Watch a TigerGraph Demo

      Solutions

      • Solutions Overview

      INCREASE REVENUE

      • Customer Journey/360
      • Product Marketing
      • Entity Resolution
      • Recommendation Engine

      MANAGE RISK

      • Fraud Detection
      • Anti-Money Laundering
      • Threat Detection
      • Risk Monitoring

      IMPROVE OPERATIONS

      • Supply Chain Analysis
      • Energy Management
      • Network Optimization

      By Industry

      • Advertising, Media & Entertainment
      • Financial Services
      • Healthcare & Life Sciences

      FOUNDATIONAL

      • AI & Machine Learning
      • Time Series Analysis
      • Geospatial Analysis
  • Customers
    • The World’s Fastest and Most Scalable Graph Platform

      LEARN MORE

      CUSTOMER SUCCESS STORIES

      • Ford
      • Intuit
      • JPMorgan Chase
      • READ MORE SUCCESS STORIES
      • Jaguar Land Rover
      • Xbox
  • Partners
    • The World’s Fastest and Most Scalable Graph Platform

      LEARN MORE

      PARTNER PROGRAM

      • Partner Benefits
      • TigerGraph Partners
      • Sign Up
      TigerGraph partners with organizations that offer complementary technology solutions and services.​
  • Resources
    • The World’s Fastest and Most Scalable Graph Platform

      LEARN MORE

      BLOG

      • TigerGraph Blog

      RESOURCES

      • Resource Library
      • Benchmarks
      • Demos
      • O'Reilly Graph + ML Book

      EVENTS & WEBINARS

      • Events &Trade Shows
      • Webinars

      DEVELOPERS

      • Documentation
      • Ecosystem
      • Developers Hub
      • Community Forum

      SUPPORT

      • Contact Support
      • Production Guidelines

      EDUCATION

      • Training & Certifications
  • Company
    • Join the World’s Fastest and Most Scalable Graph Platform

      WE ARE HIRING

      COMPANY

      • Company Overview
      • Leadership
      • Legal Terms
      • Patents
      • Security and Compliance

      CAREERS

      • Join Us
      • Open Positions

      AWARDS

      • Awards and Recognition
      • Leader in Forrester Wave
      • Gartner Research

      PRESS RELEASE

      • Read All Press Releases
      TigerGraph Debuts TigerGraph CoPilot for Graph-Augmented AI, New Cloud-Native Generation of TigerGraph Cloud, and Solution Kits
      April 30, 2024
      Read More »

      NEWS

      • Read All News

      Best paper award at International Conference on Very Large Data Bases

      New TigerGraph CEO Refocuses Efforts on Enterprise Customers

  • START FREE
    • The World’s Fastest and Most Scalable Graph Platform

      GET STARTED

      • Request a Demo
      • CONTACT US
      • Try TigerGraph
      • START FREE
      • TRY AN ONLINE DEMO

Anti-Money Laundering (AML) Non-Compliance is Injurious to Your Business’ Health

  • Todd Blaschka
  • June 27, 2018
  • blog, Fraud / Anti-Money Laundering
  • Blog >
  • Anti-Money Laundering (AML) Non-Compliance is Injurious to Your Business’ Health

On June 3 2018, the Commonwealth Bank of Australia was fined $700 million for AML non-compliance. Some of the problem areas at the bank included:

    • Failure to properly monitor transactions for money-laundering red flags on 778,370 accounts for three years. This failure was likely due to the flood of AML alerts generated every week and insufficient resources to address them due to the high number of false positives (alerts that flagged but aren’t related to AML activity), estimated to be as high as 95% for leading banks.
    • 149 Suspicious Activity Reports (SARs) were filed late, or not filed at all. Finding false negatives or hard-to-find AML alerts buried deep inside intricate network of accounts and identities is time consuming and often leads to late filing or worse no filing at all.

Commonwealth bank of Australia isn’t alone – U.S. Bancorp was fined $613 million in February 2018 by U.S. authorities for lax anti-money laundering controls.

There are three fundamental issues with AML monitoring process that are the root cause for non-compliance:

    1.  High number of false positives in AML alerts – As much as 95% of AML alerts raised are ruled in the end as being unrelated to money laundering.
    2.  Hard to find or false negatives in AML alerts – Money launderers become more sophisticated every year, creating an intricate network of identities and accounts to funnel their ill-gotten gains. This makes it particularly hard and time consuming to find the false negatives buried deep inside the mountain of legitimate transactions.
    3.  Manual time-consuming process of case investigation – The alerts that are ruled as high risk turn into cases that are investigated by AML analyst. It can take anywhere from 20 minutes to several hours to investigate and resolve complex alerts, turning those into Suspicious Activity Report (SAR) or closing the cases where investigator deems the activity as unrelated to money laundering.

We will explore first two issues – false positives and false negatives in AML alerts in this blog and look at how graph analytics can help address those to improve AML compliance.

Reducing False Positives in AML Alerts with Graph

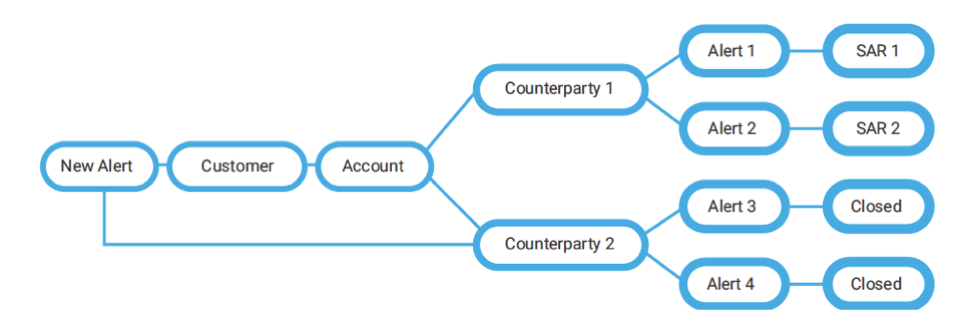
Figure 1 – Ruling out low risk alerts with graph (reducing false positives)

There is a new AML alert raised for a counterparty, Counterparty 2 that has had recent financial transactions with a customer account. Traditional approaches would suggest that this new alert is high risk, because the traditional metrics, such as high number of alerts generated and multiple SARs (Suspicious Activity Report) filed on the same customer account, all point to the likelihood of high AML risk. Nonetheless, through graph analysis, it turns out that of all the previous alerts, only those related to Counterparty 1 became SARs while those related to Counterparty 2 have all been closed.

Given that this new alert is related to Counterparty 2, it will likely be more similar with alerts 3 and 4, as opposed to alerts 1 and 2, and thus probably should be closed, or at least low risk. This demonstrates that graph analysis can identify and group “like” alerts where a conventional transaction monitoring system would miss the relationship.

Finding False Negatives in AML (alerts missed by other solutions) with Graph

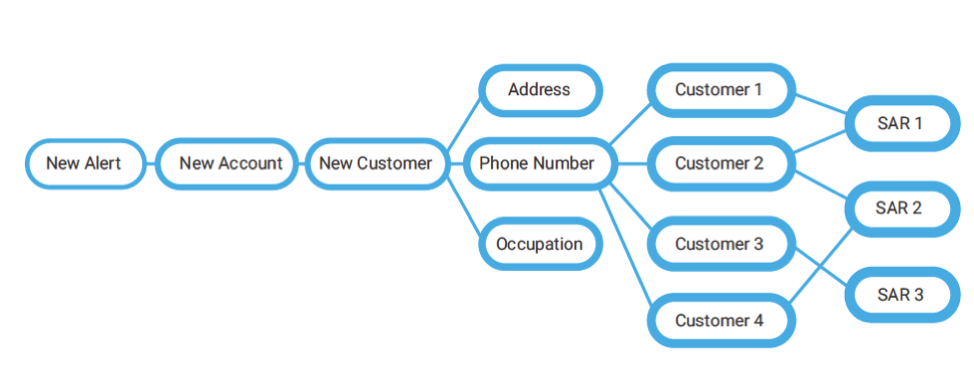
Figure 2 – Uncovering high risk alerts with graph (finding false negatives)

In the example above, this new alert would likely have been classified as a low-risk alert under a conventional scoring approach, because none of its attributes measured by the traditional scoring model displays any AML risk. However, the conventional approach fails to consider the cluster of high-risk customers that this alert is associated with. This new alert is connected to a new customer, who shares the same phone number with four other high-risk existing customers, on whom multiple SARs have been filed previously. Such a hidden linkage through a phone number would have been quite difficult to uncover using human review or existing models and systems. Thanks to graph, this hidden linkage is revealed, and this new alert would be elevated to a high-risk alert.

Improving accuracy for machine learning for AML with graph-based features

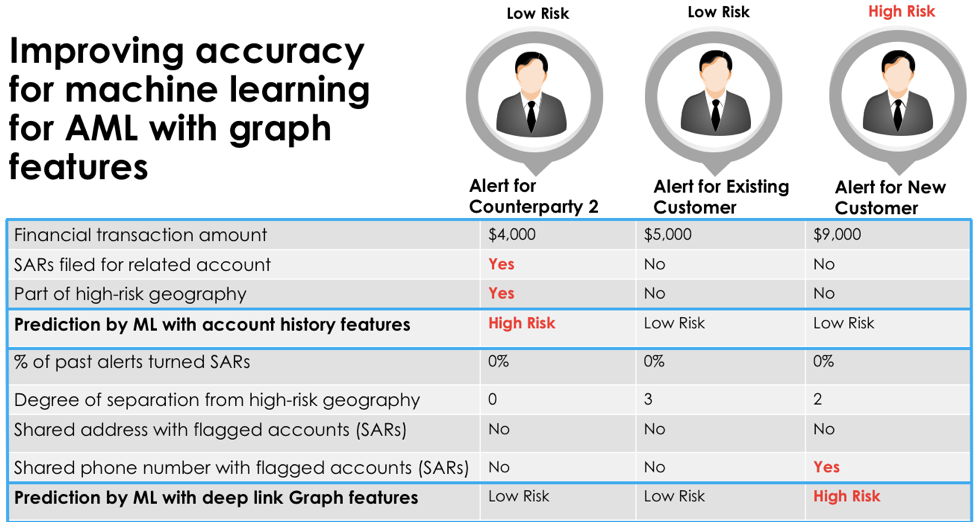
Consider three alerts raised in the example above – we will consider how the alerts were rated based on traditional features based on account history and how they are classified based on graph-based features.

Training data for machine learning includes features such as financial transaction amount, SARs filed for related account and if the particular account is part of a high-risk geography. Based on these features, an alert is raised for Counterparty 2 as Counterparty 2 has received funds from a customer account that is also doing business with Counterparty 1 and there are SARs filed for Counterparty 1 based on past transaction history. Counterparty 2 is also in a high-risk geography.  After reviewing features generated by graph database, alert for the Counterparty 2 is reduced to low risk – all alerts in the past for this account have been closed and none have tuned into SARs. Even though the account is in high risk geography, it does not share phone, address or any other information with a high-risk account with SARs. Graph based features have essentially ruled out a false positive in the AML alert for Counterparty 2.

Let’s consider the alert for the new customer, who is not located in high risk geography, does not have any alerts or SARs as they do not yet have a history with the financial institution. Traditional AML solution will not flag an alert for the new customer.  However, graph-based features dig deeper and find that the new account shares a phone number with several customers with SARs: graph-based solution creates a new AML alert that was missed by traditional AML solution and marks it as high risk for further monitoring and investigation. Graph based solution finds the false negatives i.e. AML alerts missed by traditional solutions.

Implementing graph analytics to improve AML compliance for your organization

We have explored all three issues – false positives, false negatives and case investigation efficiency in great level of detail in the new Anti-Money Laundering (AML) executive brief, authored by the banking industry expert, Robert Liu (CEO, Nanling Global, Principal at Promontory Financial Group). Robert has also laid out a prescriptive three pronged approach to adopting graph analytics in your financial institution in a measured manner to improve AML process efficiency, reduce costs and minimize the risk of non-compliance.

If you are interested in learning more here are some helpful links:

Download the AML Executive Brief here.

Register for the Risk.net On Demand Webinar with Robert Liu, Lester Joseph (Manager, Global Financial Crimes Intelligence Group, Wells Fargo) and Christopher Ruzich (Senior Manager, Financial Crime Compliance, Standard Chartered Bank) to learn and create your own roadmap for improved AML compliance in your organization.

You Might Also Like

Graph Developer Proficiency Rating

Graph Developer Proficiency Rating

June 16, 2024
Supply Chain Digital Twins Enable Analytics and Resiliency

Supply Chain Digital Twins Enable Analytics...

May 29, 2024
Putting the Customer First: The Power of the Empty Chair

Putting the Customer First: The Power...

May 17, 2024

Todd Blaschka

TigerGraph Blog

  • Categories
    • blogs
      • Customer 360
      • Cybersecurity
      • Developers
      • Digital Twin
      • Engineers
      • Fraud / Anti-Money Laundering
      • GQL
      • GSQL
      • Supply Chain
      • TigerGraph
      • TigerGraph Cloud
    • Graph AI On Demand
      • Customer Spotlight
      • Digital Transformation, Management, & Strategy
      • Finance, Banking, Insurance
      • Graph + AI
      • Graph Algorithms
      • Retail, Manufacturing, and Supply Chain
    • RulesEngine
    • Video
  • Recent Posts

    • Graph Developer Proficiency Rating
    • Supply Chain Digital Twins Enable Analytics and Resiliency
    • Welcome to ENGAGE 2024!
    • Putting the Customer First: The Power of the Empty Chair
    • Join TigerGraph at ENGAGE 2024: Advancing Financial Crime Solutions
    TigerGraph

    Product

    SOLUTIONS

    customers

    RESOURCES

    start for free

    TIGERGRAPH DB
    • Overview
    • Features
    • GSQL Query Language
    GRAPH DATA SCIENCE
    • Graph Data Science Library
    • Machine Learning Workbench
    TIGERGRAPH CLOUD
    • Overview
    • Cloud Starter Kits
    • Login
    • FAQ
    • Pricing
    • Cloud Marketplaces
    USEr TOOLS
    • GraphStudio
    • TigerGraph Insights
    • Application Workbenches
    • Connectors and Drivers
    • Starter Kits
    • openCypher Support
    SOLUTIONS
    • Why Graph?
    industry
    • Advertising, Media & Entertainment
    • Financial Services
    • Healthcare & Life Sciences
    use cases
    • Benefits
    • Product & Service Marketing
    • Entity Resolution
    • Customer 360/MDM
    • Recommendation Engine
    • Anti-Money Laundering
    • Cybersecurity Threat Detection
    • Fraud Detection
    • Risk Assessment & Monitoring
    • Energy Management
    • Network & IT Management
    • Supply Chain Analysis
    • AI & Machine Learning
    • Geospatial Analysis
    • Time Series Analysis
    success stories
    • Customer Success Stories

    Partners

    Partner program
    • Partner Benefits
    • TigerGraph Partners
    • Sign Up
    LIBRARY
    • Resources
    • Benchmark
    • Webinars
    Events
    • Trade Shows
    • Graph + AI Summit
    • Million Dollar Challenge
    EDUCATION
    • Training & Certifications
    Blog
    • TigerGraph Blog
    DEVELOPERS
    • Developers Hub
    • Community Forum
    • Documentation
    • Ecosystem

    COMPANY

    Company
    • Overview
    • Careers
    • News
    • Press Release
    • Awards
    • Legal Terms
    • Patents
    • Security and Compliance
    • Contact
    Get Started
    • Start Free
    • Compare Editions
    • Online Demo - Test Drive
    • Request a Demo

    Product

    • Overview
    • TigerGraph 3.0
    • TIGERGRAPH DB
    • TIGERGRAPH CLOUD
    • GRAPHSTUDIO
    • TRY NOW

    customers

    • success stories

    RESOURCES

    • LIBRARY
    • Events
    • EDUCATION
    • BLOG
    • DEVELOPERS

    SOLUTIONS

    • SOLUTIONS
    • use cases
    • industry

    Partners

    • partner program

    company

    • Overview
    • news
    • Press Release
    • Awards

    start for free

    • Request Demo
    • take a test drive
    • SUPPORT
    • COMMUNITY
    • CONTACT
    • Copyright © 2024 TigerGraph
    • Privacy Policy
    • Linkedin
    • Twitter

    Copyright © 2020 TigerGraph | Privacy Policy

    Copyright © 2020 TigerGraph Privacy Policy

    • SUPPORT
    • COMMUNITY
    • COMPANY
    • CONTACT
    • Linkedin
    • Facebook
    • Twitter

    Copyright © 2020 TigerGraph

    Privacy Policy

    • Products
    • Solutions
    • Customers
    • Partners
    • Resources
    • Company
    • START FREE
    START FOR FREE
    START FOR FREE
    TigerGraph
    PRODUCT
    PRODUCT
    • Overview
    • GraphStudio UI
    • Graph Data Science Library
    TIGERGRAPH DB
    • Overview
    • Features
    • GSQL Query Language
    TIGERGRAPH CLOUD
    • Overview
    • Cloud Starter Kits
    TRY TIGERGRAPH
    • Get Started for Free
    • Compare Editions
    SOLUTIONS
    SOLUTIONS
    • Why Graph?
    use cases
    • Benefits
    • Product & Service Marketing
    • Entity Resolution
    • Customer Journey/360
    • Recommendation Engine
    • Anti-Money Laundering (AML)
    • Cybersecurity Threat Detection
    • Fraud Detection
    • Risk Assessment & Monitoring
    • Energy Management
    • Network Resources Optimization
    • Supply Chain Analysis
    • AI & Machine Learning
    • Geospatial Analysis
    • Time Series Analysis
    industry
    • Advertising, Media & Entertainment
    • Financial Services
    • Healthcare & Life Sciences
    CUSTOMERS
    read all success stories


    PARTNERS
    Partner program
    • Partner Benefits
    • TigerGraph Partners
    • Sign Up
    RESOURCES
    LIBRARY
    • Resource Library
    • Benchmark
    • Webinars
    Events
    • Trade Shows
    • Graph + AI Summit
    • Graph for All - Million Dollar Challenge
    EDUCATION
    • TigerGraph Academy
    • Certification
    Blog
    • TigerGraph Blog
    DEVELOPERS
    • Developers Hub
    • Community Forum
    • Documentation
    • Ecosystem
    COMPANY
    COMPANY
    • Overview
    • Leadership
    • Careers  
    NEWS
    PRESS RELEASE
    AWARDS
    START FREE
    Start Free
    • Request a Demo
    • SUPPORT
    • COMMUNITY
    • CONTACT
    Dr. Jay Yu

    Dr. Jay Yu | VP of Product and Innovation

    Dr. Jay Yu is the VP of Product and Innovation at TigerGraph, responsible for driving product strategy and roadmap, as well as fostering innovation in graph database engine and graph solutions. He is a proven hands-on full-stack innovator, strategic thinker, leader, and evangelist for new technology and product, with 25+ years of industry experience ranging from highly scalable distributed database engine company (Teradata), B2B e-commerce services startup, to consumer-facing financial applications company (Intuit). He received his PhD from the University of Wisconsin - Madison, where he specialized in large scale parallel database systems

    Todd Blaschka | COO

    Todd Blaschka is a veteran in the enterprise software industry. He is passionate about creating entirely new segments in data, analytics and AI, with the distinction of establishing graph analytics as a Gartner Top 10 Data & Analytics trend two years in a row. By fervently focusing on critical industry and customer challenges, the companies under Todd's leadership have delivered significant quantifiable results to the largest brands in the world through channel and solution sales approach. Prior to TigerGraph, Todd led go to market and customer experience functions at Clustrix (acquired by MariaDB), Dataguise and IBM.