


The economic impact of a power outage is massive. Energy consultant E Source claims that eight key U.S. market segments are losing about $27 billion per year due to power outages. Now more than ever, power grid operators need faster energy management systems (EMS) to balance and even out the spikes in demand or drops in supply to minimize the impact of outages. The vast majority of grid monitoring systems are decades old with extremely limited visibility. This results in increased operational risks, higher costs, and outages.
Traditionally power systems are modeled using relational databases which are not very accommodating of data interconnections. To represent interconnection, the linking attributes of records in the relational database are stored in different tables for creating the relations, and the relationship between the different records is established by querying the same attribute of the corresponding records in different tables. Therefore, adding or deleting records in the RDBMS requires updating all tables with associated shared attributes commonly resulted in performance issues in query return time.
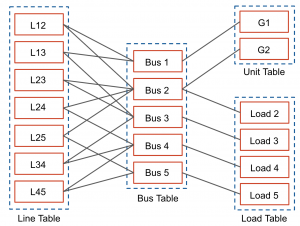
Fig 1. Power System Modeling by Relational Database Model
Why Graph for Energy Management Systems?
Unlike relational databases, graph databases model the power system using graph data structures for semantic queries with a set of nodes and edges. Unstructured attributes are stored in nodes and edges. The relationship between nodes and edges is self-defined in the graph. For online parallel computing of large-scale power systems, the Graph Database Management System is more in line with the requirements of power system computing for complex data modeling, querying, sorting, and traversal.
Fig 2. Power System Modeling by Graph Database Model
Combining graph with parallel is a breakthrough solution for speeding up EMS applications. Power system engineers have investigated different parallel computing approaches based on relational database structure to improve the EMS application computing efficiency, but until now have been unable to achieve sufficiently fast results. Parallel graph processing does just that.
Why TigerGraph for Energy Management Systems?
From meter readings to the constant flow of information from sensors and network components, utility companies are being flooded with the IoT (Internet of Things) sensor data. Working closely with the leading energy and utility companies, TigerGraph has pioneered Native Parallel Graph approaches that help power companies monitor and analyze power flows, detect bottlenecks, and alert personnel about grid performance issues. Balancing a power grid requires consolidating signals from multiple levels of the power infrastructure and matching demand and supply with complex linear equations, which is deep link analytics taken to the extreme. Using TigerGraph to process power grid IoT sensor data, operators can respond immediately to sudden spikes in demand or drops in supply, thus reducing operational risk and operating costs while improving reliability, efficiency, and customer experience.
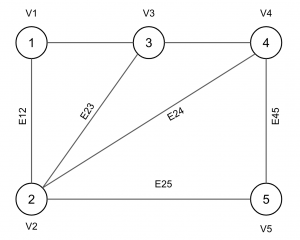
Fig 2. Power System Modeling by Graph Database Model
The standard approach for solving large-scale linear equations for power management requires bulky, time-intensive matrix operations. Modeling a power system as a graph (instead of a matrix) represents connections and topology more naturally. No data preparation is needed, cutting 25-35% of the generally required time for power flow calculation and state estimation. Bus ordering and admittance graph formation are performed with all graph nodes processing in parallel. Core calculations are all conducted on the graph, and solved values are stored as attributes of vertices and edges of the graph – rather than unknown variables in the vector or matrix. Using TigerGraph, solved values are stored as attributes of vertices and edges on a graph – forgoing the need for a mapping process. Output visualization takes about 70% of total time for power flow calculation, and 28% for state estimation when using the conventional approach. Using the TigerGraph native graph database and graph computing, that portion of the time is eliminated.
Using TigerGraph to create a real-time EMS
As power demands have increased, yesterday’s “real-time” systems are no longer able to make the network calculations and adjustments fast enough. The energy industry needs a faster-than-real-time Energy Management System. Such a system must be able to identify mismatches between power demand and supply, lower power consumption for non-critical parts of the grid, divert power to higher priority areas for industrial output and national security, and be able to accomplish all of this in a few seconds. The Global Energy Interconnection Research Institute North America (GEIRINA) is a collaboration platform for the State Grid of China, the largest electric utility company in the world. GEIRINA teamed up with TigerGraph to build a faster than real time energy management solution, a seemingly impossible task that has eluded power system engineers for the past decade. Learn more about how TigerGraph’s massively-parallel graph-based solution helped GEIRINA achieve the first viable faster-than-real-time EMS solution for commercial use.


