


TigerGraph Insights (Insights) is a no-code/low-code intuitive visual graph application building tool on top of the TigerGraph native parallel graph database that allows any user (technical or not) to easily and quickly obtain meaningful visual insights that would remain hidden without a deep graph-enabled analysis of their connected data.
To simplify the job of building a multi-page data-driven visual graph application with rich interactions, TigerGraph Insights provides a semi-human-language-based search that can automate database query writing, and instead, offers a point-and-click, drag-and-drop mechanism to construct visual graphs and traditional BI view widgets and link them together.
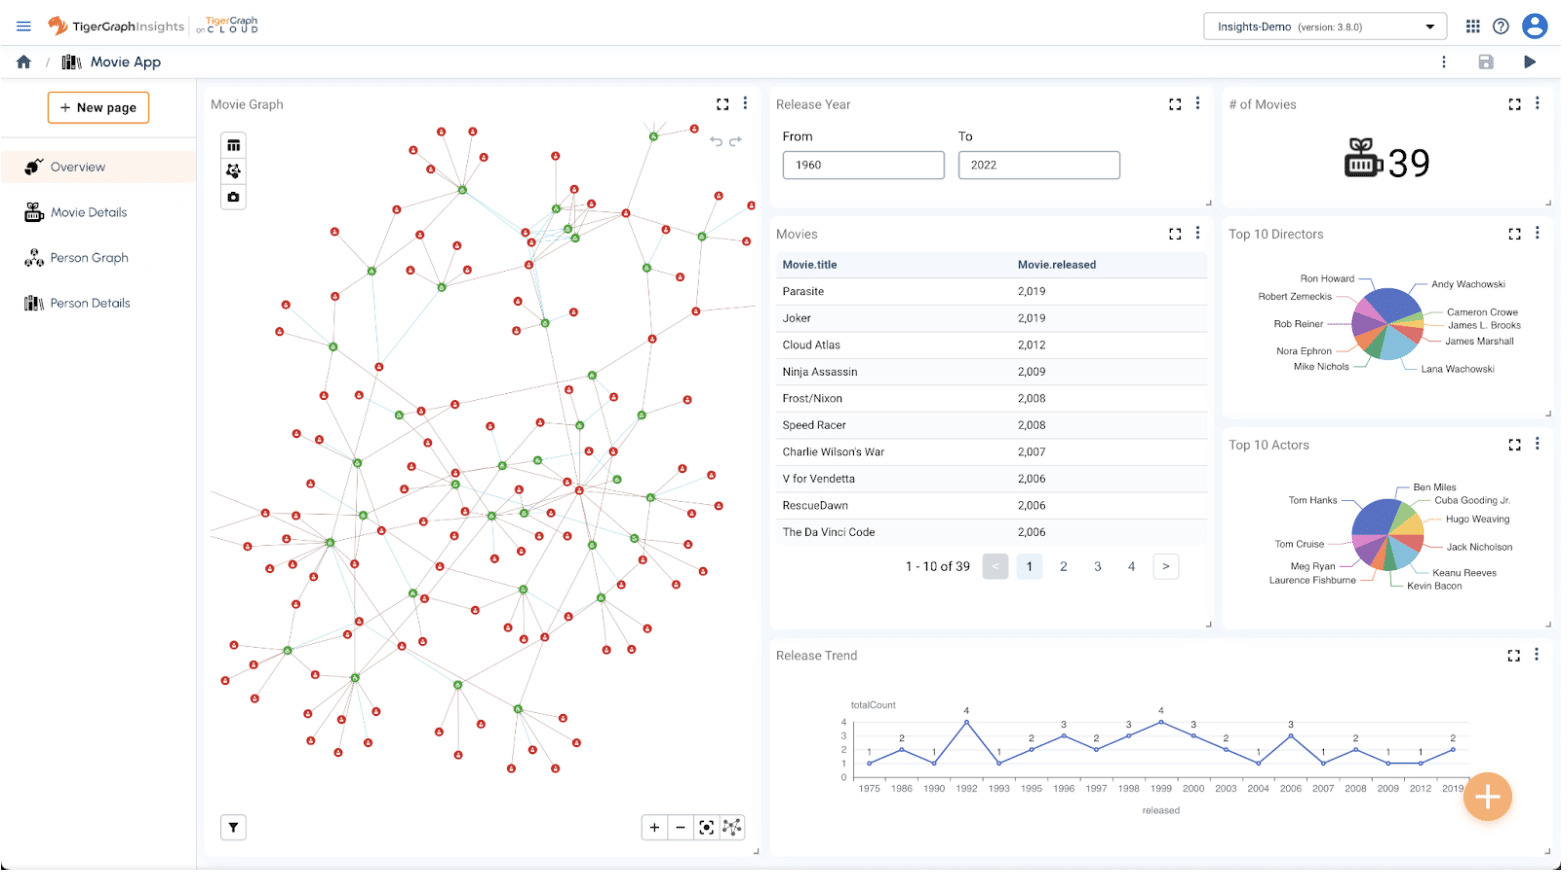
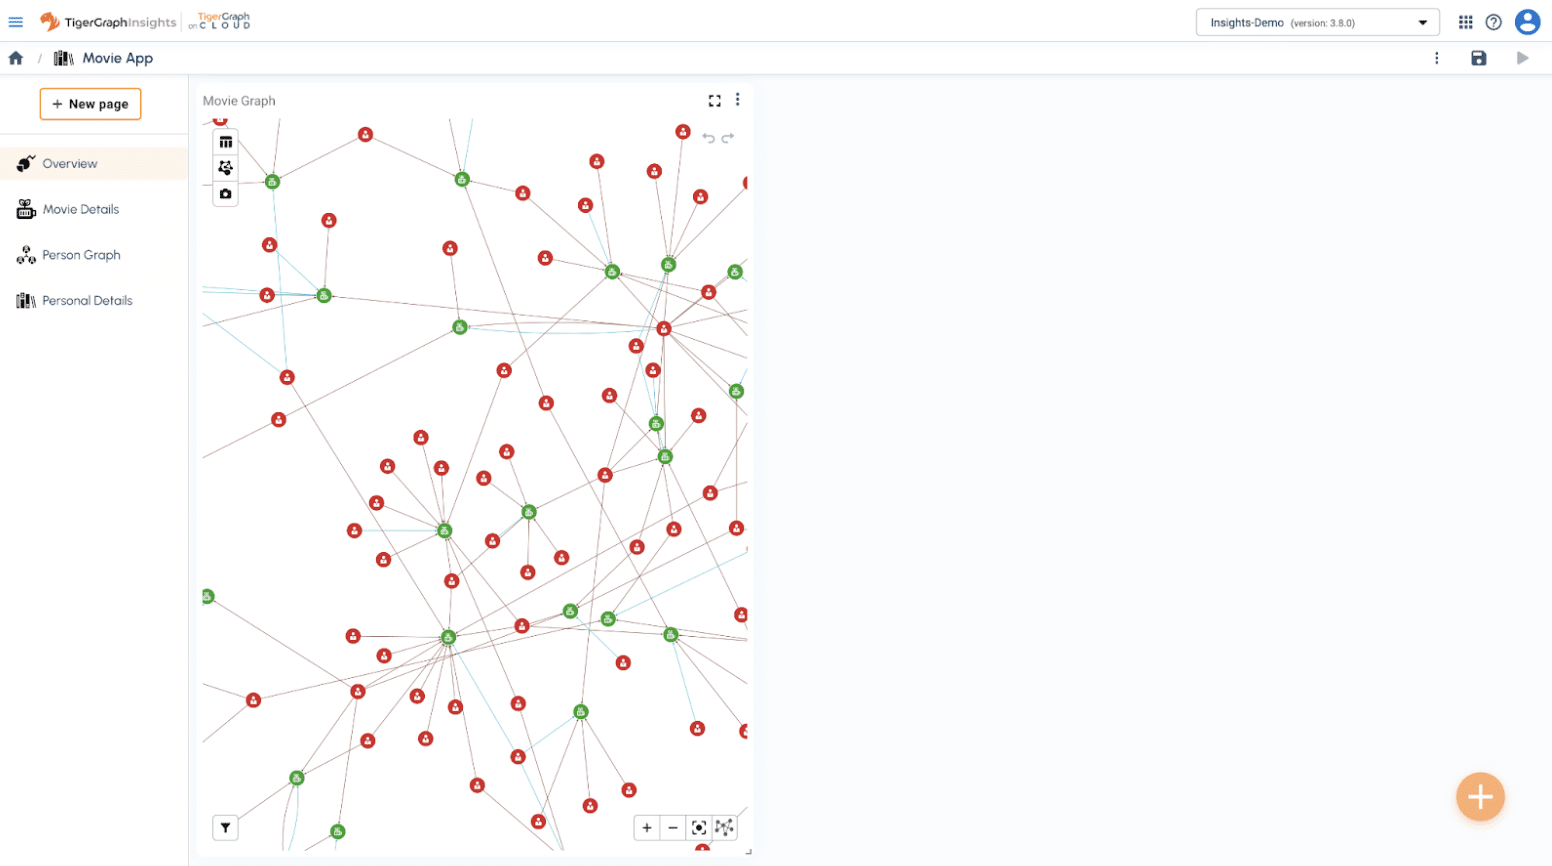
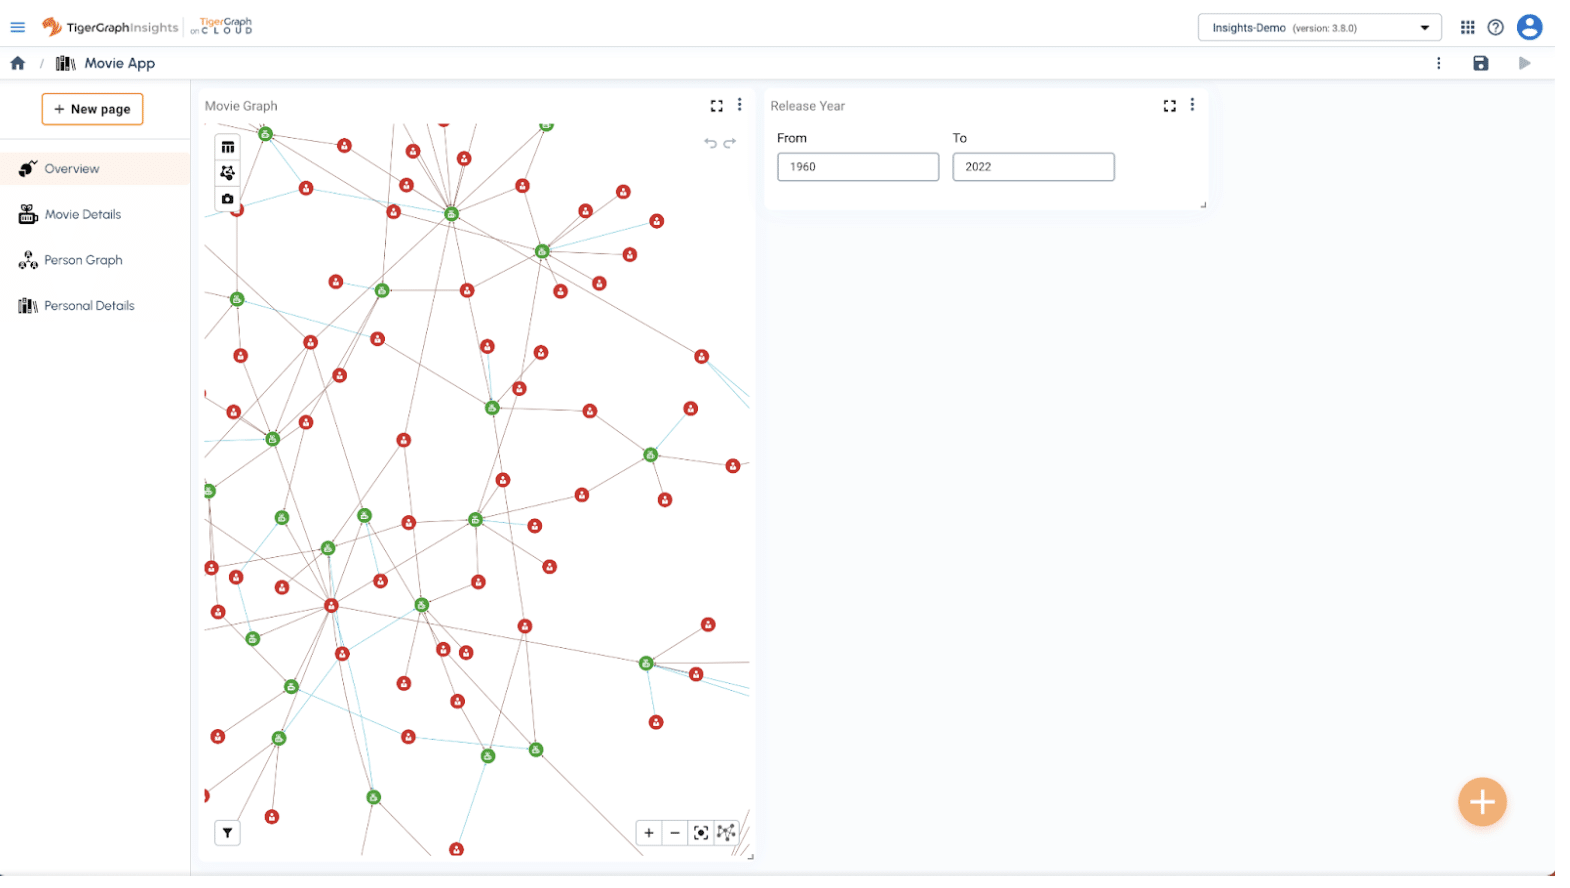
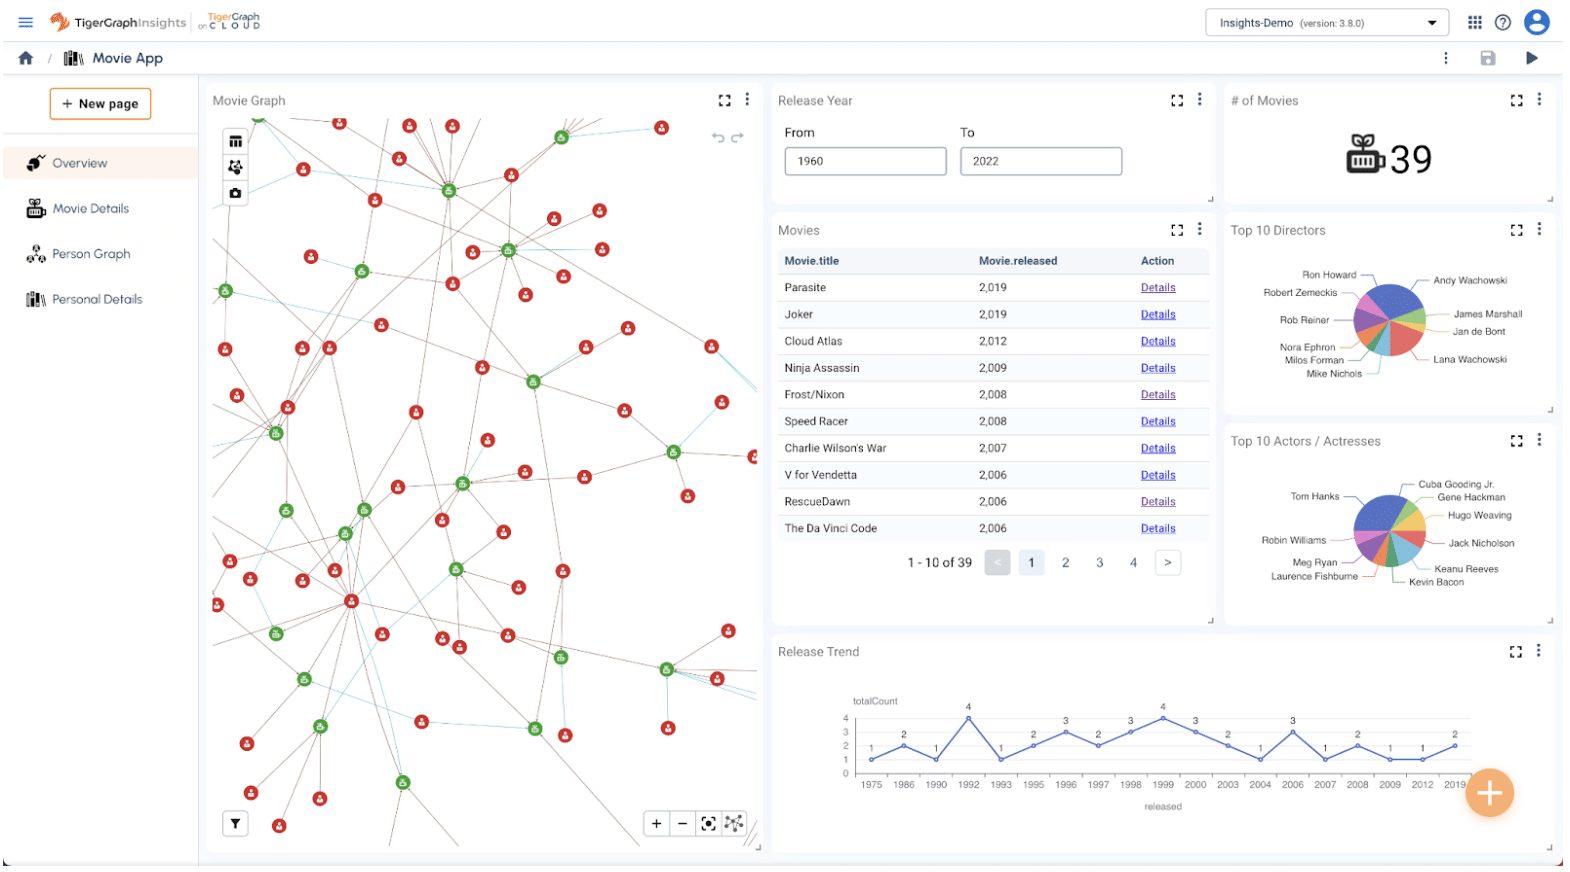
In this blog, I am going to show you how to build a feature-rich and interactive visual graph analytics application via Insights in less than 30 minutes. This visual graph application (see below), based on a sample Movies graph, allows users to explore many different dimensions of movies, people (actor, director, writer …), and their interconnectedness with built-in graph exploration, filtering, graph algorithms and dynamic interactions among different views (graph, table, charts).
Prerequisite: Create a Movies Graph in TigerGraph (Est. 10 min)
Before you start building your first Insights application, there are a few prerequisites you will need to complete.
Step 1: Sign up for a free TigerGraph Cloud account at https://tgcloud.io or log into an existing account there.
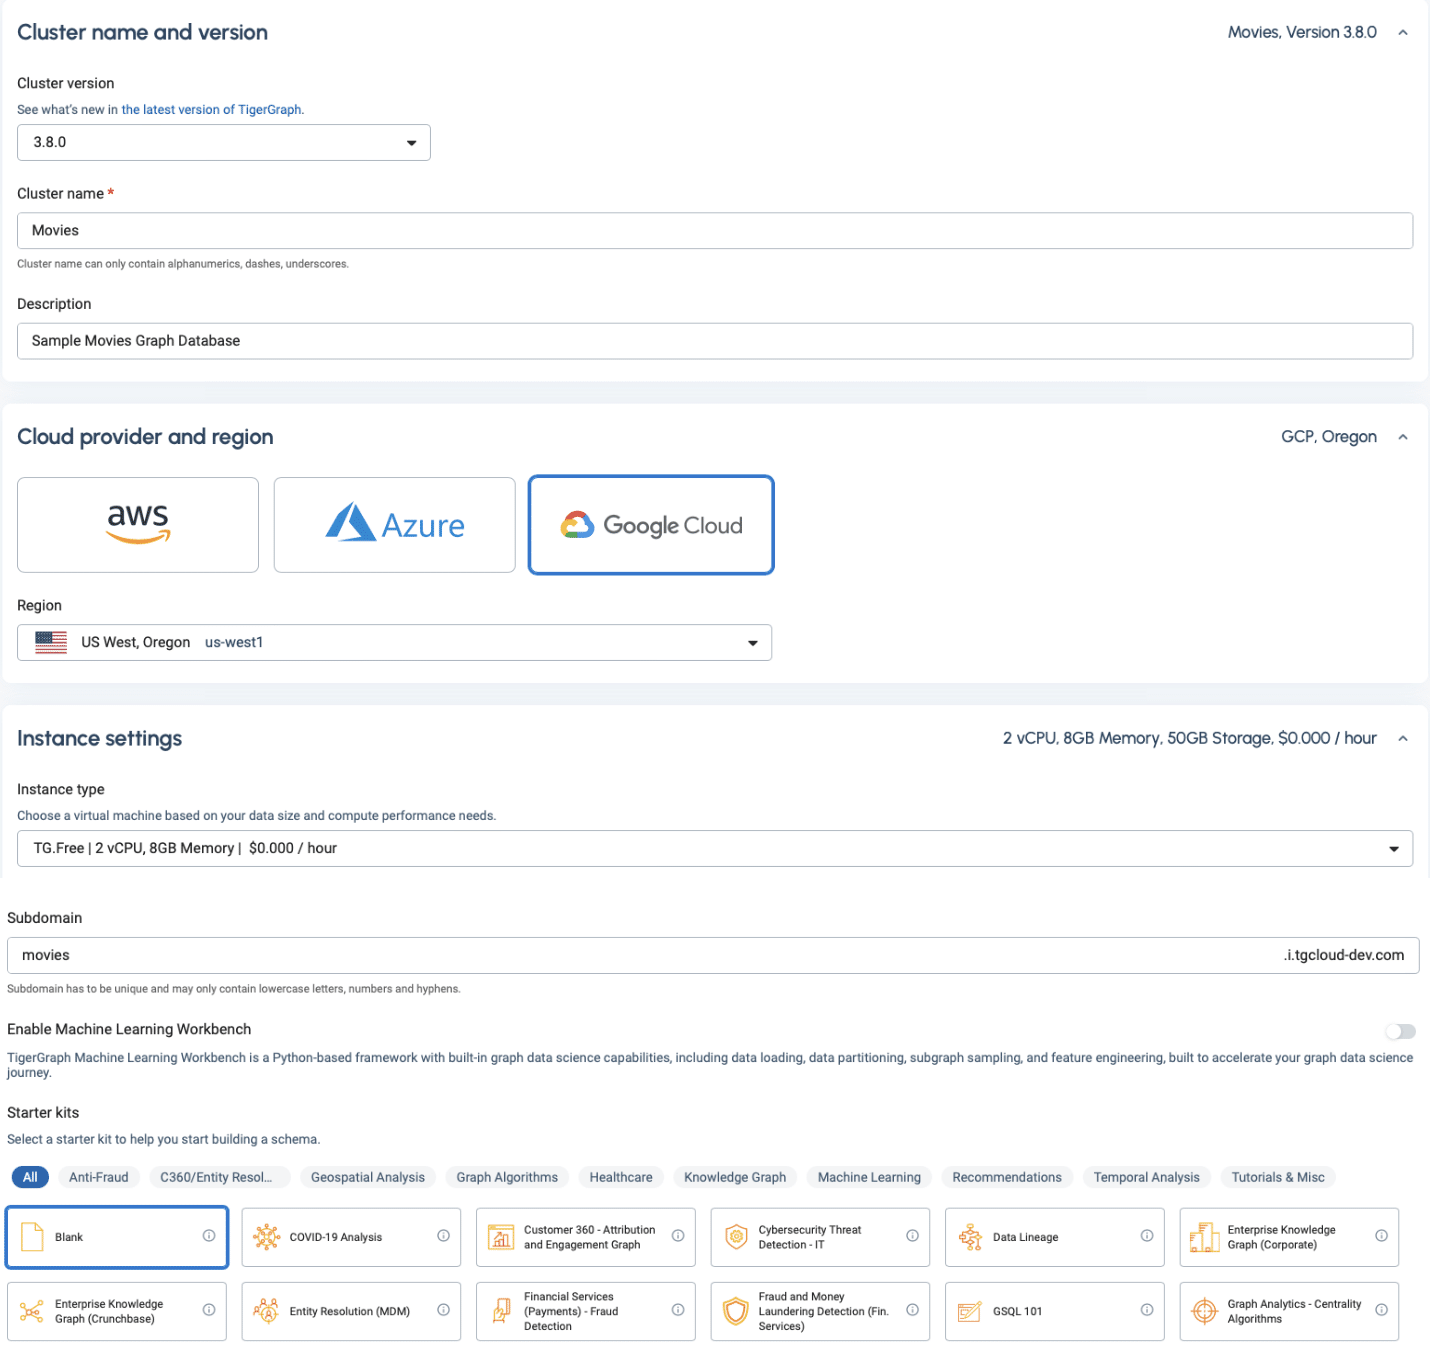
Step 2: Create a free DB cluster and select the blank starter kit.
Step 3: Launch GraphStudio development tool and import the sample Movie solution.
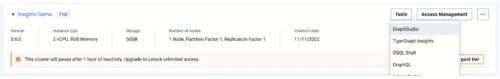
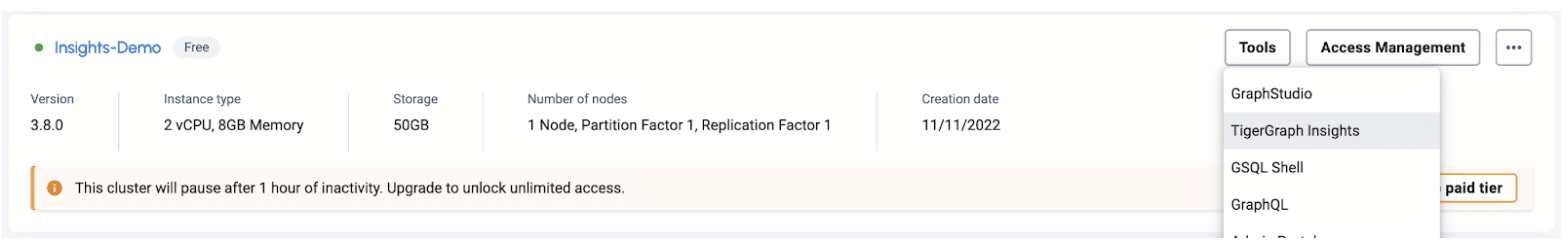
Select “GraphStudio” from the Tools menu.
Download the sample Movies solution from here and put it on your local disk.
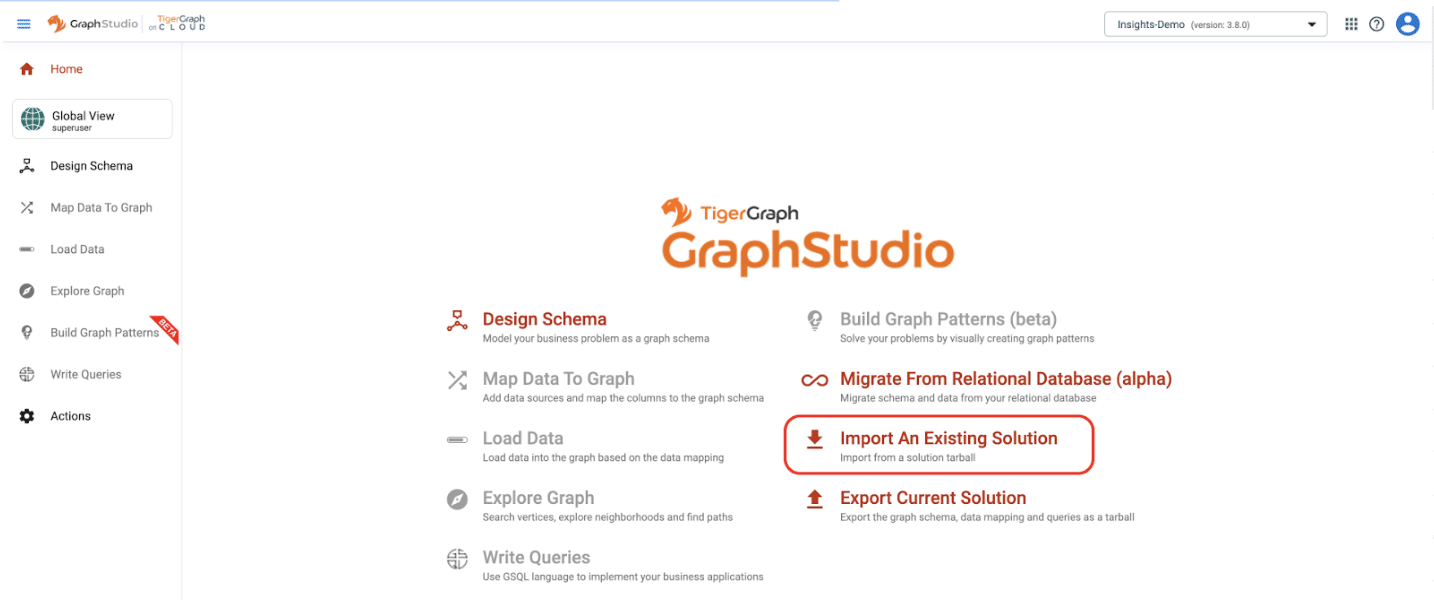
Select “Import An Existing Solution” in GraphStudio.
Select the local stored Movies solution from the above downloaded file location to import. It may take a few minutes to complete the import.
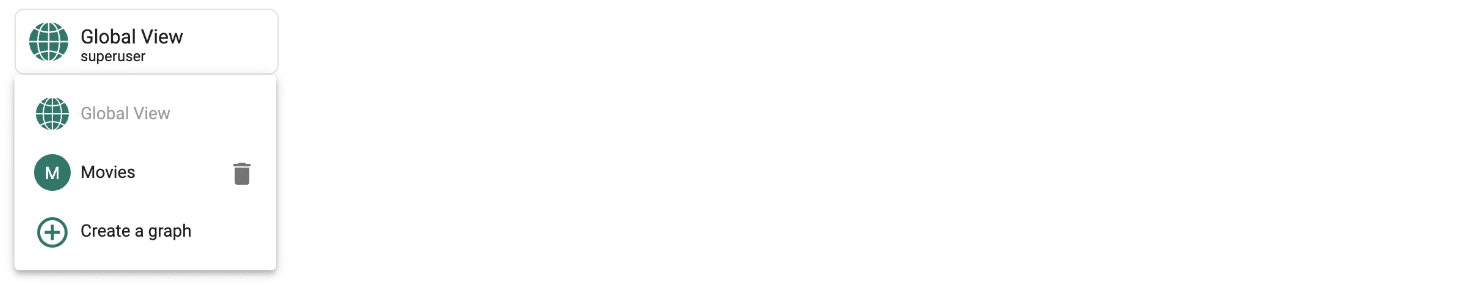
After the solution is imported, choose the imported graph “Movies” in the dropdown menu.
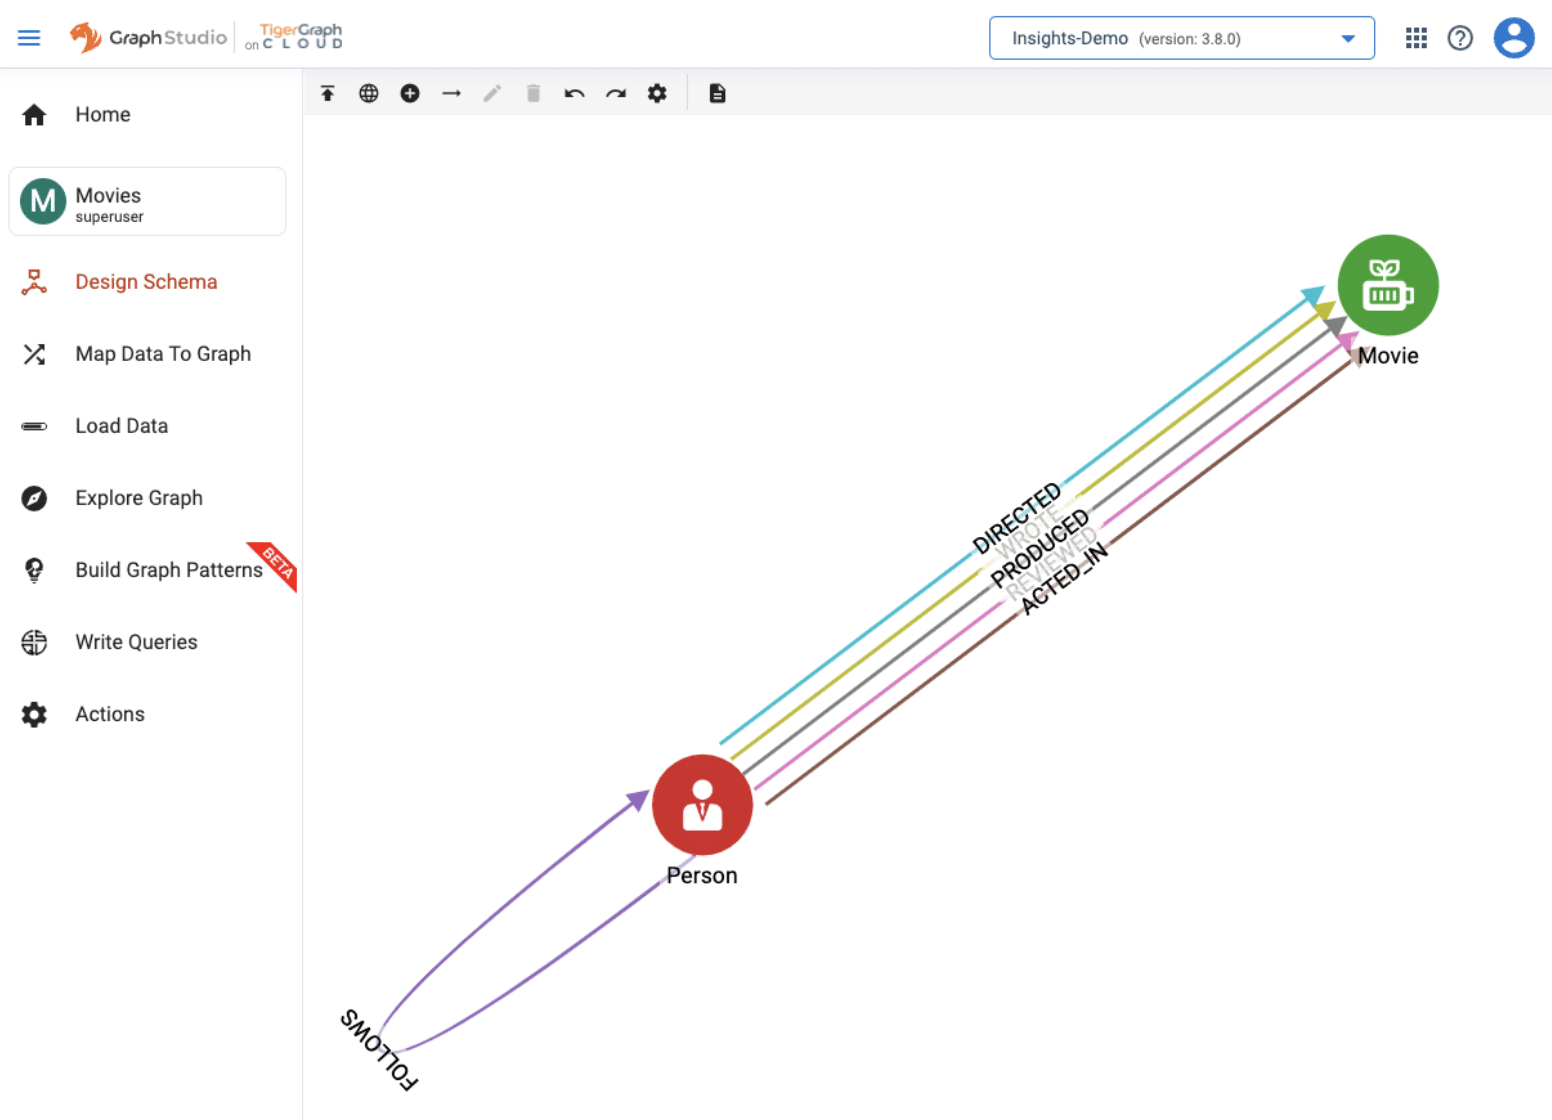
You can click on the “Design Schema” to review the imported Movies graph schema. You should see 2 vertice types(Person and Movie), 5 edge types connecting Person and Movie (act, direct, write, produce and review) and 1 edge type connecting Person to Person (follow).
Now you are ready to build your first Insights application. You can open Insights from the tools menu on your newly created cluster.
Create the Movies Application
Click on the New Application button to create your first Insights application. Insights allows you to create many applications if you want.

Then you need to choose an application name. In this case, we named it the Movie App. You can also add the application icon and select a default graph from the underlying TigerGraph database. Please note that you need at least one graph in order to create an Insights application.
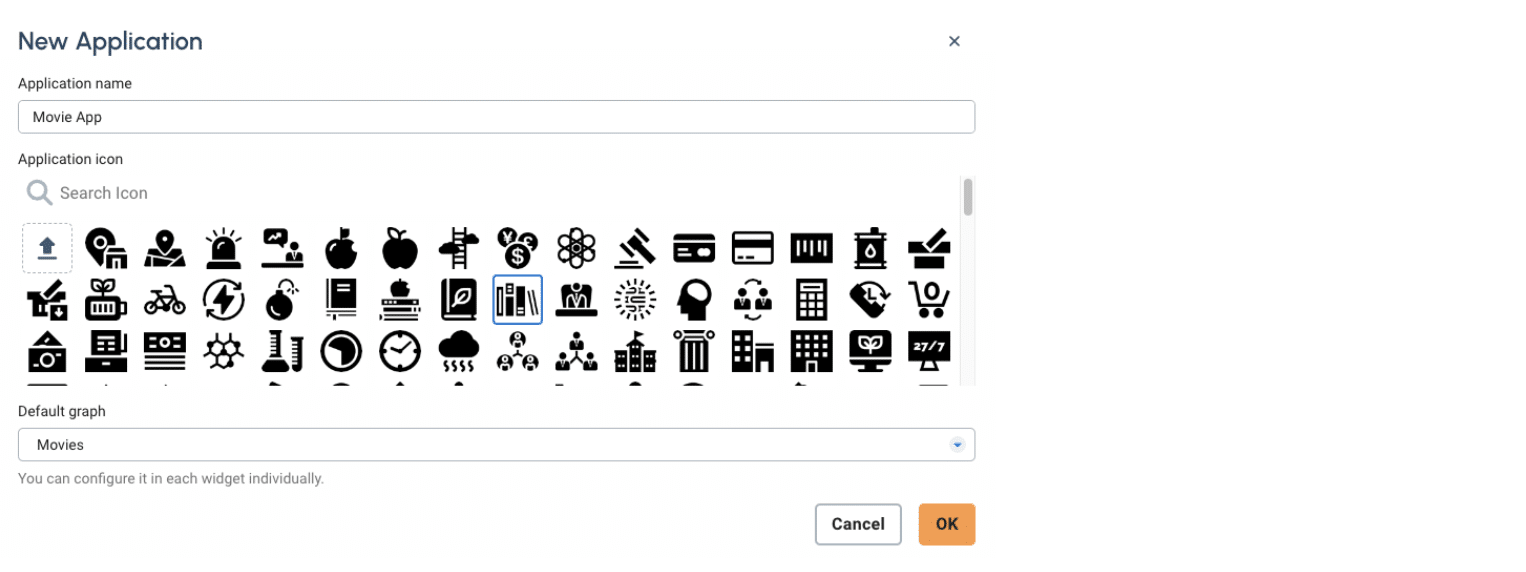
Click OK to save. After the application is created, you will be in the editor mode of the application dashboard.
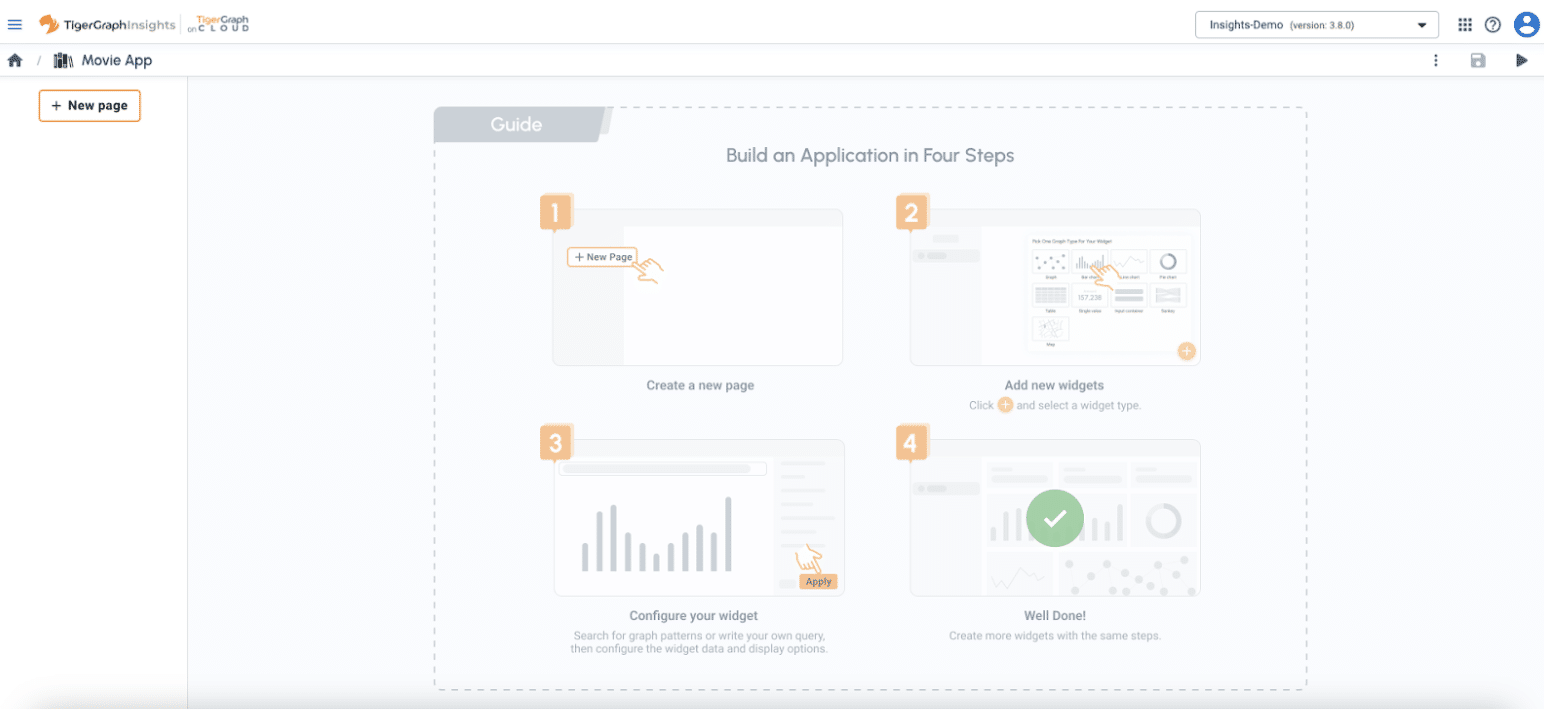
Create Pages
Insights supports multi-page applications. To start with, create your first page in the application by clicking on the New Page button on the left menu.
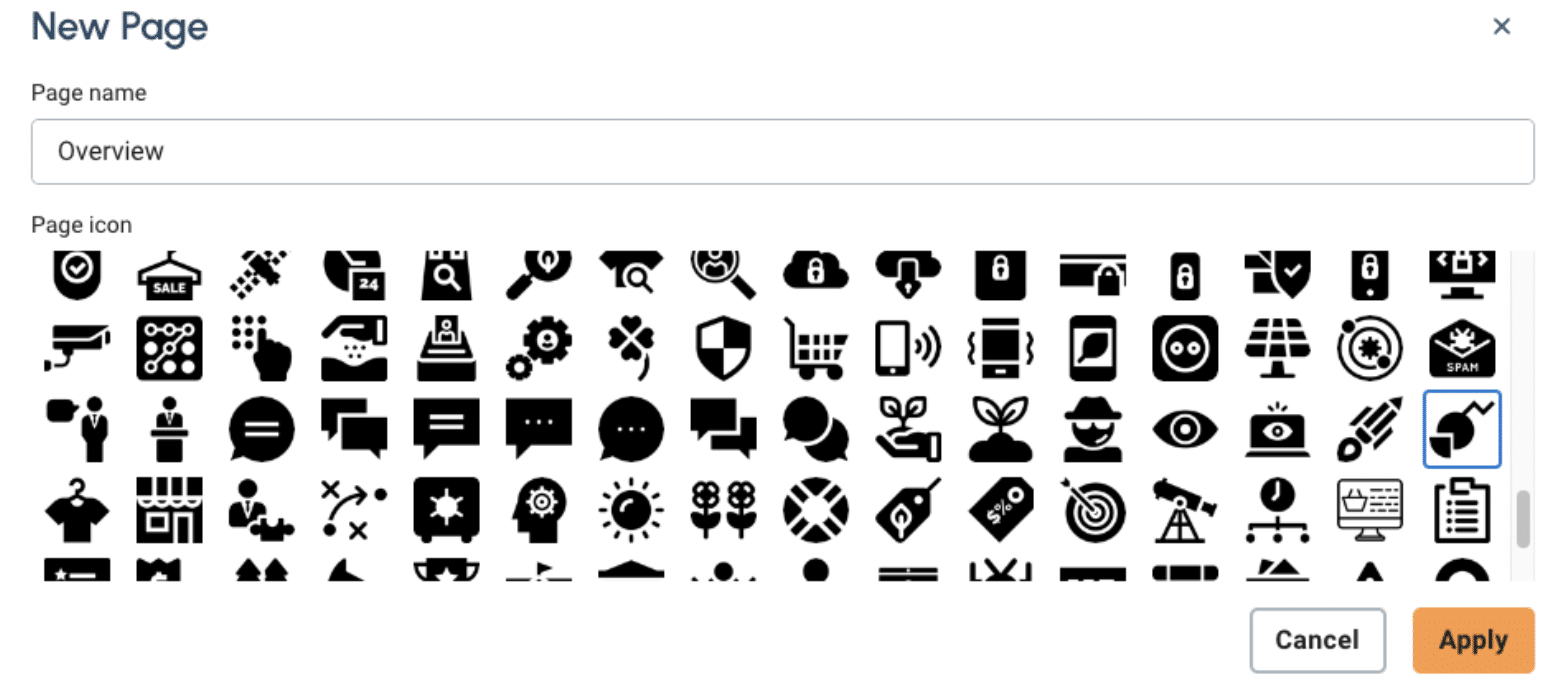 For this simple movie application, we will create 4 pages:
- Overview – general information on movies based on release year.
- Movie Details – detailed information on a specific movie.
- Person Graph – entire relationship map for all people in our database.
- Personal Details – detailed information for a specific person.
Each page can have multiple widgets. After all pages are created, you can click on the + button on the lower right corner of the screen to add a widget to your page.
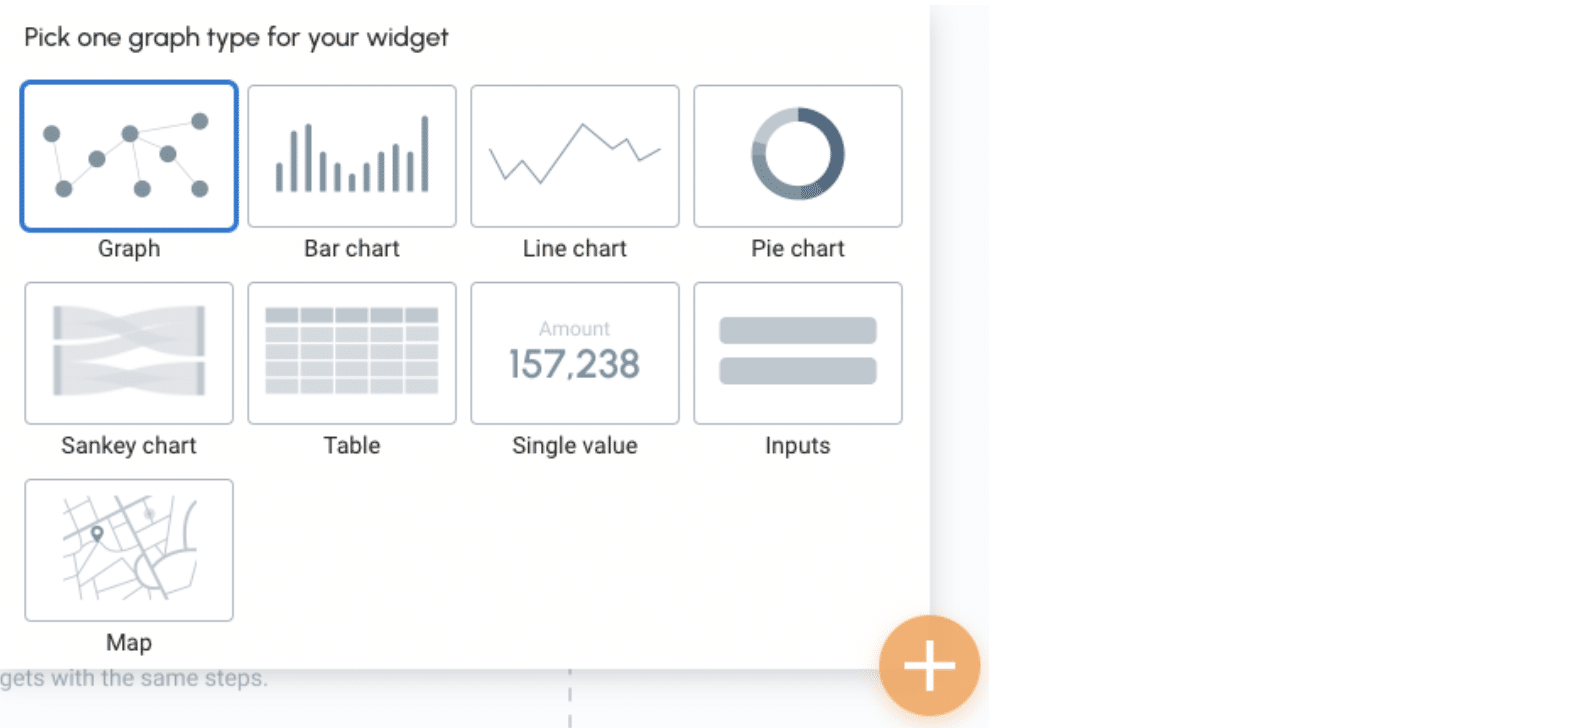
Create Graph Widget
Let’s navigate back to the Overview page in your application to add your first widget. Just select Graph from the add widget menu. You can always switch the widget type when you edit a widget.
There are three sections in the widget edit view. The top section is the Pattern Search/ Write GSQL Query panel. You can write human language like graph patterns or raw GSQL queries to retrieve data from the TigerGraph database. The section on the right is the settings panel that allows you to configure your widget. The main section in the middle of the screen is the results panel, which visualizes the query results in the way you have configured.
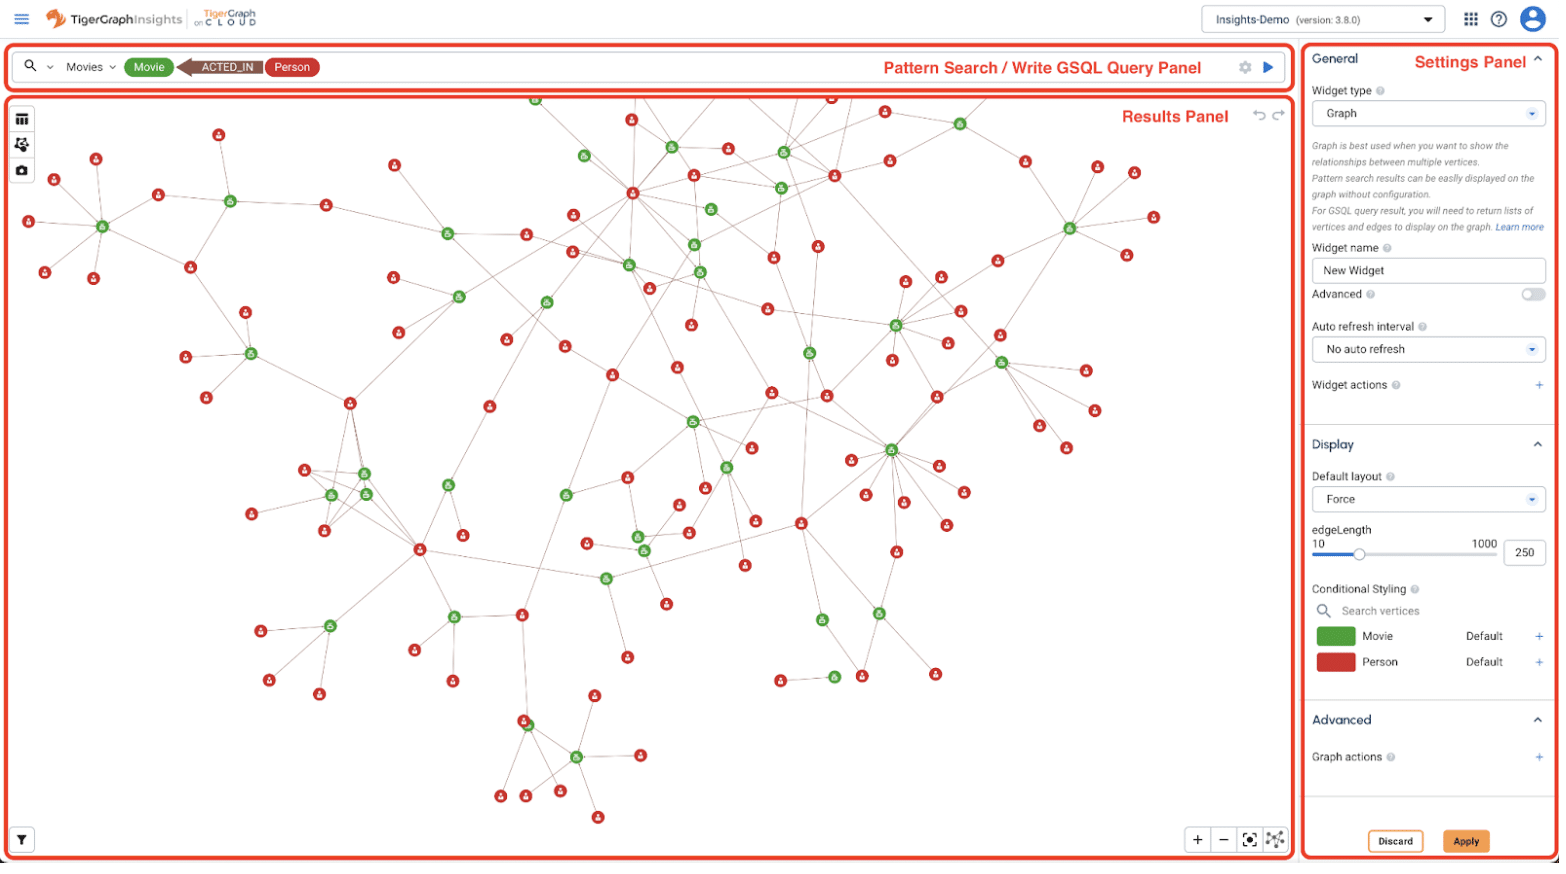
The pattern search supports auto completion feature, you can type your search pattern and choose a matching pattern from the dropdown.
You can also specify the order and limit by clicking the settings (cog) button on the right side of the pattern search box.
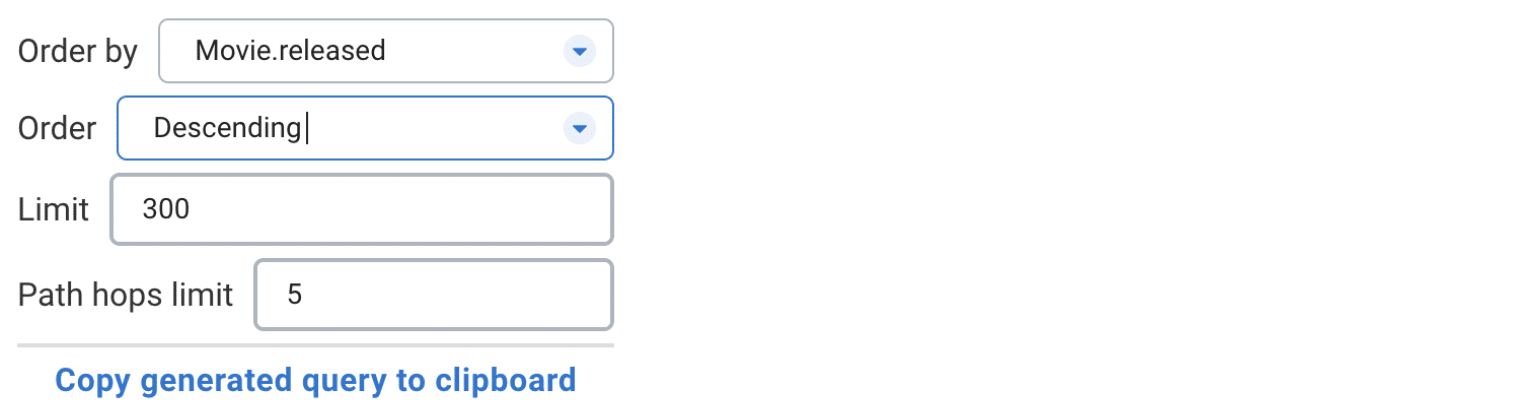
For advanced users, you can also copy the generated GSQL query from the graph pattern you specified, and customize it.
Select following graph pattern in the search bar

Click to play button to preview the graph data. Then click the Apply button on the lower right corner to apply the change.
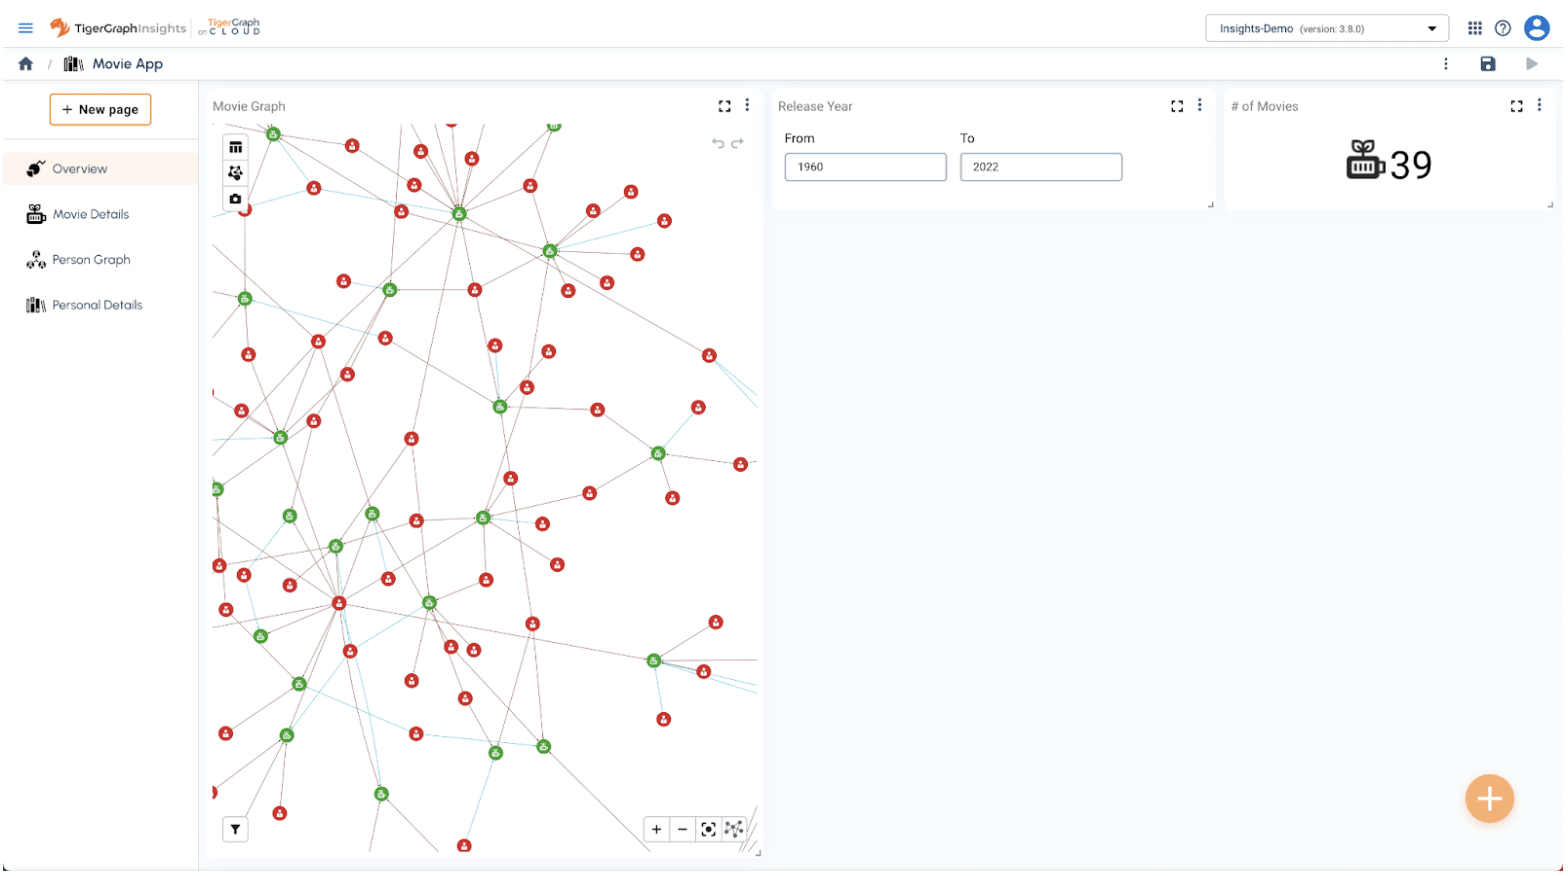
After the widget is created, you can also drag the title line to move the widget to your desired position. And you can also drag the resize button on the bottom right corner of each widget to resize the widget. Here is the look after resizing the first graph widget:
Create Inputs Widget
Insights allow users to specify variables for each page, those variables can be used in search pattern or GSQL query. Let’s create 2 variables called fromYear and to toYear. Both of them are used to filter movies based on release dates.
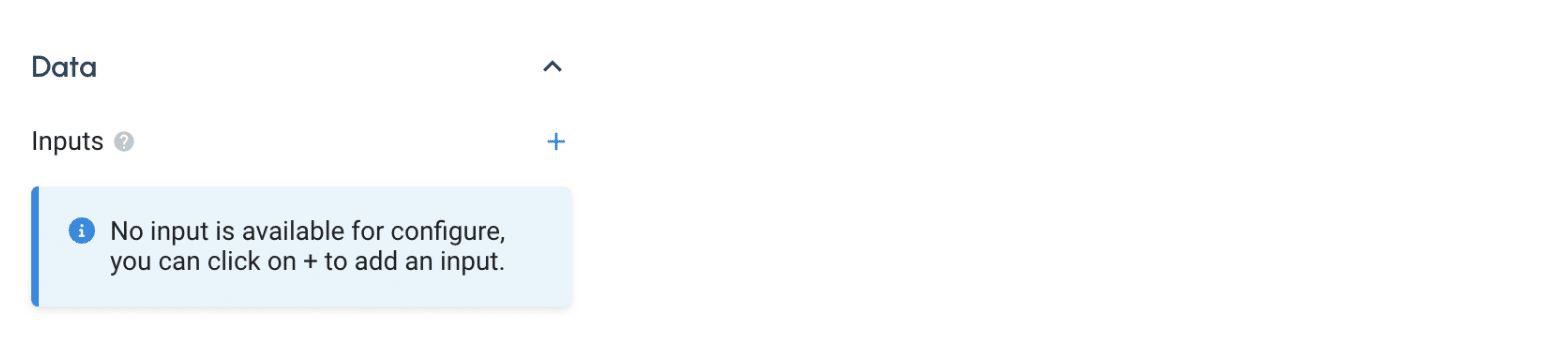
Create a new Inputs widget by selecting Inputs from the new widget menu. To add user input to the widget, you need to click on + button in the settings panel under Data > Inputs section.
You can create the following 2 inputs:
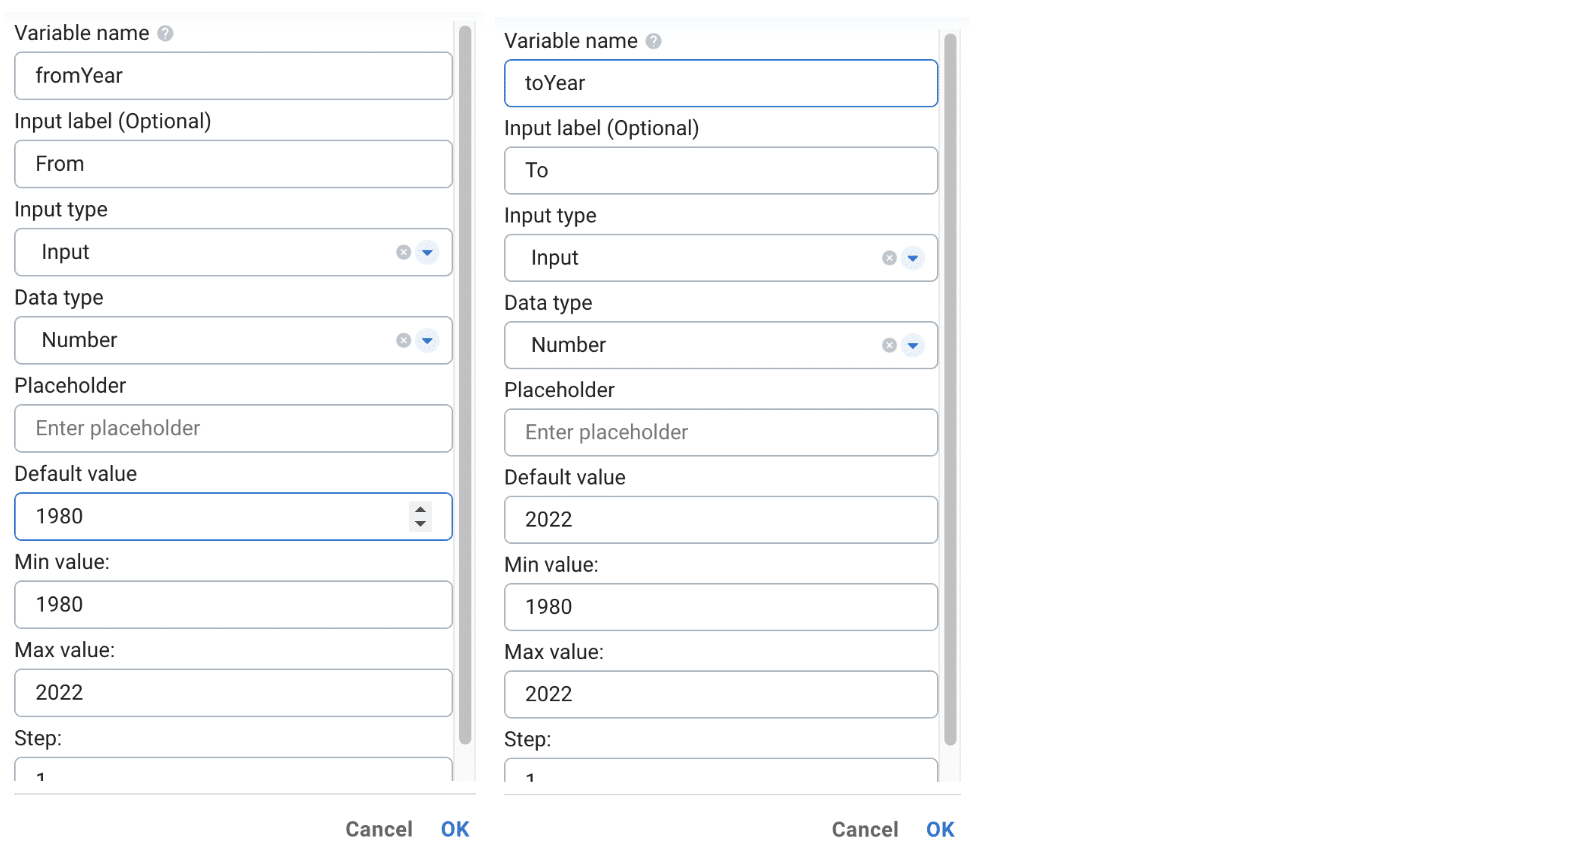
This is what it will look like when the above 2 inputs are created. Please note that variable name is the identity name of each input, it will be used when users need to link to this input from another widget or page.
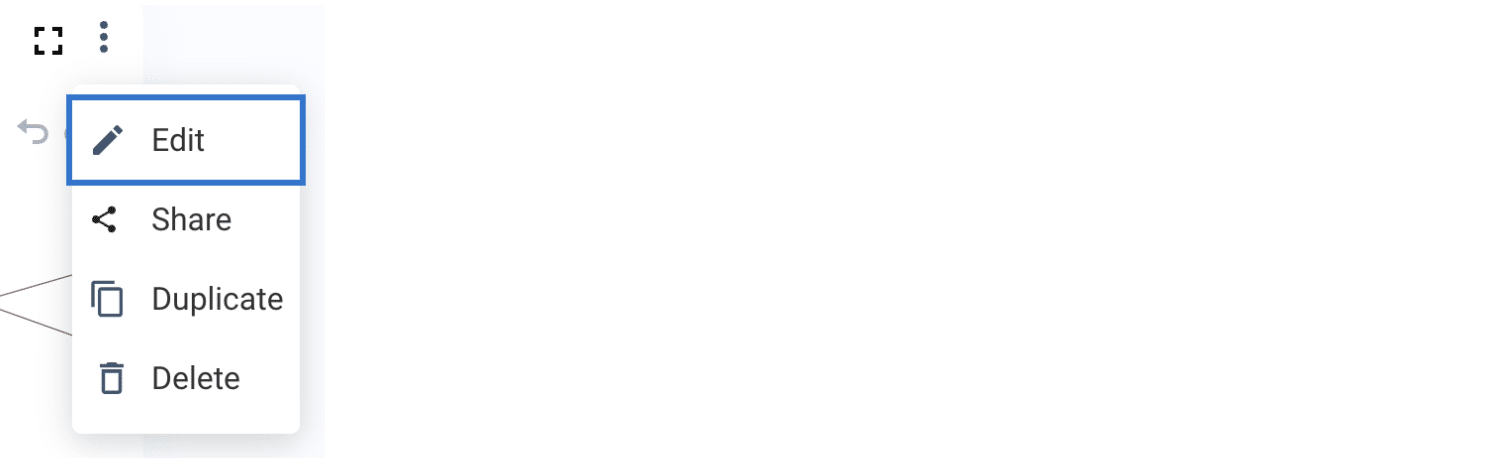
Now, we can link the input variable to the graph widget we created earlier. To do that, you can click the three dots on the graph widget and select Edit the widget.
In the pattern search box, you can click on the small + button when hovering over each object to add filters on it. Please add the following 2 conditions to “released” property on the Movie vertices as follows:

After applying the change, if you update the from and to year in the input boxes, the graph will be reloaded based on the selected movie release year range.
Create a Widget using GSQL query
As mentioned earlier, Insights supports human language like pattern search, as well as the powerful GSQL query language for more advanced users.
Let’s create a GSQL query based single value widget by selecting Single Value from the new widget menu.
Instead of using pattern search, we can switch to GSQL in the leftmost dropdown menu.
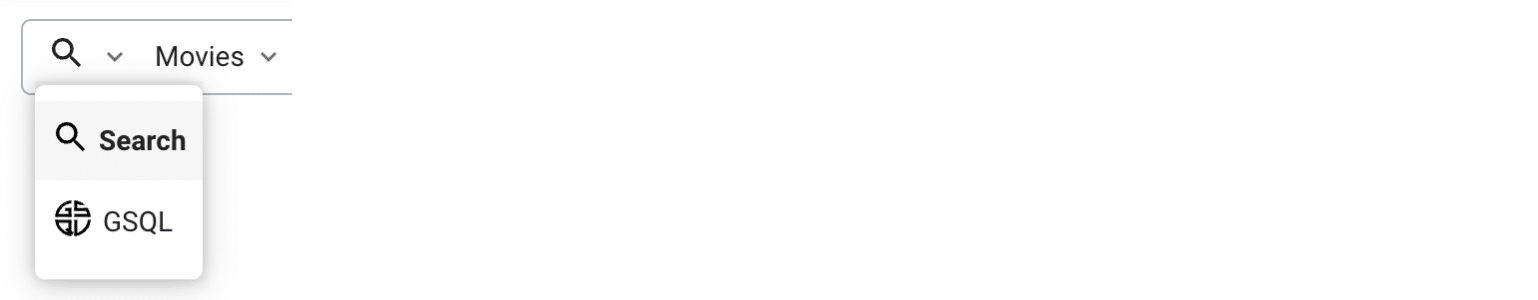
After the switch, the pattern search box becomes a GSQL query editor.
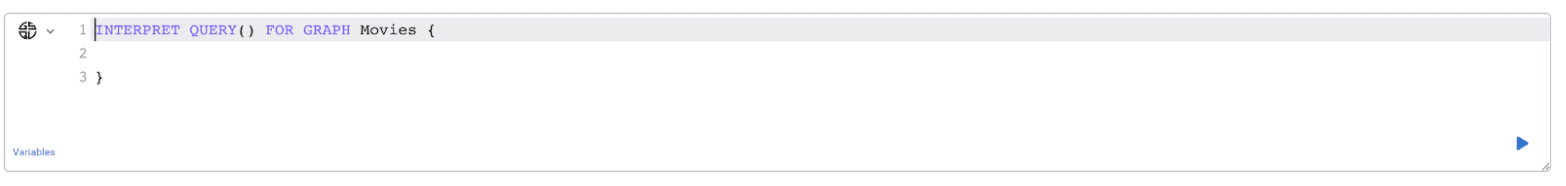
Please copy the following query to your query editor and run the query. You can also change the icon, color and size of the single value.
INTERPRET QUERY(INT fromYear, INT toYear) FOR GRAPH Movies {
    SELECT COUNT(p) AS totalNumber INTO T
    FROM Movie:p
    WHERE p.released >= fromYear and p.released <= toYear;
    PRINT T;
}
After applying the change you can move and resize the single value widget to following position:
Create Table Widget
Table is a popular view to augment visual graph view since it provides users a familiar way to see multiple rows and columns at once. Create a new table widget by selecting Table from the new widget menu. Please search for the following pattern using variables we have already created.

You will also need to configure the columns in the Data section on the right.
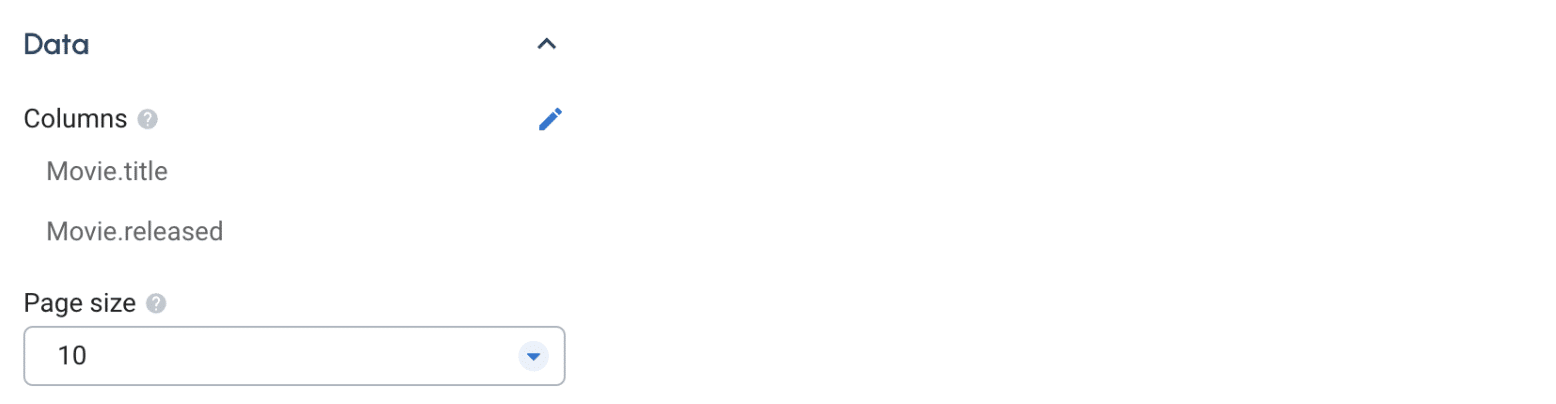
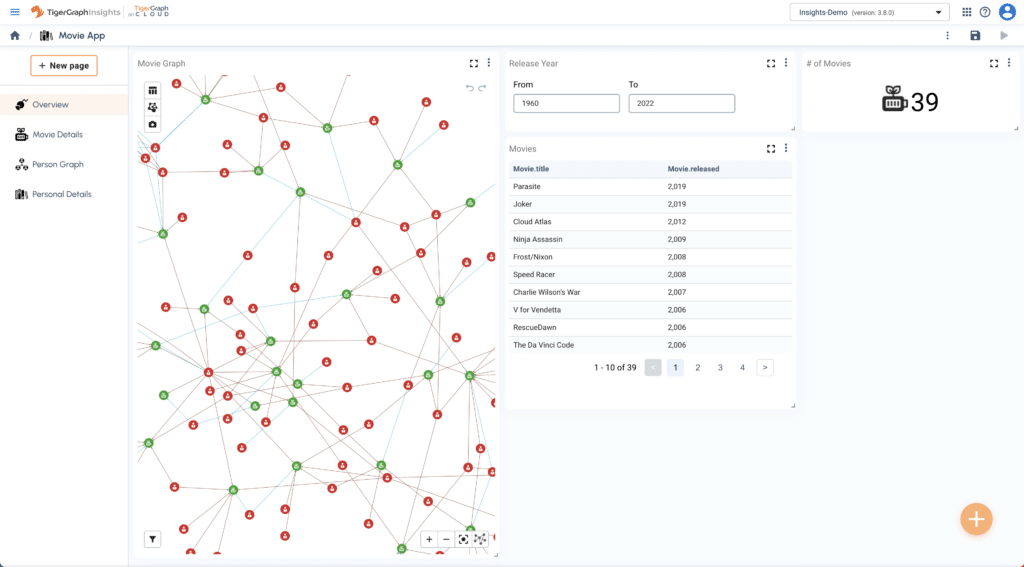
After applying the change and moving the widget in the dashboard, it should look like this:
Create Pie Chart Widget
Pie chart is a traditional BI chart we’ve seen in many dashboards. You can also add one to your application.
Create 2 pie chart widget by selecting Pie Chart from the new widget menu. One for Top 10 Directors and another one for Top 10 Actors/Actresses. Please also use the following GSQL queries respectively.
INTERPRET QUERY(INT fromYear, INT toYear) FOR GRAPH Movies{
    SELECT p.name AS Director, count(m) AS MovieCount INTO T
    FROM Person:p -(DIRECTED>:e)- Movie:m
    WHERE m.released >= fromYear AND m.released <= toYear
    GROUP BY p
    ORDER BY count(m) desc
    LIMIT 10;
    PRINT T;
}
INTERPRET QUERY(INT fromYear, INT toYear) FOR GRAPH Movies{
    SELECT p.name AS Name, count(m) AS MovieCount INTO T
    FROM Person:p -(ACTED_IN>:e)- Movie:m
    WHERE m.released >= fromYear AND m.released <= toYear
    GROUP BY p
    ORDER BY count(m) desc
    LIMIT 10;
    PRINT T;
}
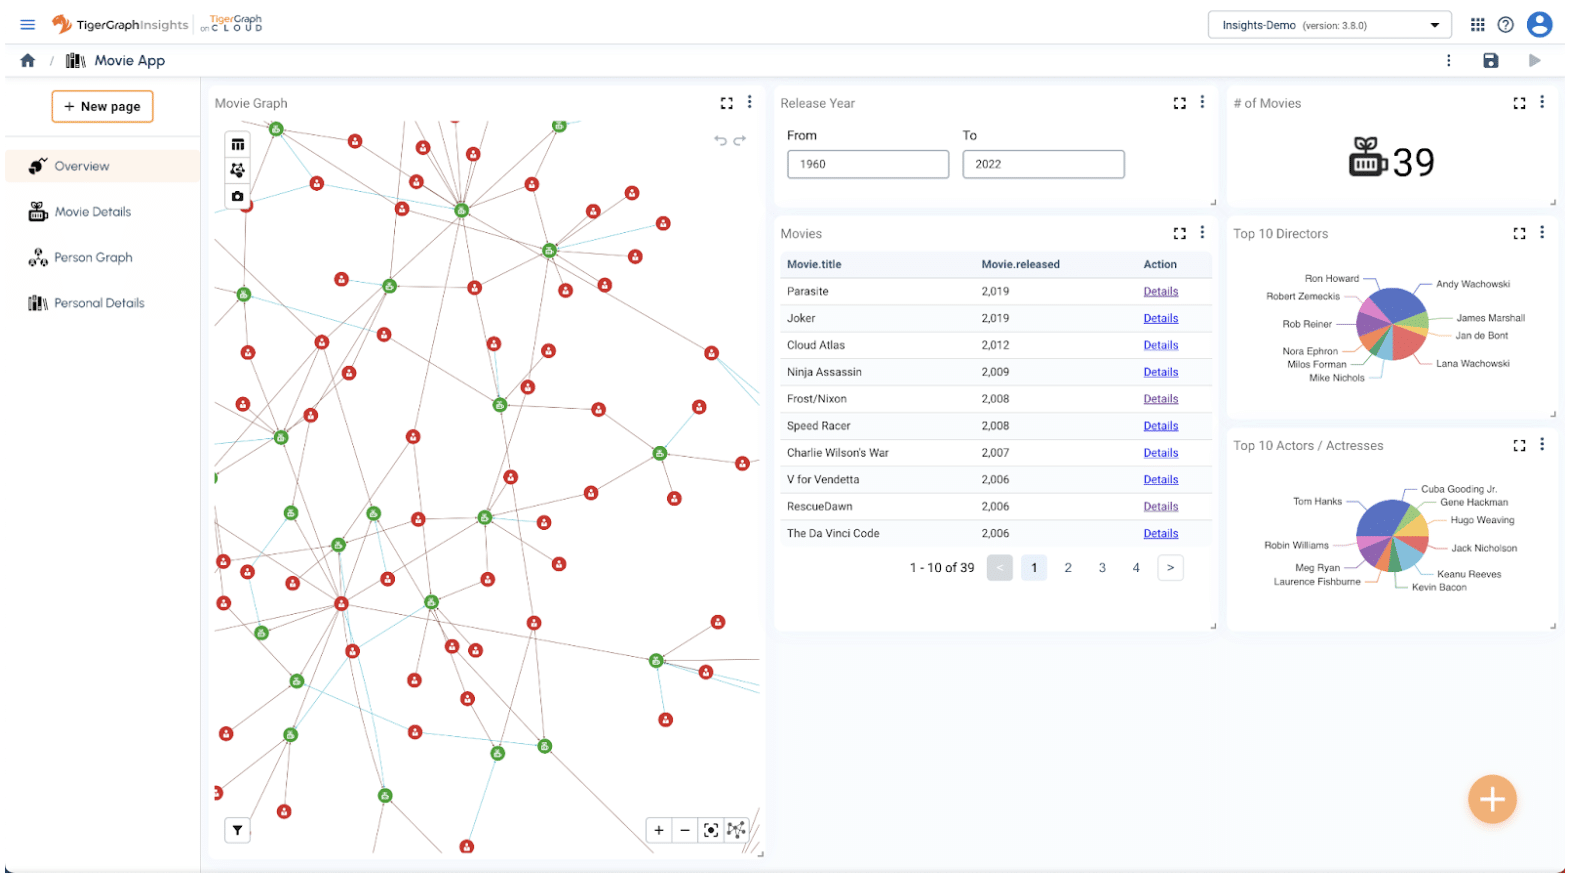
Apply and adjust the position/size to the following screen.
Create Line Chart Widget
Let’s add another line chart widget to the dashboard. Add a line chart widget via the widget selection menu, and give it the name Release Trend.
Use the following GSQL query to query the database:
INTERPRET QUERY(INT fromYear, INT toYear) FOR GRAPH Movies SYNTAX v2 {
    SELECT m.released, count(DISTINCT m) as totalCount INTO T
    FROM Movie:m
    WHERE m.released >= fromYear and m.released <= toYear
    GROUP BY m.released;
    PRINT T;
}
Now the first page is done.
Create another Graph Widget to Explore More Insights
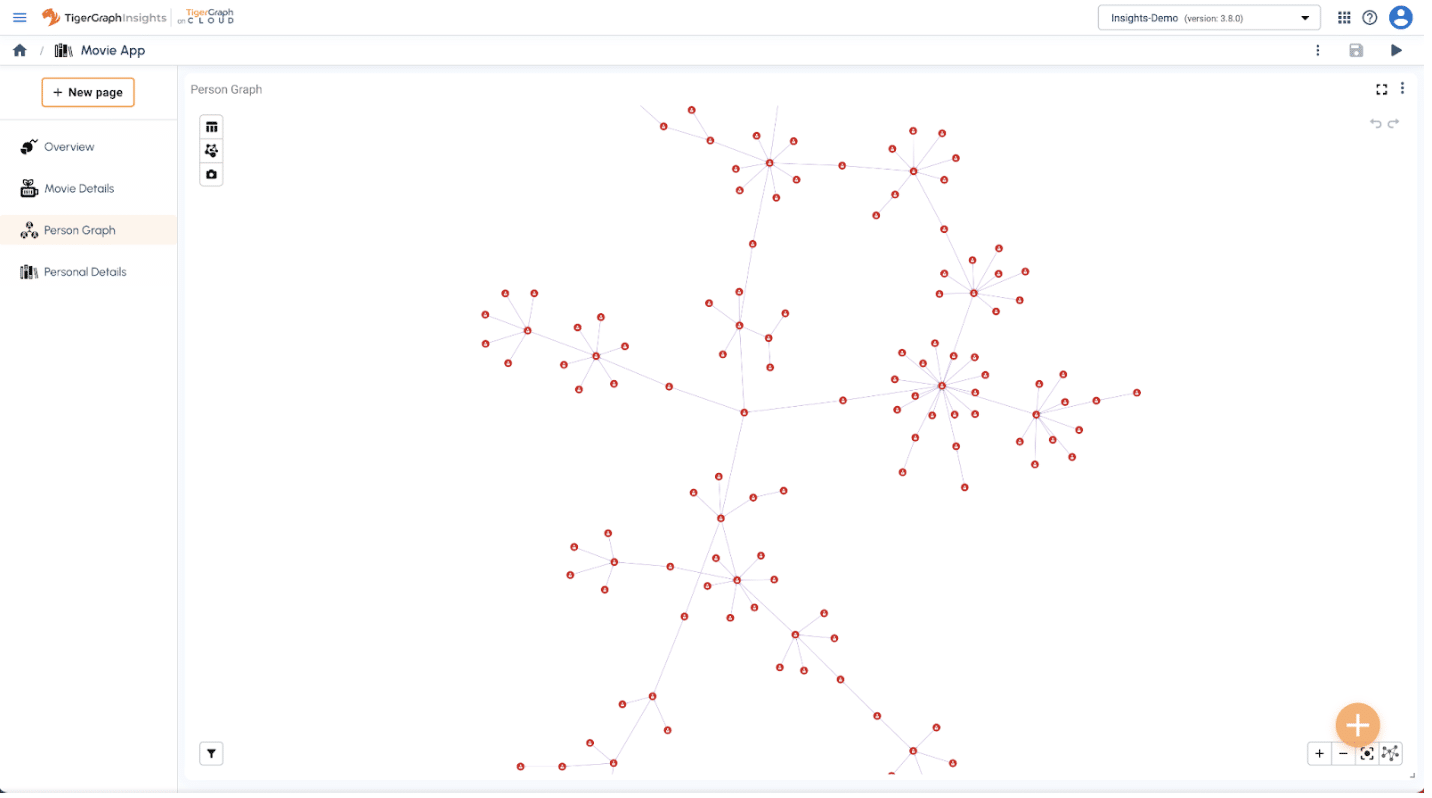
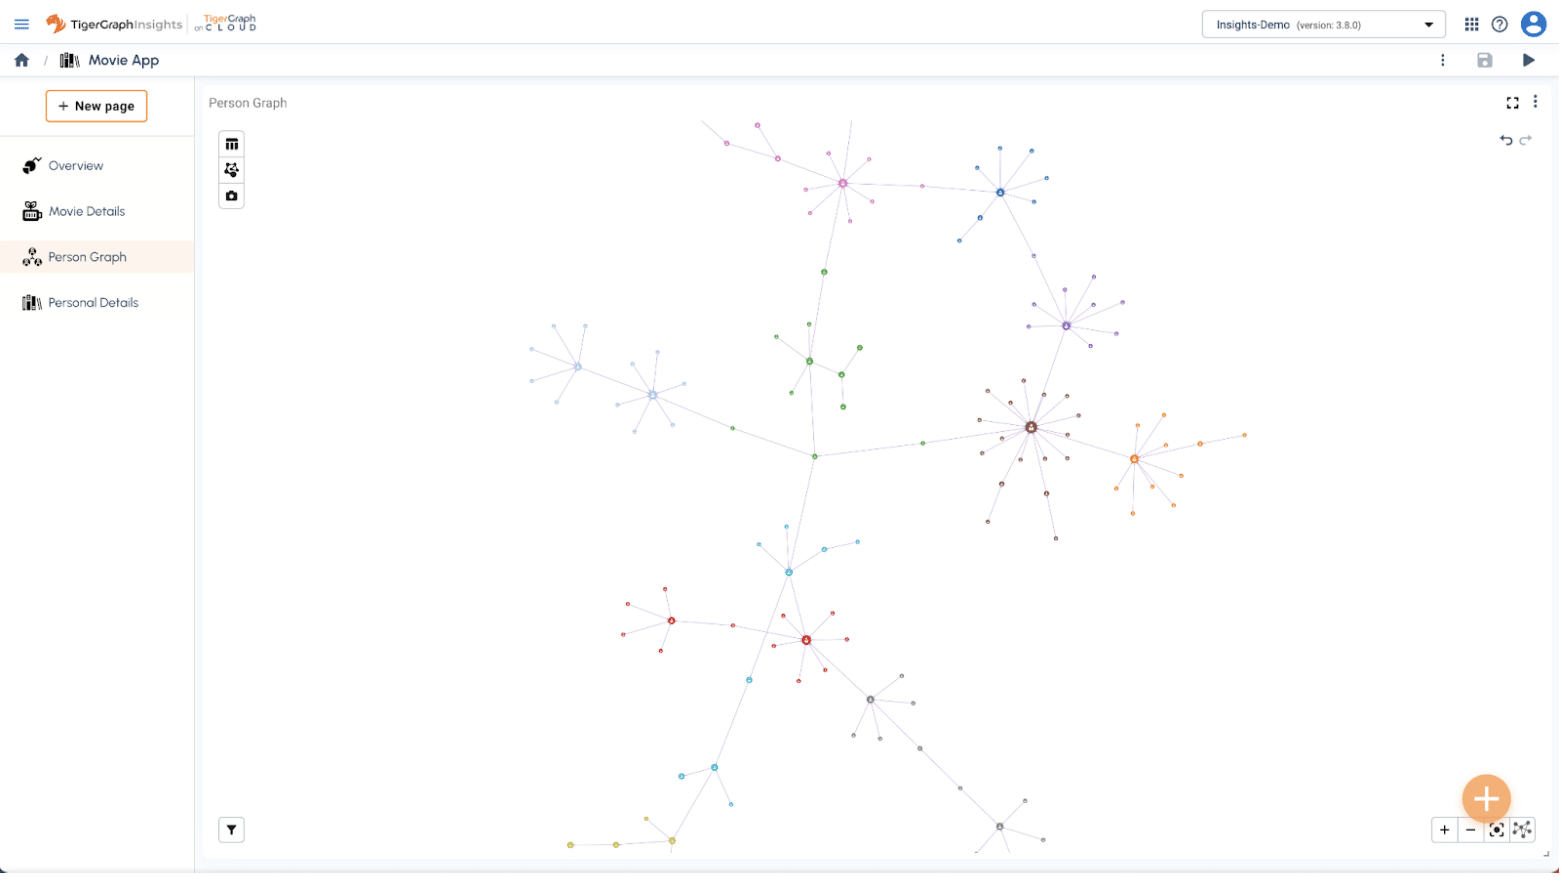
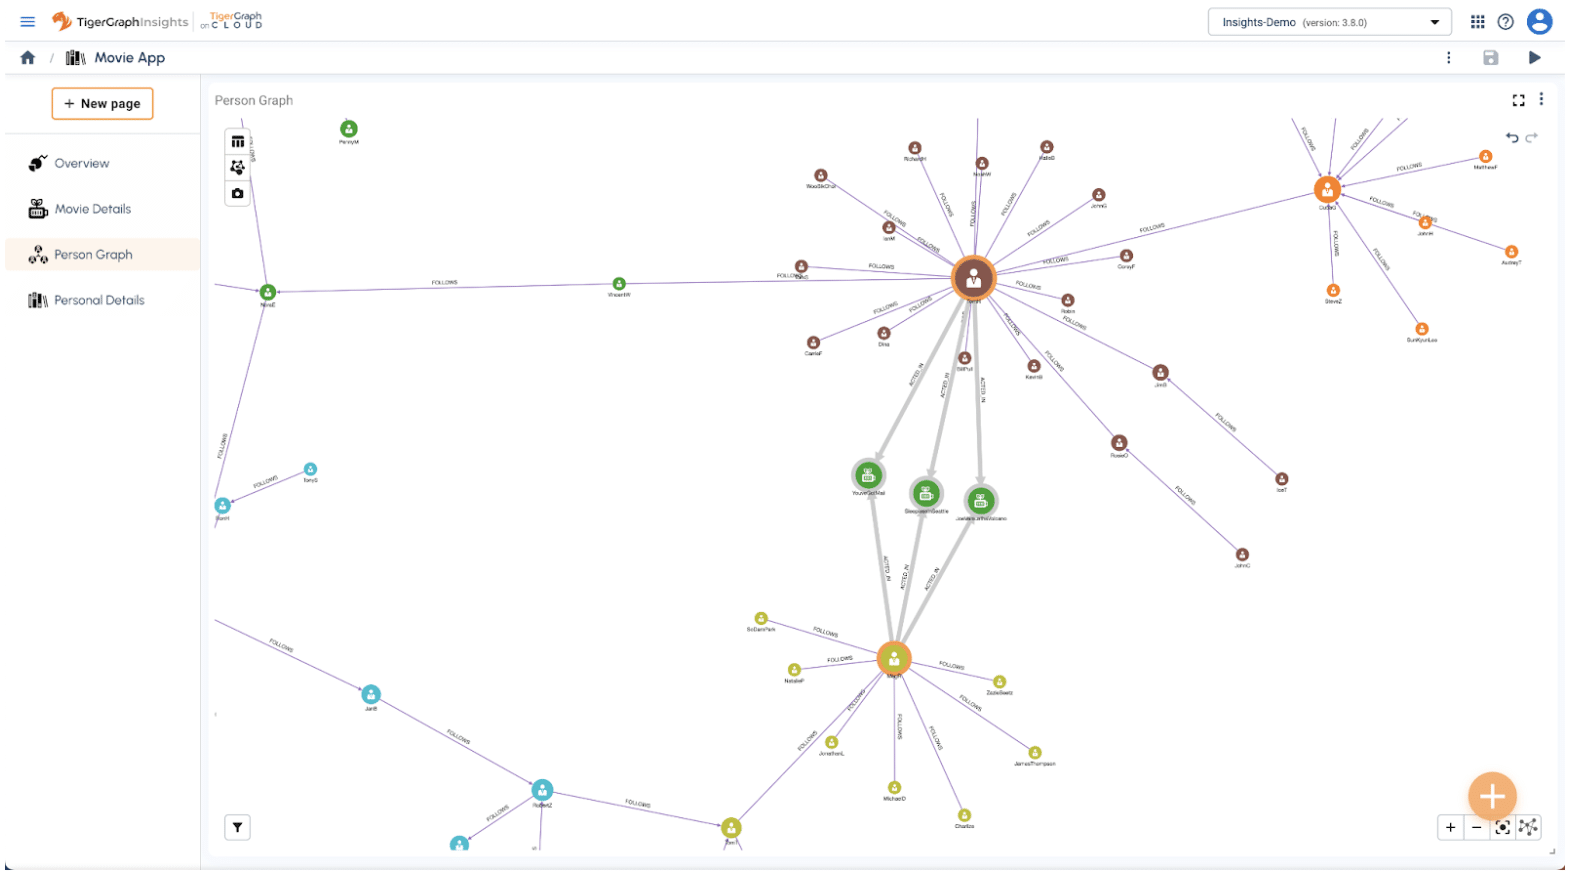
Let’s build another graph widget to try out the new graph algorithm experience in Insights. Go to the Person Graph page on the left navigation menu, create a Graph Widget and then add the following search pattern to run it.

Apply the change, and adjust the widget to fit the entire screen.
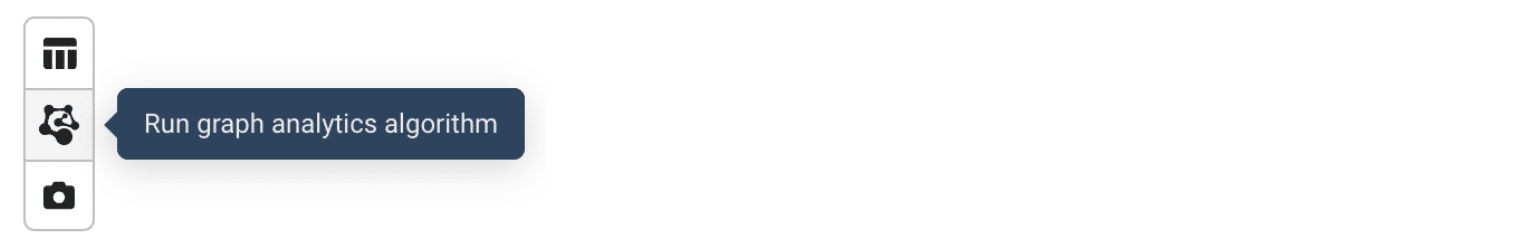
You can see the graph algorithm button on the upper left corner of the graph widget.
In this release, Insights supports 2 algorithms Page Rank and Louvain in preview. Both algorithms run based on the current results set in the graph widget, and it does not do a full graph search. If you’d like to run full graph algorithms, you can install algorithms in GraphStudio and then run the installed query in the pattern search box.

The Louvain algorithm partitions the vertices in a graph by approximately maximizing the graph’s modularity score. By applying the Louvain algorithm, you can do quick community detection on the current graph.
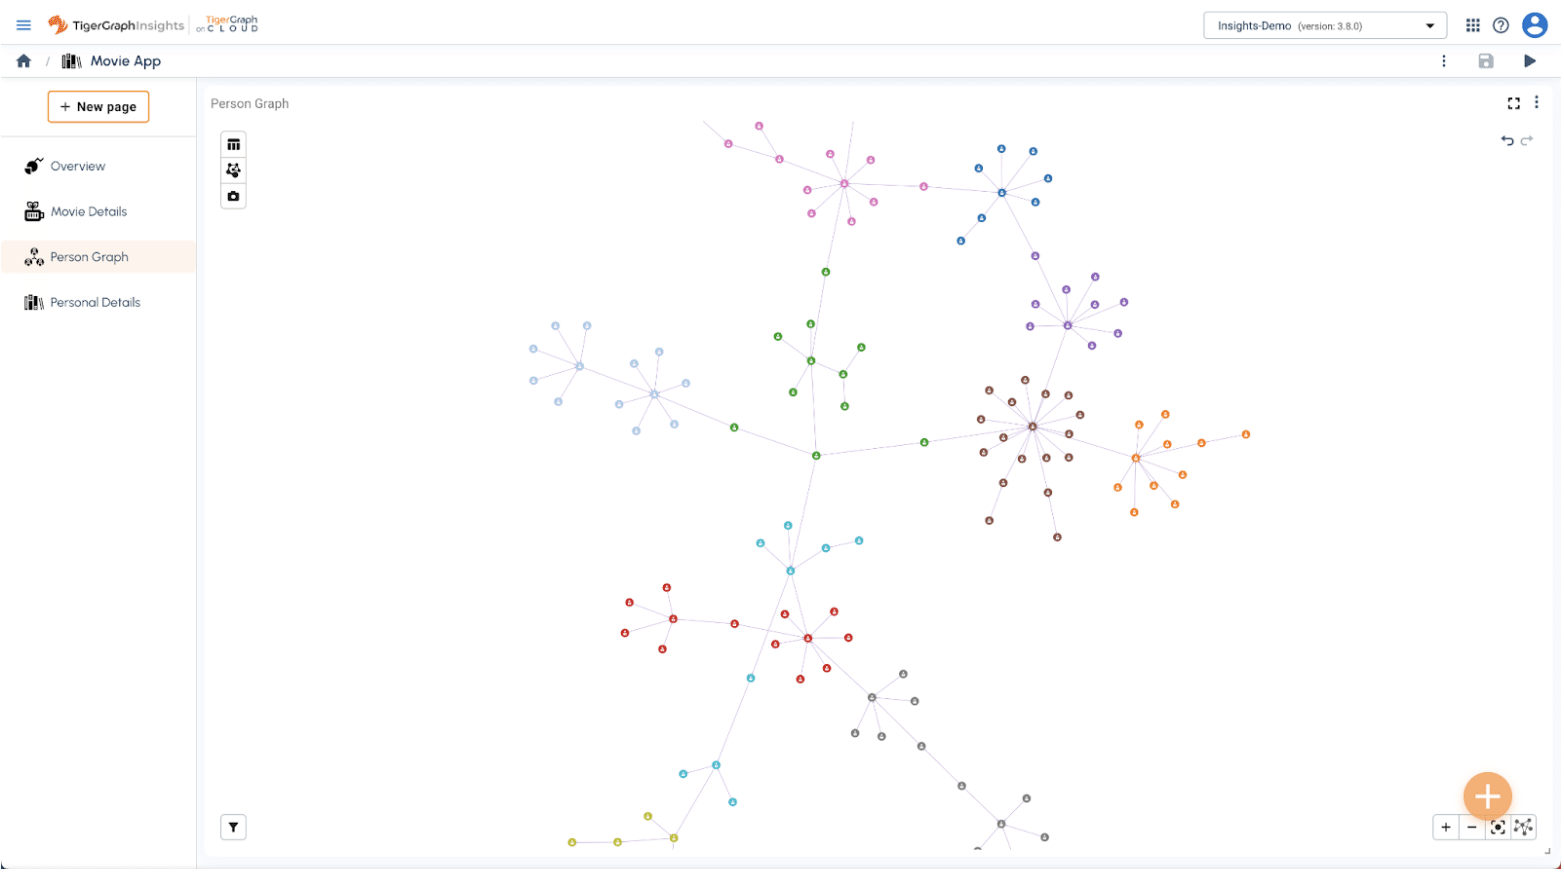
As shown above, the Louvain algorithm has partitioned and colored the vertices, you can easily see the different communities in the graph by their color.
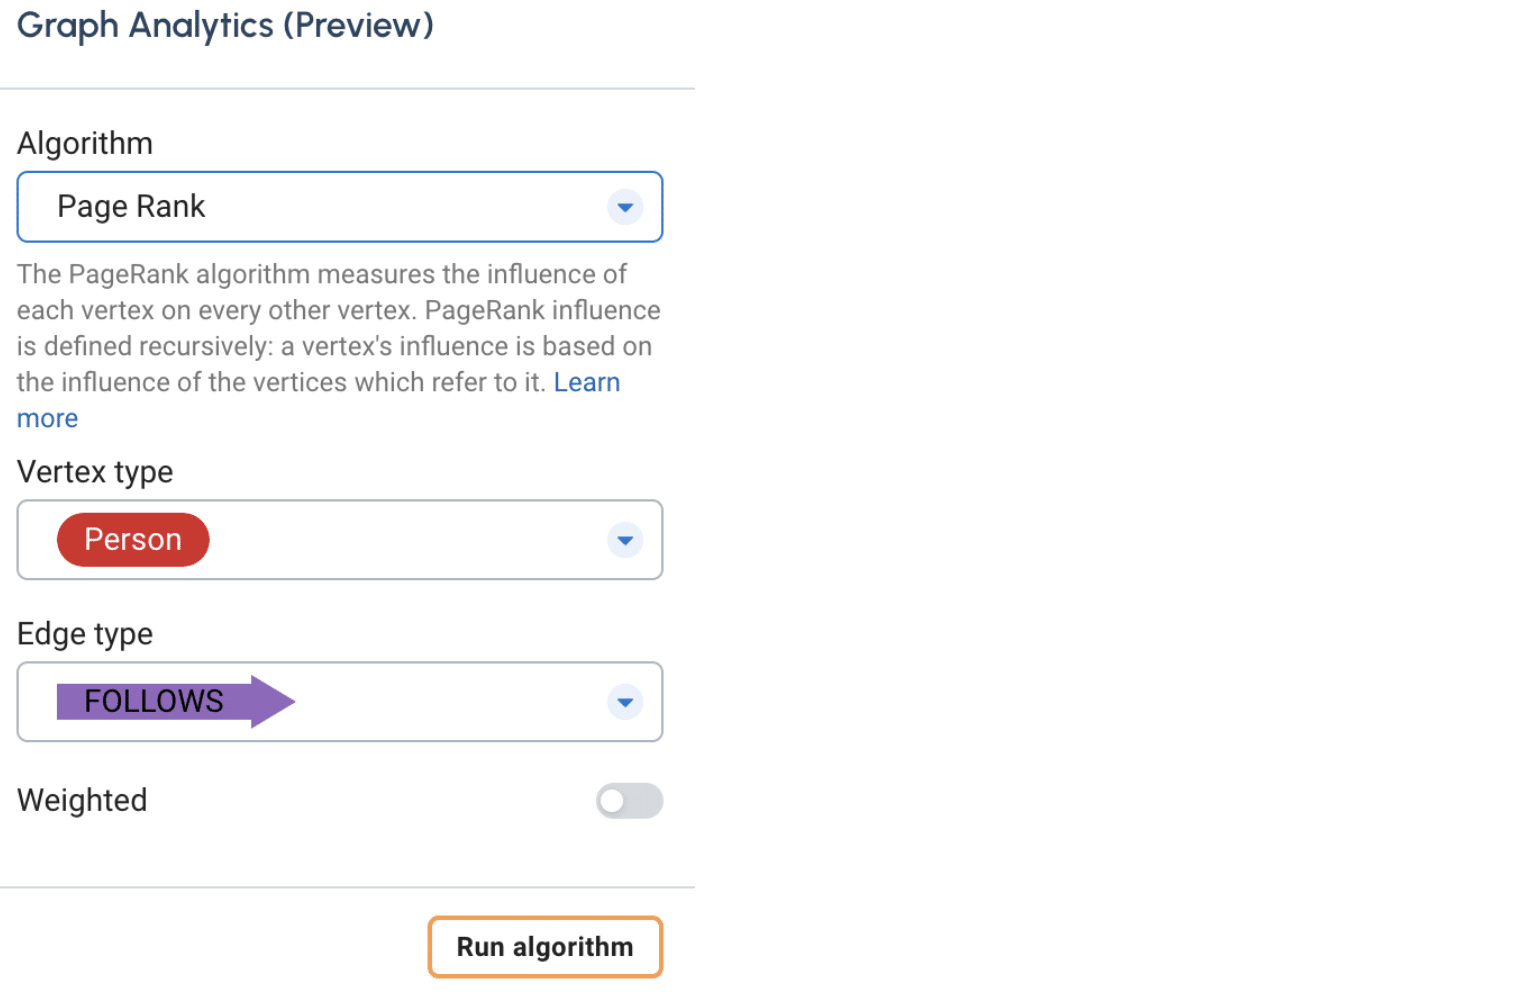
On the other hand, the PageRank algorithm measures the influence of each vertex on every other vertex. It requires a self-edge to be defined on the ranking vertex. You can also select the weighted option that uses a number-based attribute in the self-edge to do a more accurate page rank.
After applying page rank on the graph, it uses vertex size to visualize the algorithm results. You can easily find out that the bigger vertices represent higher page rank, whereas the smaller ones have lower page rank.
Note that the algorithm results are not saved to the server, users will need to apply the algorithms if needed.
What if I want to explore more data on top of the current graph? For example, I want to see all movies that are related to a person. With the Insights Graph widget, you can easily achieve it by right-clicking on the vertex you want to explore.
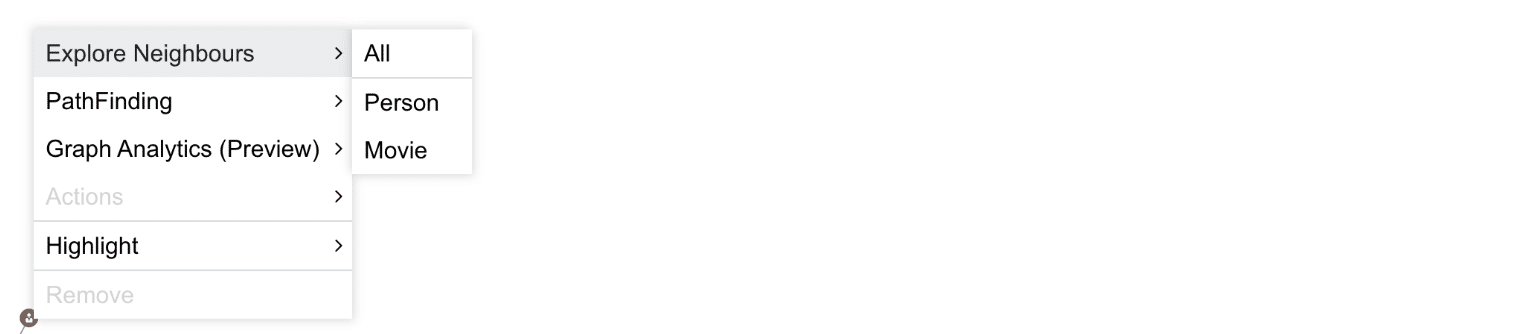
You can find out all neighborhoods for that specific vertex regardless of their type, or you can explore a certain neighborhood type. You can also use double click to explore all neighborhoods.
Pathfinding is also a great way to find out the relationship between two vertices. Hold the command/ctrl key to select 2 vertices, and right-click on one of the selected vertices to access pathfinding algorithms. Insights provides 2 pathfinding algorithms – One shortest path and All shortest paths.
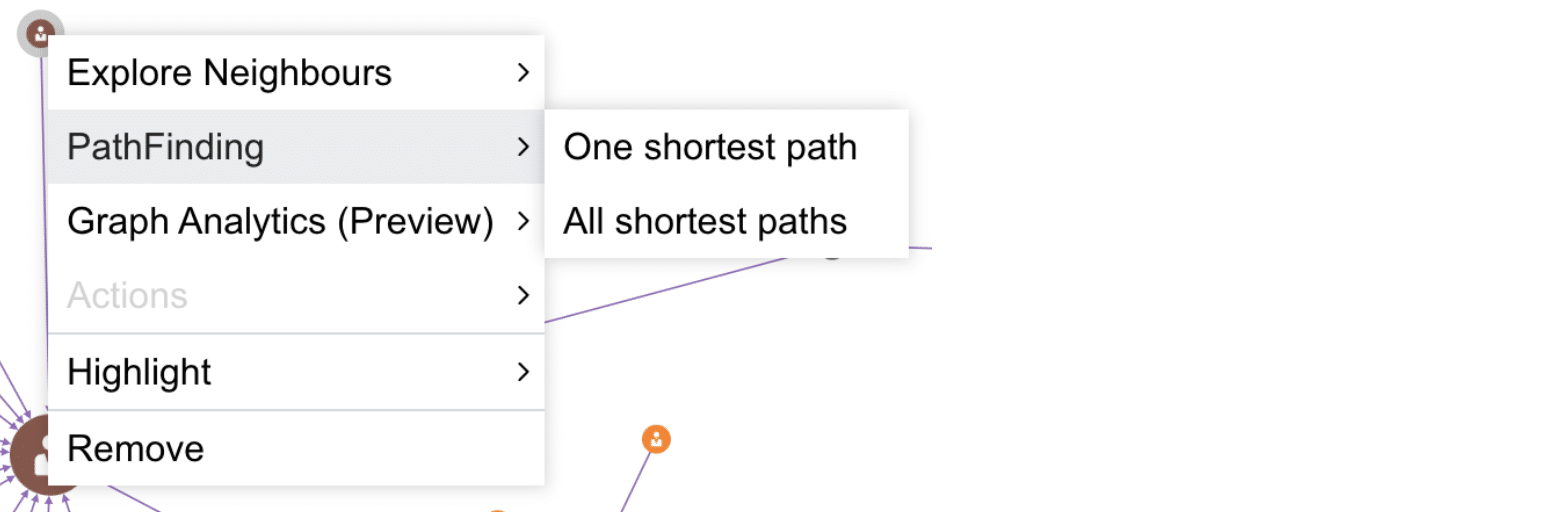
After applying the pathfinding algorithms, the matching path(s) will be highlighted:
Create Links Between Pages
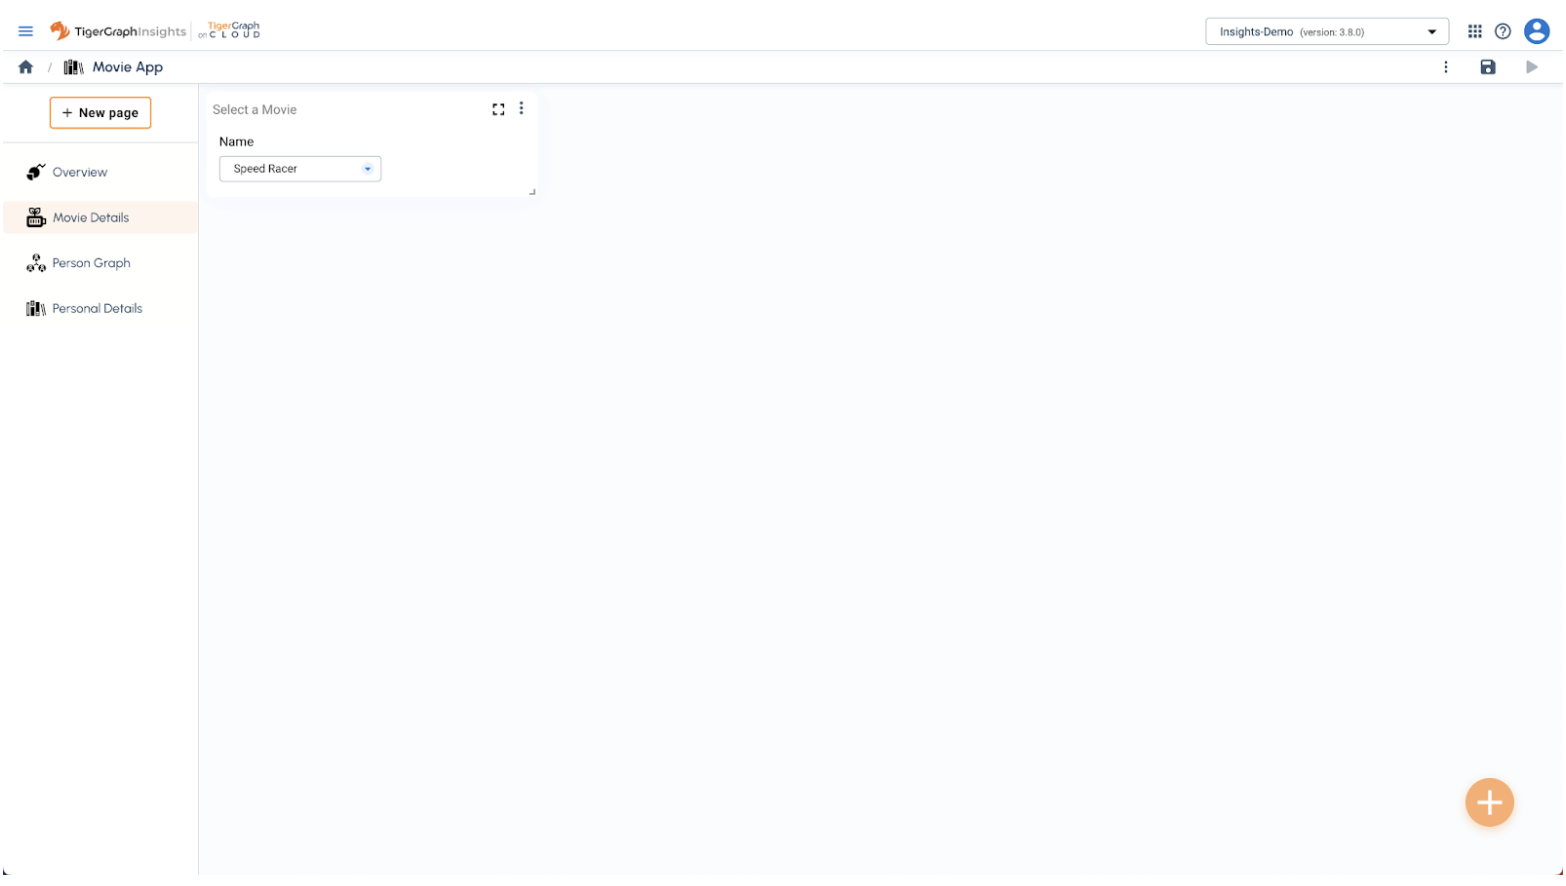
Does Insights support pass variables from one page to another through a link? The answer is yes. In this section, we will walk you through how to do that. Go to the Movie Details page on the left navigation menu, and create an Inputs Widget.
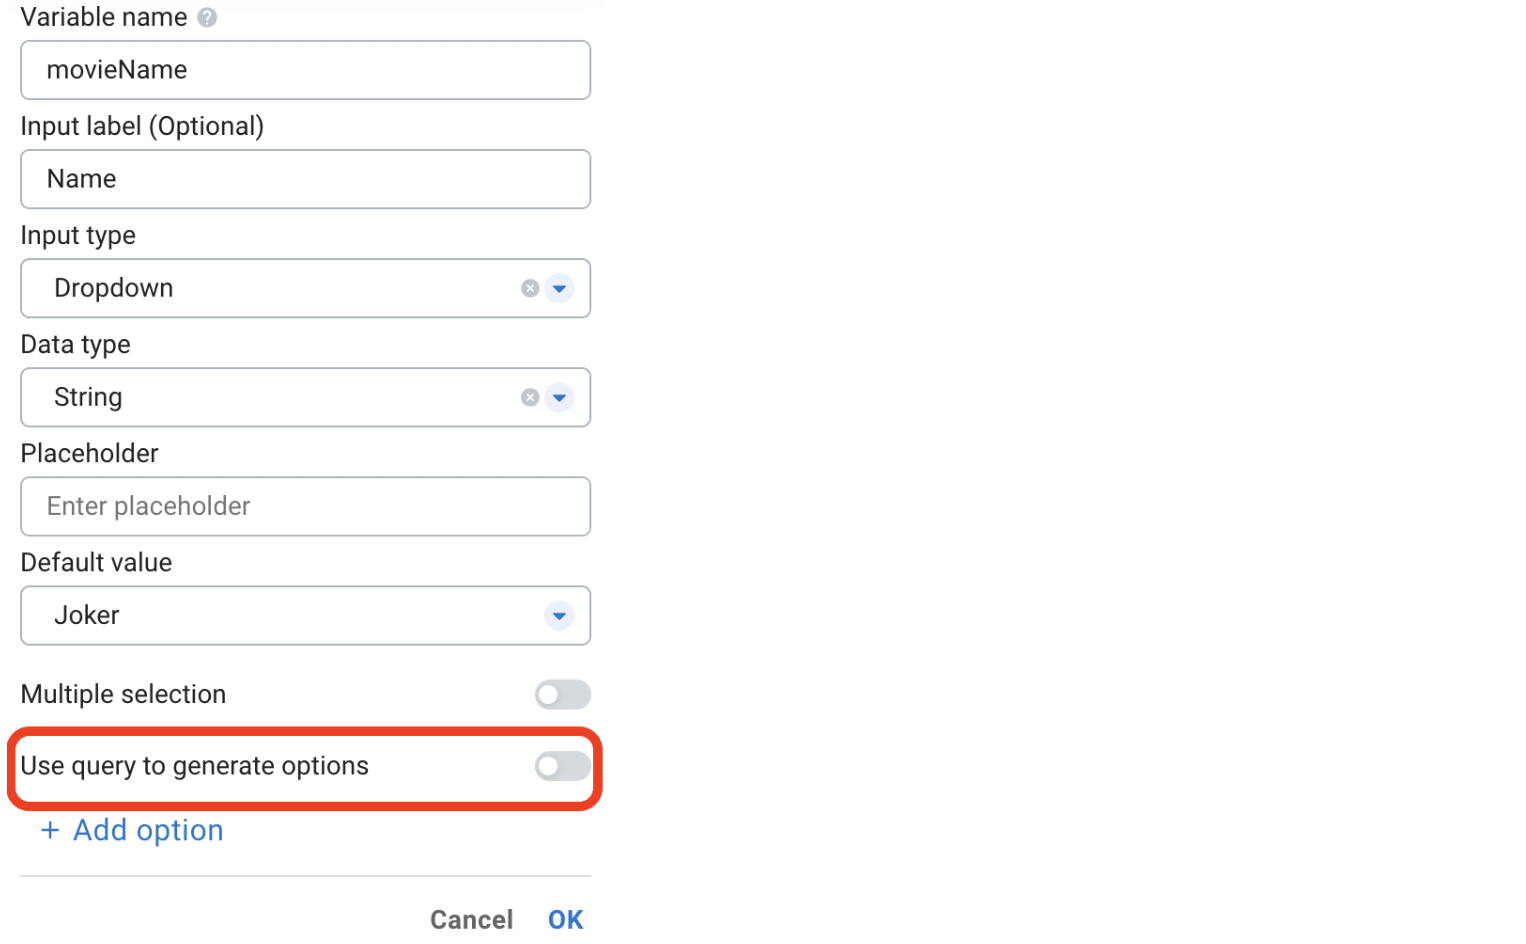
Add a new dropdown input, and give it a variable name movieName. Then click on Use query to generate options to retrieve the list of movies from the database.
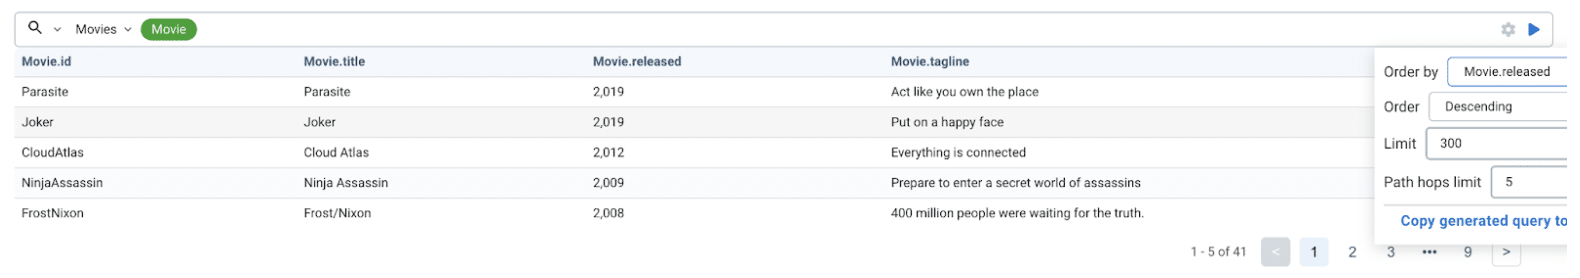
In the pop-up window, select Movie in the pattern search bar, and configure the order options, then run the search
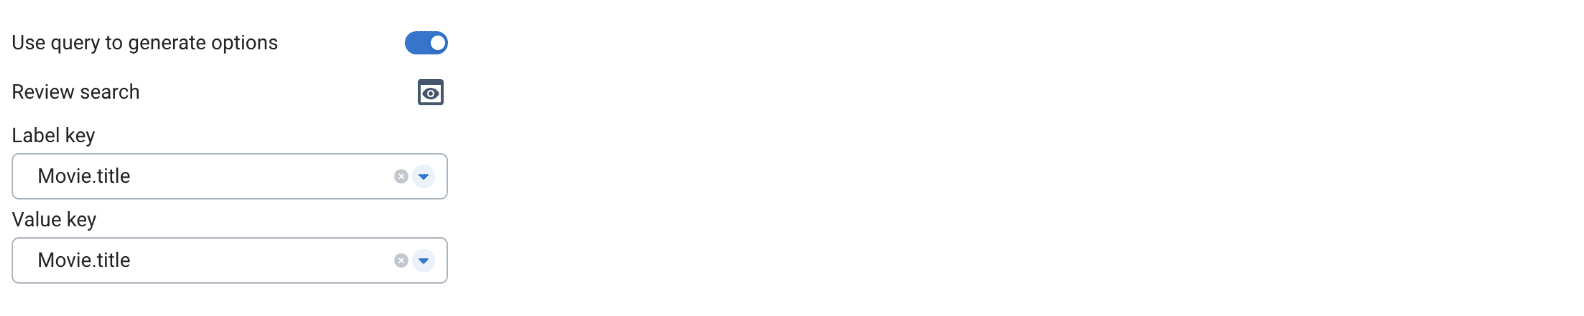
Click OK to save the search, then you should be able to configure the option key, and value like this. You can also select the default value from the dropdown.
Save the widget like the following screenshot:
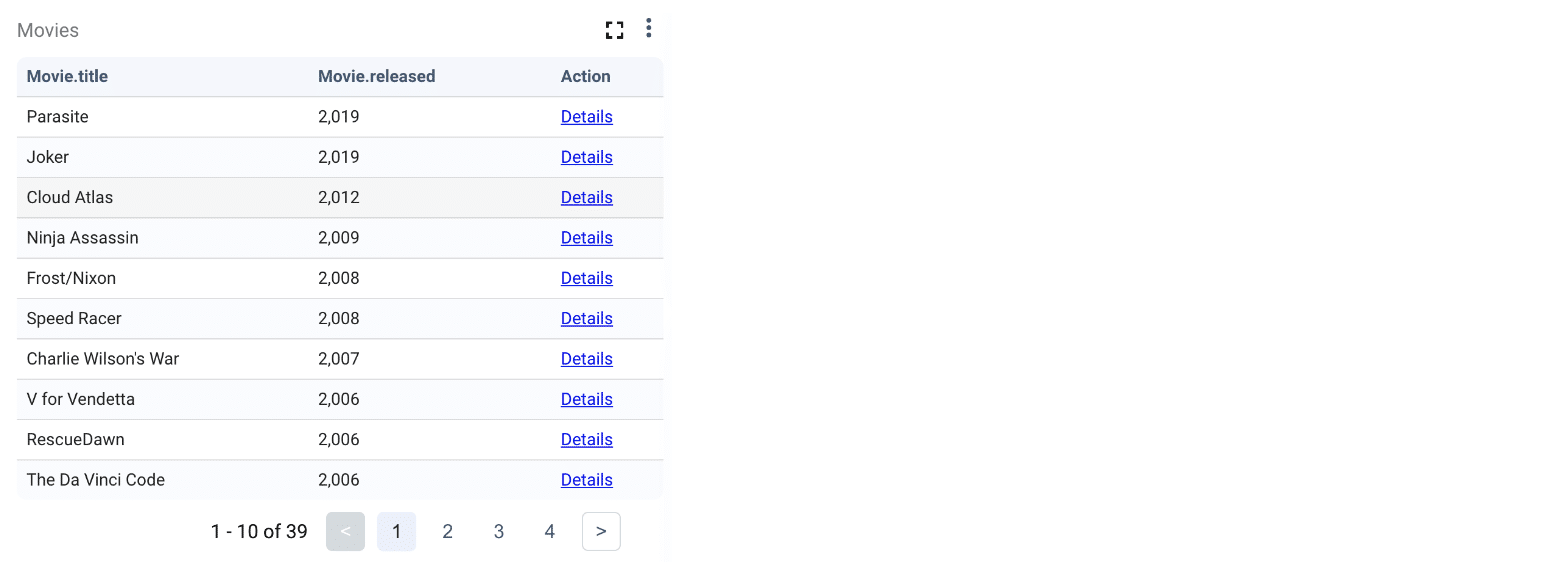
Now, you can navigate to the Overview page, and edit the Movies table widget we created earlier. In the Advanced section, you can add a new table action called “Details”. Change the URL to Movie Details page. After selecting the URL, the parameters will show all available input variables we defined on that page. The second dropdown allows you to choose a value from the current table row. In this case, we choose Movie.title to be passed to movieName variable in the Movie Details page.

After clicking OK, the table will show a new Action column. Apply change, you will be able to navigate to the Movie Details page by clicking the Details link on each movie row.
Complete Movie Details Page
Let’s go back to the Movie Details page to add more widgets based on the movieName variable.
For Release Year and Tagline, you can use the single value widget with the following queries:
INTERPRET QUERY(string movieName) FOR GRAPH Movies{
    SELECT m.released INTO T
    FROM Movie:m
    WHERE m.title == movieName;
    PRINT T;
}
INTERPRET QUERY(string movieName) FOR GRAPH Movies{
    SELECT m.tagline INTO T
    FROM Movie:m
    WHERE m.title == movieName;
    PRINT T;
}
Then add another graph widget to show all person related to the selected movie
INTERPRET QUERY(string movieName) FOR GRAPH Movies{
    SELECT p,m,e INTO T
    FROM Person: p -(_>:e)- Movie:m
    WHERE m.title == movieName;
    PRINT T;
}
Add 4 tables, each of them lists directors, actors/actresses, writers and producers for that movie. We can use the following pattern to list all directors for a selected movie.

Adjust the dashboard layout to fit each widget nicely.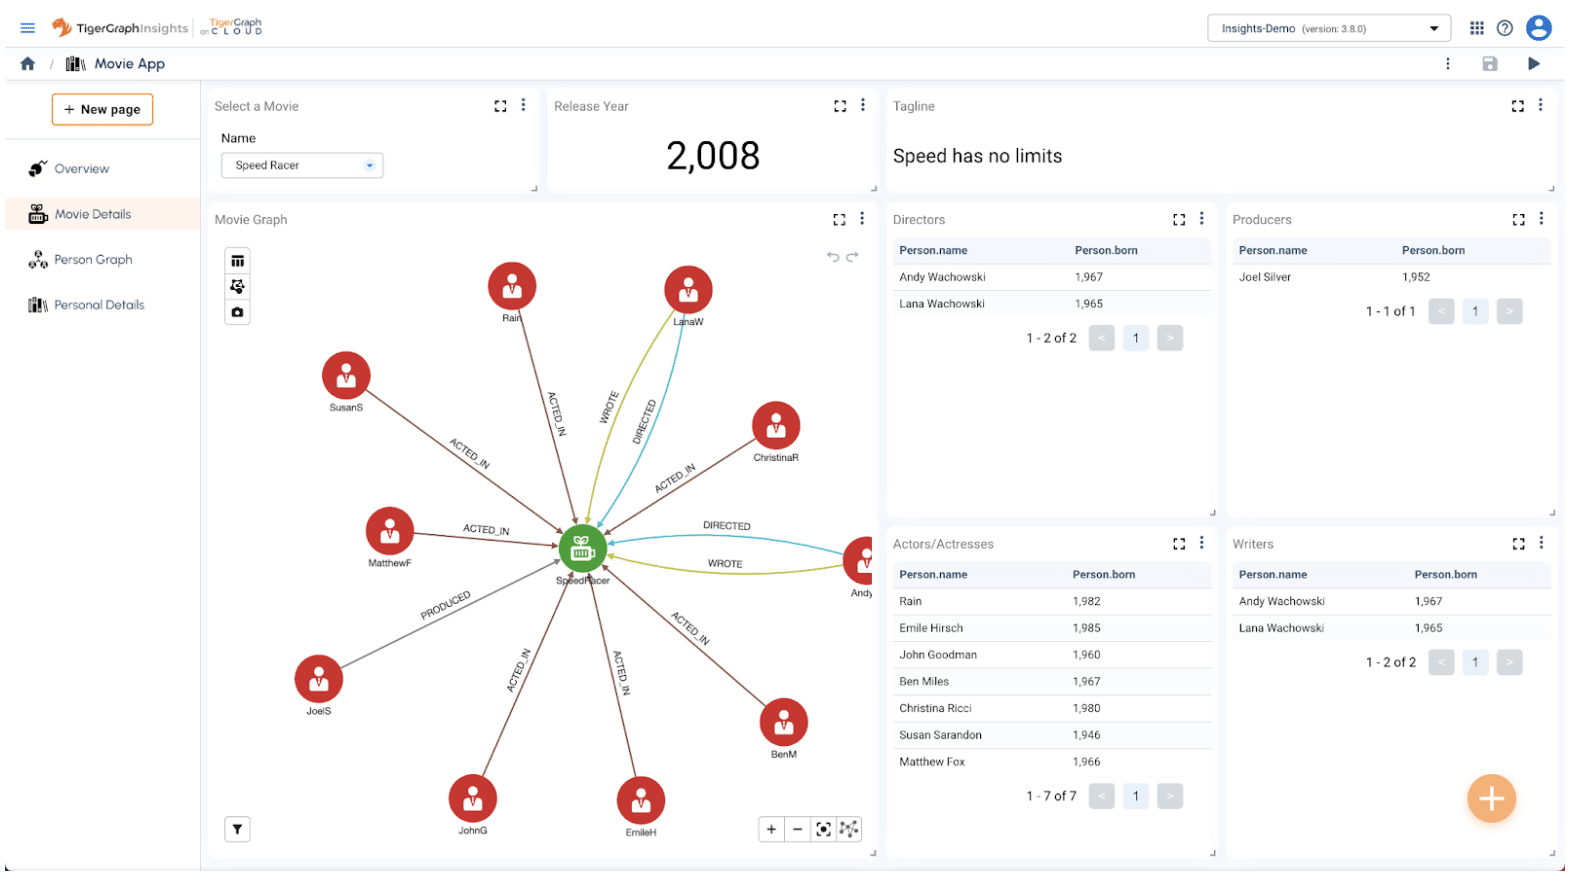
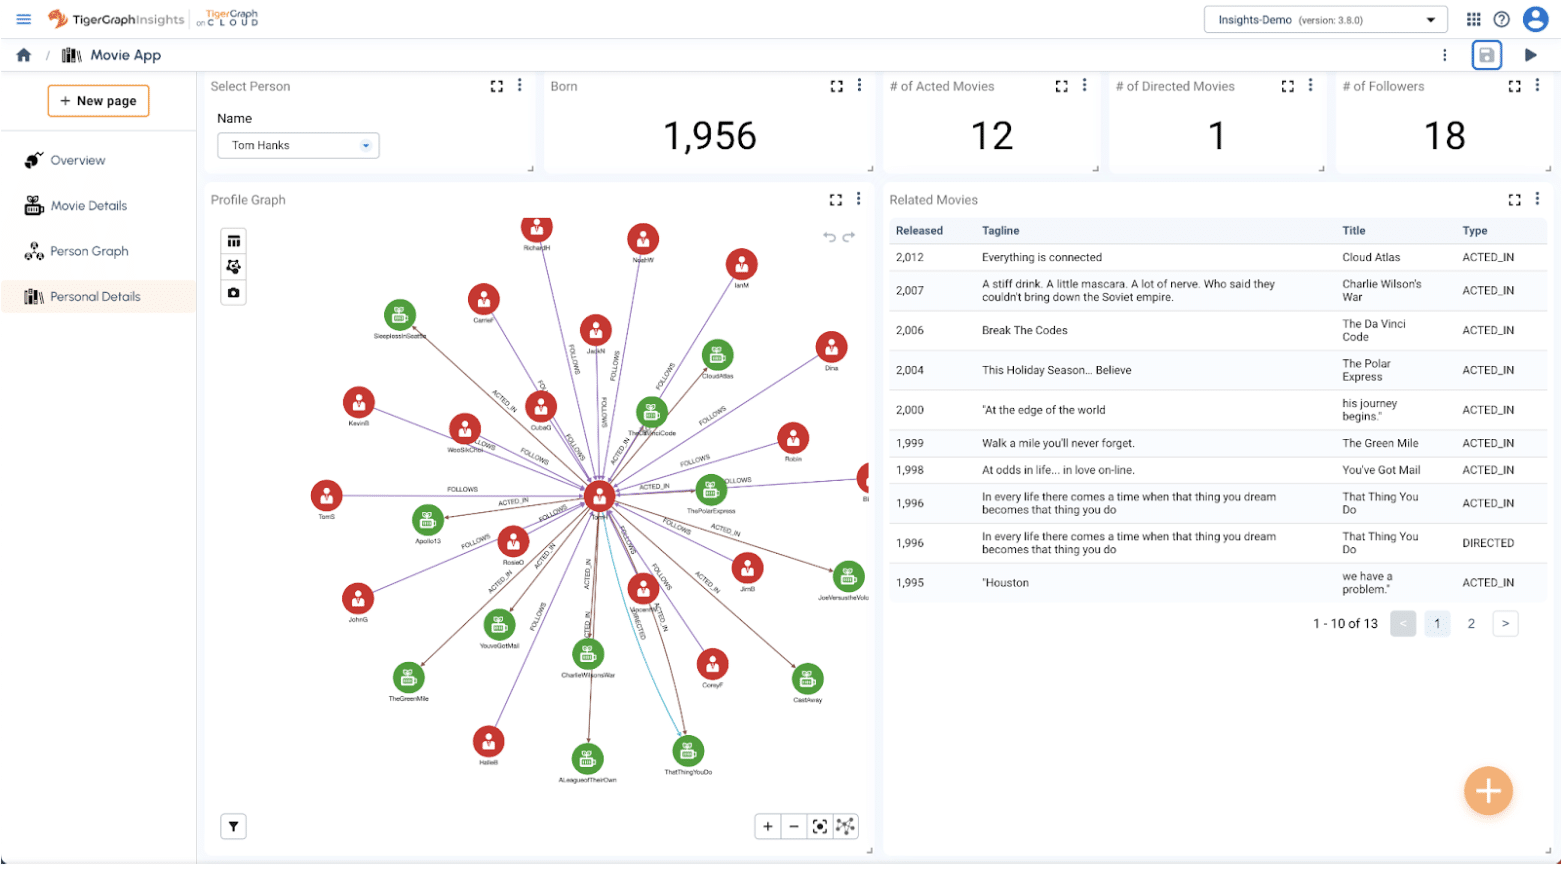
Complete the Personal Details Page
The last page is Personal Details. As the same as the Movie Details page, we can first create a personName variable in Inputs Widget. This allows us to navigate to the Personal Details page from other pages.
Then add single value widgets to show some detailed information about the selected person, e.g. born year, number of acted movies, number of directed movies, and number of followers.
Then add a graph widget called Profile Graph to list all related movies as well as all followers in the database.
The last widget to add is to list all related movies in the table view.
Finally, adjust each widget to the desired position.
Conclusion
Congratulations, you have successfully created a rich and interactive visual graph analytics application using TigerGraph Insights! Simple, huh?
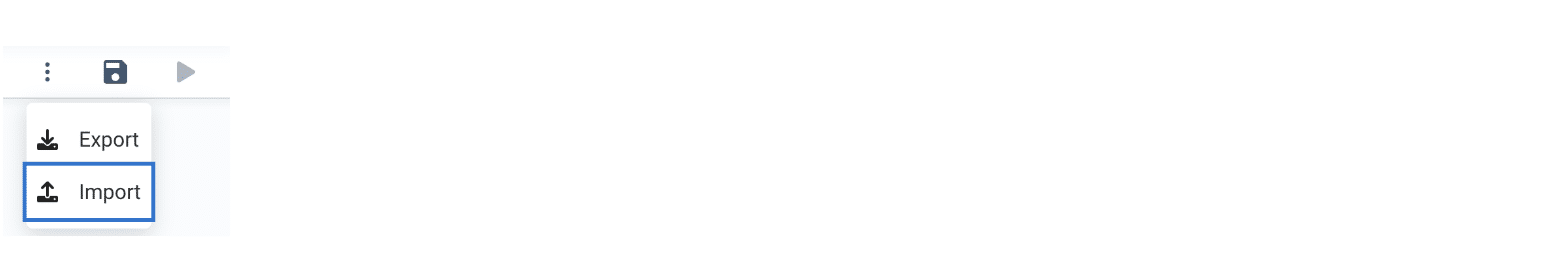
If you do not want to go through all the above steps, Insights allows you to import an application in seconds. Just download the application file from here and import it via the Import function on the upper right menu. This will give you a completely built application.
You can share this application for others to view by clicking on the preview button in the upper right corner, then send the URL from the newly opened tab to others.

Please feel free to share your comments, and suggestions or seek help at TigerGraph Developer Forum here.
Get started with TigerGraph Cloud today for free. No credit card is required.


